
An Integrated Recurrent Neural Network and Regression Model with
Spatial and Climatic Couplings for Vector-borne Disease Dynamics
Zhijian Li
1
, Jack Xin
1
and Guofa Zhou
2
1
Department of Mathematics, UC Irvine, Irvine, CA 92617, U.S.A.
2
Program in Public Health, School of Medicine, UC Irvine, Irvine, CA 92617, U.S.A.
Keywords:
Geospatial and Climatic Data, Integrated Spatio-temporal Network Model, Vector-borne Disease Forecasting.
Abstract:
We developed an integrated recurrent neural network and nonlinear regression spatio-temporal model for
vector-borne disease evolution. We take into account climate data and seasonality as external factors that
correlate with disease transmitting insects (e.g. flies), also spill-over infections from neighboring regions sur-
rounding a region of interest. The climate data is encoded to the model through a quadratic embedding scheme
motivated by recommendation systems. The neighboring regions’ influence is modeled by a long short-term
memory neural network. The integrated model is trained by stochastic gradient descent and tested on leish-
maniasis data in Sri Lanka from 2013-2018 where infection outbreaks occurred. Our model out-performed
ARIMA models across a number of regions with high infections, and an associated ablation study renders
support to our modeling hypothesis and ideas.
1 INTRODUCTION
Leishmaniases are tropical diseases caused by leish-
mania parasites and transmitted through the bites of
vector sand flies. The cutaneous leishmaniasis (CL)
is the most common threat and health risk in devel-
oping countries in the tropical regions. In this pa-
per, we study data from Sri Lanka that has reported a
substantial surge in clinical leishmaniasis cases in the
past 20 years (Fig.1, a)). Previous studies Siriwardana
et al. (2010); Karunaweera et al. (2018) found that (1)
leishmaniasis epidemics in Sri Lanka had two trans-
mission hot spots, one on the south coast and another
in the north central region of the country (Fig.1,b)),
with a biannual seasonal variation; (2) outdoor activ-
ities, including occupational exposure and living near
a vector breeding area, are some of the key risk fac-
tors of infection. An important scientific task for pub-
lic health is to model the spatio-temporal dynamics
in leishmaniasis transmission and the driving forces
behind it, thereby help predict future infections and
outbreaks.
In this paper, we aim to generalize and advance
existing geo-statistical and ecological models Kyri-
akidis and Journel (1999); Elith and Leathwick (2009)
by incorporating spatio-temporal transmission factors
such as climate effects and local carryover of infec-
tions from neighboring regions. Our main contribu-
tions are:
(1) modeling leishmaniasis spread between neighbor-
ing areas by a recurrent neural network with input
data from up to three most infected neighbors;
(2) including climate data input as an external factor,
since the development of both the sand flies and the
parasites inside their guts are affected by climatic con-
ditions;
(3) hybridizing (1) and (2) with regression to form
an integrated nonlinear space-time model trained by
stochastic gradient descent on 51 months (2013-03 to
2017-08) and tested on 18 months (2017-09 to 2018-
12) in 5 highly infected regions of Sri Lanka.
The rest of the paper is organized as follows.
In section 2, we review related prior work on in-
fectious disease modeling where climate and geo-
neighbor factors have been separately modeled. In
section 3, we outline pre-processing of raw data to
remove trend, and introduce our integrated model
structure with embedding operations of climate and
time stamps (monthly) motivated by design of rec-
ommender systems. In section 4, we go over train-
ing and test data, and compare prediction results with
ARIMA as baseline. In terms of both root mean
squares error and maximum absolute error, our in-
Li, Z., Xin, J. and Zhou, G.
An Integrated Recurrent Neural Network and Regression Model with Spatial and Climatic Couplings for Vector-borne Disease Dynamics.
DOI: 10.5220/0010762700003122
In Proceedings of the 11th International Conference on Pattern Recognition Applications and Methods (ICPRAM 2022), pages 505-510
ISBN: 978-989-758-549-4; ISSN: 2184-4313
Copyright
c
2022 by SCITEPRESS – Science and Technology Publications, Lda. All rights reserved
505
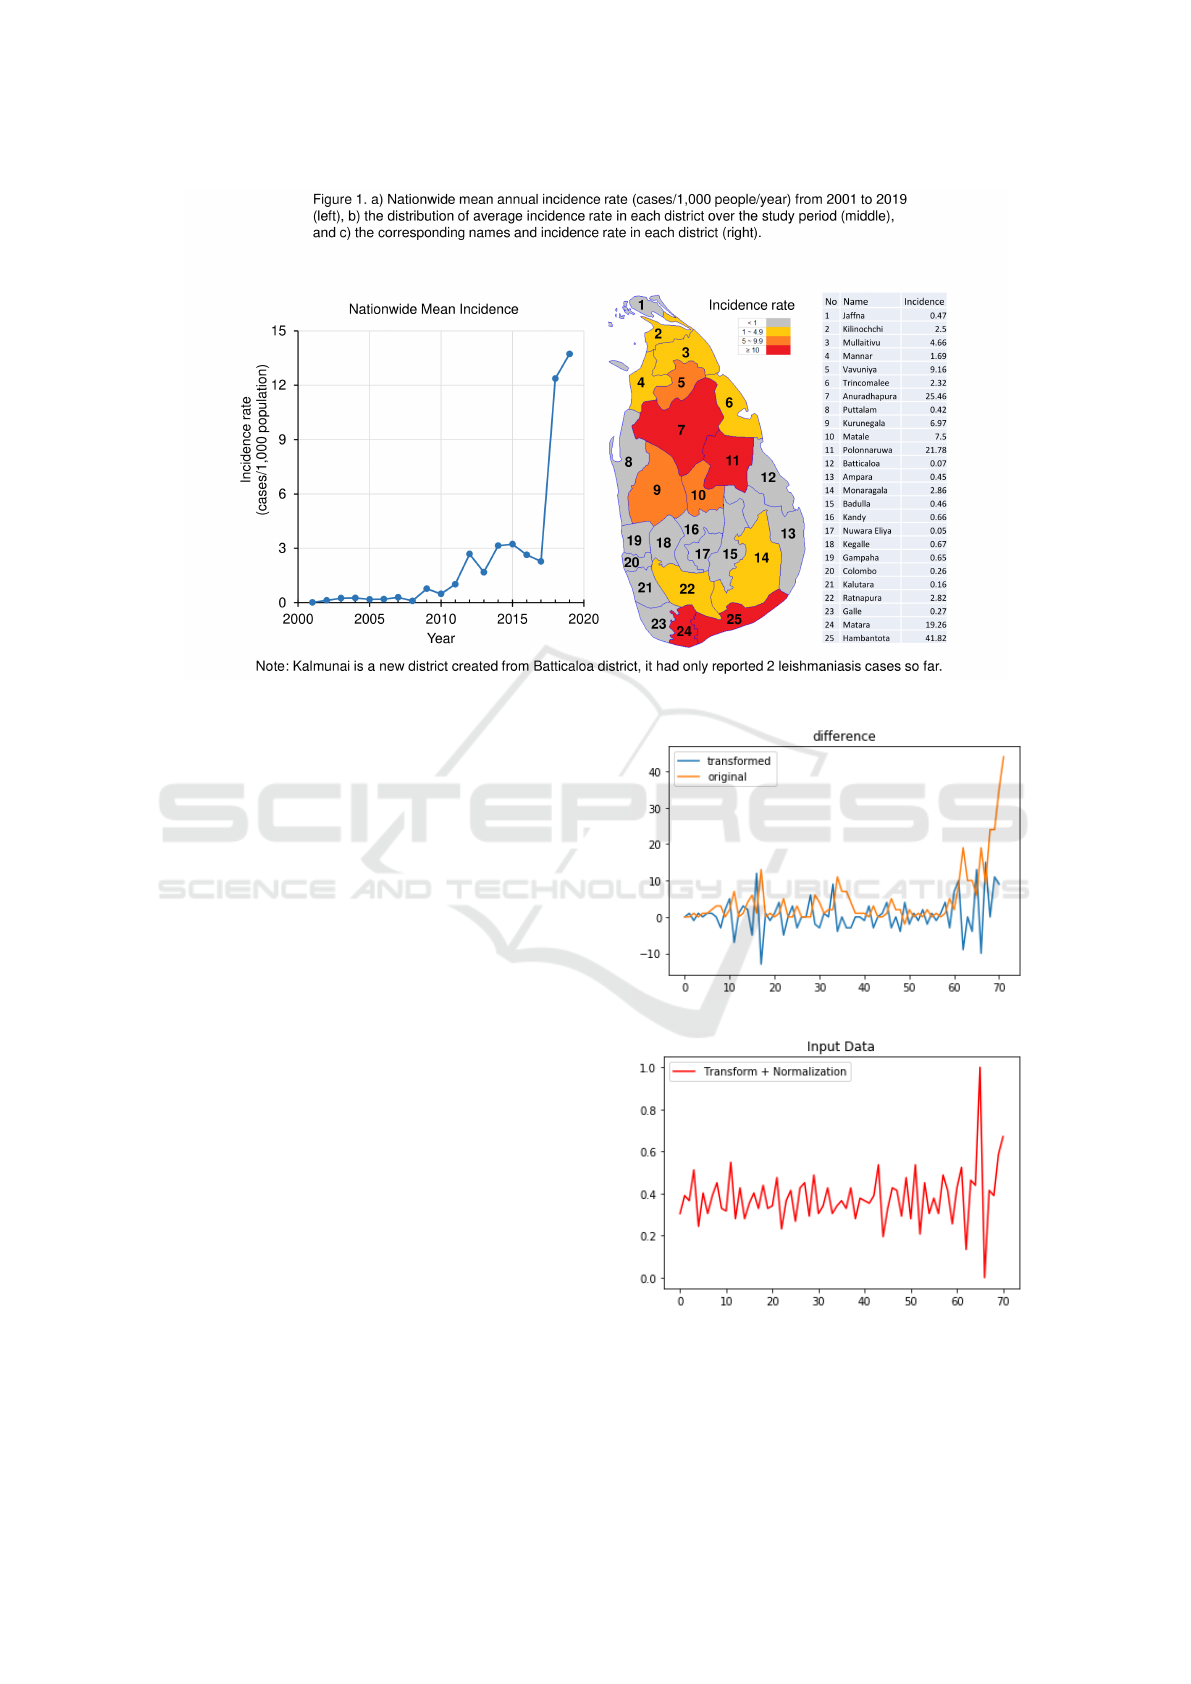
Figure 1: Sri Lanka regional map and mean incidence rate over the last two decades.
tegrated model, when applied on the difference in-
put data, out-performed ARIMA significantly in 5 Sri
Lanka regions with high infections. Moreover, adding
climate data consistently improves prediction, which
supports climate as a strong correlate to fly and para-
site mediated transmissions.
2 RELATED PRIOR WORKS
Forecasting of disease time series has gone far beyond
the traditional regression approach. External infor-
mation has been widely used in models; for example,
Yang et al. (2015) proposed Auto-Regression method
with GOogle search data (ARGO) that used google
search information as additional regressors. The
intuition of ARGO is that the amount of searches of
influenza and related key words indicate the outbreak
of influenza. Utilizing this external internet search in-
formation, ARGO outperforms auto-regressive model
and its variant ARIMA on CDC influenza data. Un-
fortunately, Google Correlate, the website where
Google provided the internet search data, has been
shut down for many years. Motivated by the infec-
tious nature of the influenza, Li et al. (2019) proposed
graph-structured recurrent neural networks (SRNN)
to learn the interaction of geographical spread of
influenza. As a result, SRNN further improves
ARGO’s accuracy on CDC data. Recently, spatio-
temporal models combining epidemic differential
(a)
(b)
Figure 2: An example of data pre-processing for region Ku-
runegala: a) raw and transformed (differenced) data; (b)
transformed (differenced) and normalized data.
ICPRAM 2022 - 11th International Conference on Pattern Recognition Applications and Methods
506
equations and RNNs Li et al. (2020); Zheng et al.
(2020) have been proposed for one to seven day ahead
forecasting of Covid-19 cases in Italy and the US.
For vector-borne diseases, due to the difficulty of
tracking fly populations and evolution, mixed linear
regression-autoregression models with near-neighbor
spatial coupling has been commonly used for predic-
tion and risk analysis Kyriakidis and Journel (1999);
Elith and Leathwick (2009).
3 OUR APPROACH
3.1 Transformation of Raw Data
Since the original leishmaniasis data is highly non-
stationary Chaves and Pascual (2006), we first trans-
form (pre-process) it to be approximately stationary.
There are several popular techniques to stationarize
data. We found that taking the first order differ-
ence along time is effective to improve the stationar-
ity of the raw data here. In Fig. 2, panel (a) shows
how the original case data of Kurunegala region is
transformed by the difference method. As is well-
known that RNN is sensitive to normalization, panel
(b) shows the normalized-transformed data that will
be fed into our model. We remark that normalization
is a stationary-invariant process.
3.2 Basic Space-time Model
In classical space-time geological and ecological sta-
tistical modeling (Kyriakidis and Journel (1999);
Elith and Leathwick (2009) among others), the cases
of neighbors are summed as a single regressor. To
learn the impact of neighbors more at depth, we
use RNN to process such information and extract
(“edge”) features as in Li et al. (2020); Zheng et al.
(2020). Let y
e,t
= (y
1
t−1
, y
2
t−1
, y
3
t−1
) be a vector of
observations from the three neighbors that have the
highest cases at t − 1. Define:
h
t
= LST M(y
e,t
)
f
t
= w
T
h
t
where LSTM is a standard long short-term memory
network Hochreiter and Schmidhuber (1997). If a re-
gion has less than three neighbors, we pad zero into
y
e
. Let I be the set of neighbors, then the model out-
put (an estimated case number for a region of interest
at time t) is:
ˆy
t
= σ
αy
t−1
+ β
∑
i∈I
y
i
t−1
+ f
t
+ b
, (1)
where σ := max(x, 0) is the rectified linear unit
(ReLu) activation function.
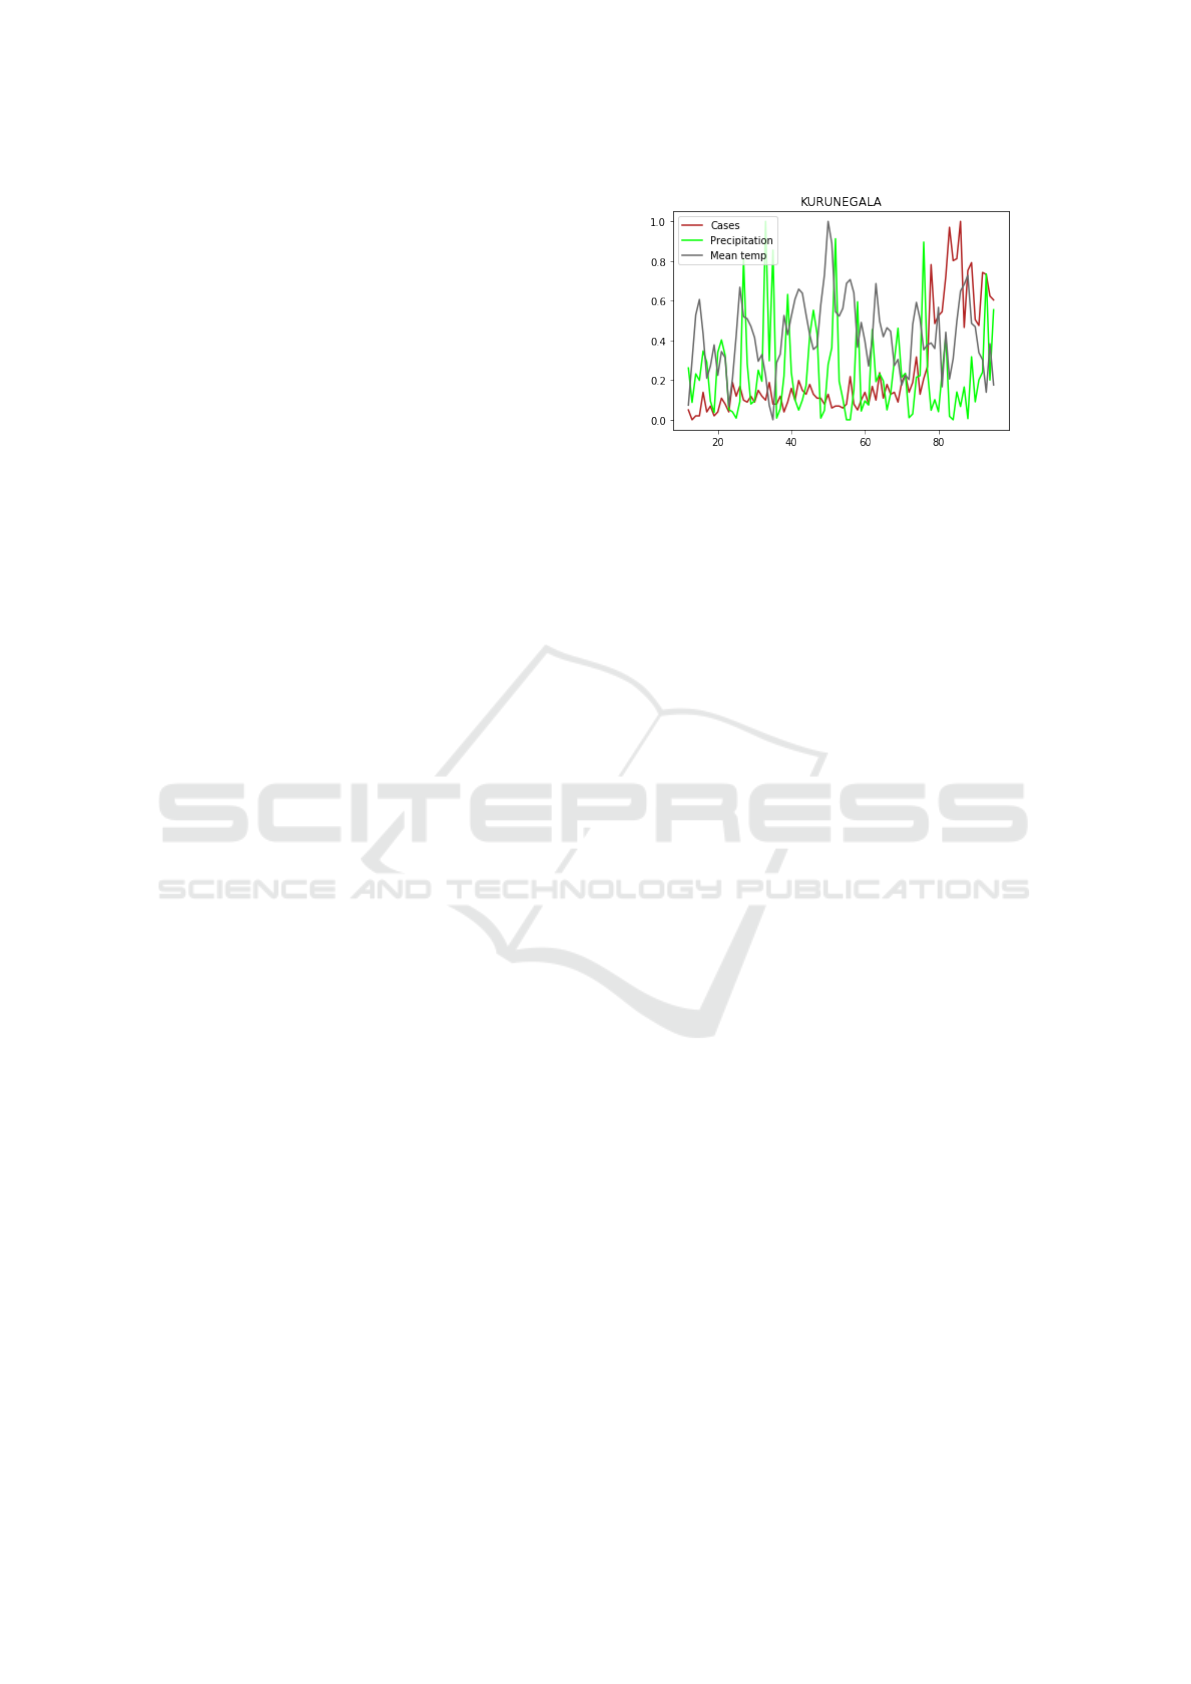
Figure 3: Normalized data of cases vs. mean temperature
and precipitation in Kurunegala region of Sri Lanka.
3.3 Integrated Model
According to previous studies (Zhou et al. (2004);
Chaves and Pascual (2006) among others), leishma-
niasis outbreak is highly correlated to climate condi-
tions such as temperature, rainfalls and seasonality,
see Fig. 3 and Fig. 5 for illustrations. Hence, we
adopt climate data as an external feature to further
improve our model performance. The climate data,
denoted as v
t
∈ R
4
being part of our model input,
contains the maximum temperature, minimum tem-
perature, mean temperature, and precipitation during
month t. Unfortunately, RNN is not good at directly
learning the impact of external feature v
t
based on
our experiments. The temperature effect turns out
to be highly non-linear. Hence, we set out to learn
the order-2 interactions of the climate features. The
complete order-2 interactions of n features involve
n
2
+ n additional features, which are expensive to
compute and can easily lead to over-fitting. Similar
problem arises in capturing high-order interactions of
user-item features in recommendation systems where
the so-called cross layer method Wang et al. (2017)
is proposed through Hadamard product and a weight
matrix and the interaction is encoded into a vector of
length n. As in Wang et al. (2017), we compute the
order 2 interaction of climate features as follows:
(W v) v =
w
11
v
2
1
+ w
12
v
1
v
2
+ w
13
v
1
v
3
+ w
14
v
1
v
4
w
21
v
1
v
2
+ w
22
v
2
2
+ w
23
v
1
v
3
+ w
24
v
2
v
4
w
31
v
1
v
3
+ w
32
v
2
v
3
+ w
33
v
2
3
+ w
34
v
3
v
4
w
41
v
1
v
4
+ w
42
v
2
v
4
+ w
43
v
3
v
4
+ w
44
v
2
4
Once the order interaction of climate features has
been encoded in (W v v), we use a dense layer to
map the interaction of climate data into the final pre-
diction:
ψ(v) = ˜w
T
[(W v v)].
In addition to external features, capturing season-
ality has drawn much attention in recent literature
An Integrated Recurrent Neural Network and Regression Model with Spatial and Climatic Couplings for Vector-borne Disease Dynamics
507
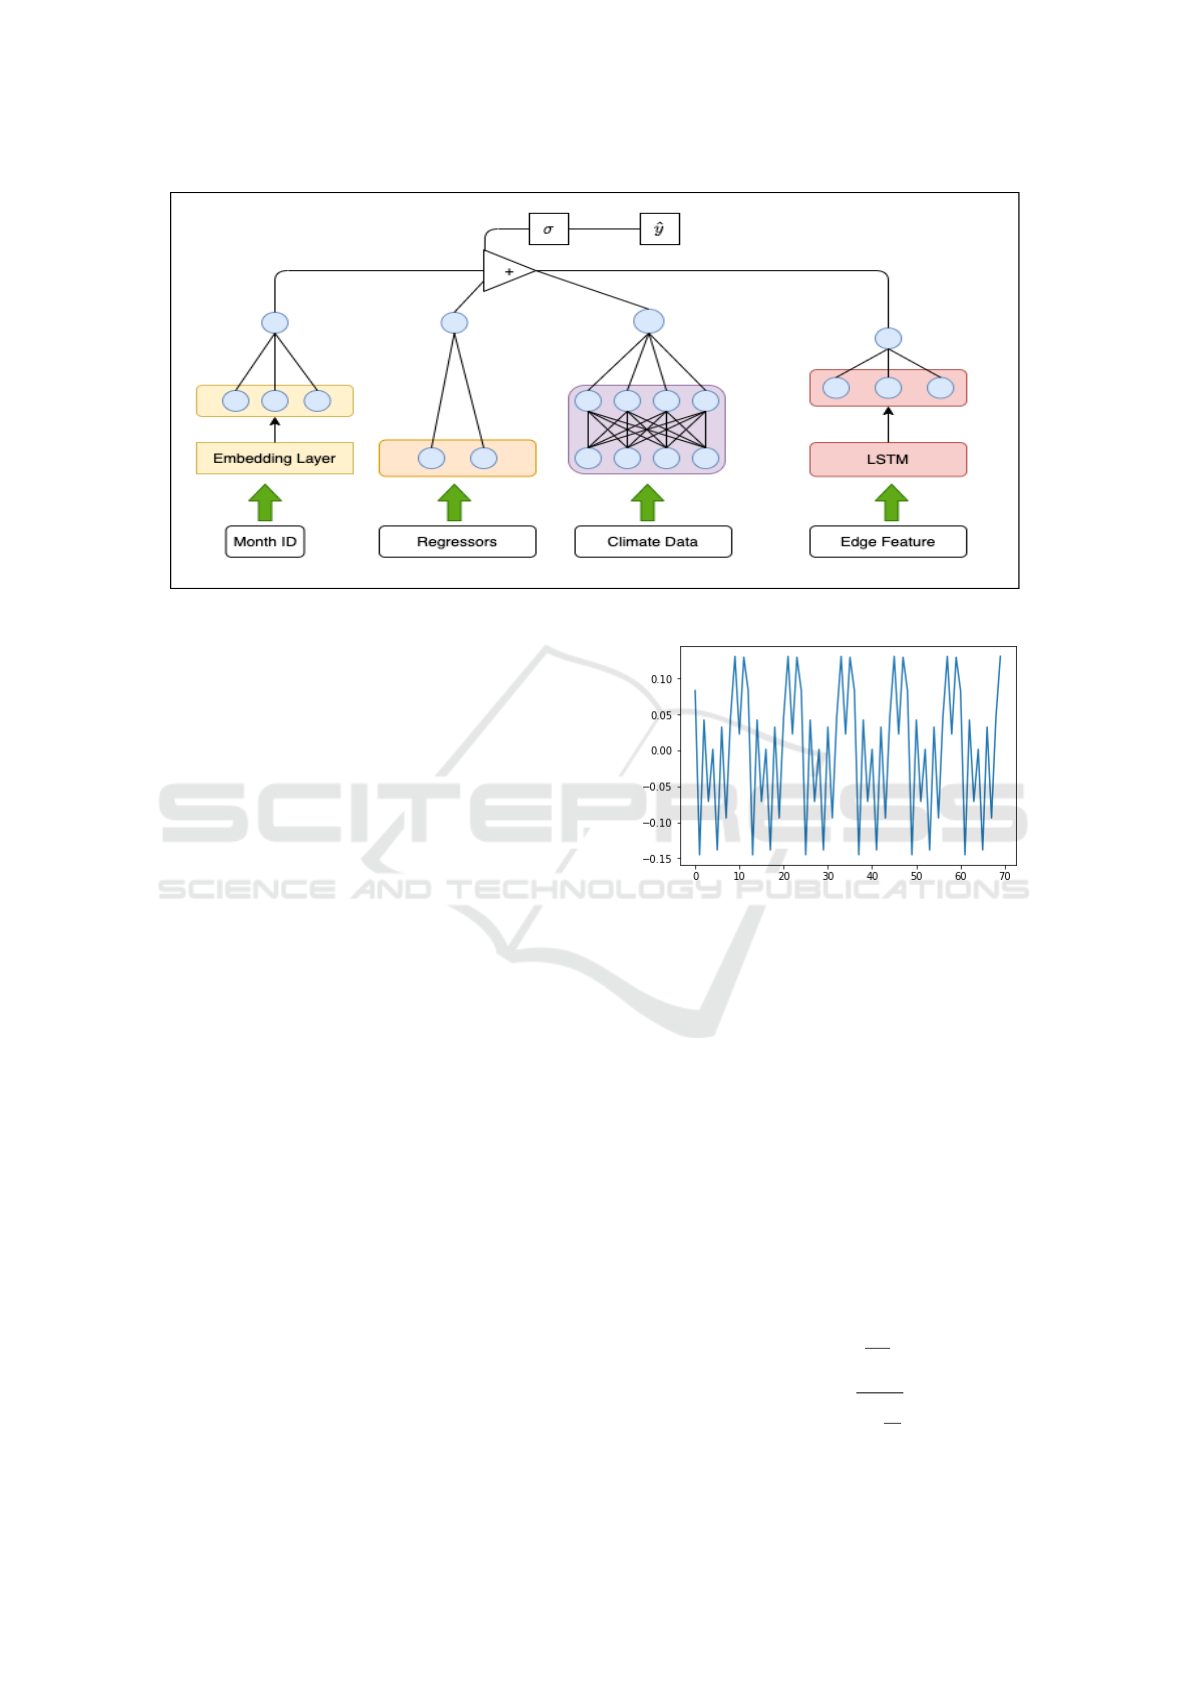
Figure 4: Illustration of our model architecture (viz. equation (2)).
Taylor and Letham (2018); Zhou et al. (2004) of time-
series forecasting. A classical analytical approach is
to use partial sums of Fourier series to represent sea-
sonality. However, the performance relies on fine tun-
ing a non-trainable integer parameter (the number of
terms). Instead, in view of the personalization tech-
nique of recommendation system He et al. (2017), we
employ an embedding layer to map the month ID, 0 to
11, to a higher dimension to learn seasonality of the
data. Then, we use a dense layer to map it into the
output:
g(t) = ˆw
T
(embed(t)).
Integrated with the climate features and seasonality,
our model is formulated as:
ˆy
t
= σ
αy
t−1
+ β
∑
i∈I
y
i
t−1
+ f
t
+ g(t) + ψ(v
t
) + b
.
(2)
The architecture of our model is illustrated in Fig. 6.
As shown in equation (2), the final prediction model
is written as the sum of all learned information fol-
lowed by ReLu activation function. The training loss
function is
L (Θ) =
N
∑
t=1
( ˆy
t
− y
t
)
2
which is minimized by an adaptive Adam optimizer
to arrive at an optimal value Θ
∗
.
4 EXPERIMENTAL RESULTS
Our clinically confirmed leishmaniasis case data
came from from the national diagnostic and research
laboratory at the University of Colombo, Sri Lanka;
the epidemiology unit of the Sri Lanka Ministry
Figure 5: Seasonality component g(t) of Polonnaruwa.
of Health and through communication with medical
health officers. The climatic data came from meteo-
rological stations in Sri Lanka in the format of max-
imum/minimum/mean temperature and precipitation.
We use 51 months (2013-03 to 2017-08) for training
and 18 months (2017-09 to 2018-12) for testing, with
ARIMA as our baseline model. We set the standard
parameters of ARIMA as (p, q, d) = (2, 1, 1) after op-
timizing. Note that with d = 1, ARIME also applied
difference transform to the original data. Meanwhile,
we compare the performance of our base model equa-
tion (1) and the integrated model equation (2). The
results are shown in Table 1 and Table 2. We evaluate
the models using both MAE and RMSE metrics. Let
e = {e
i
|e
i
= | ˆy
t
− y
t
|, i ≤ n}, where n is the number of
data points in testing set. Then,
MAE =
n
∑
i=1
|e
i
|
n
RMSE =
s
n
∑
i=1
e
2
i
n
ICPRAM 2022 - 11th International Conference on Pattern Recognition Applications and Methods
508
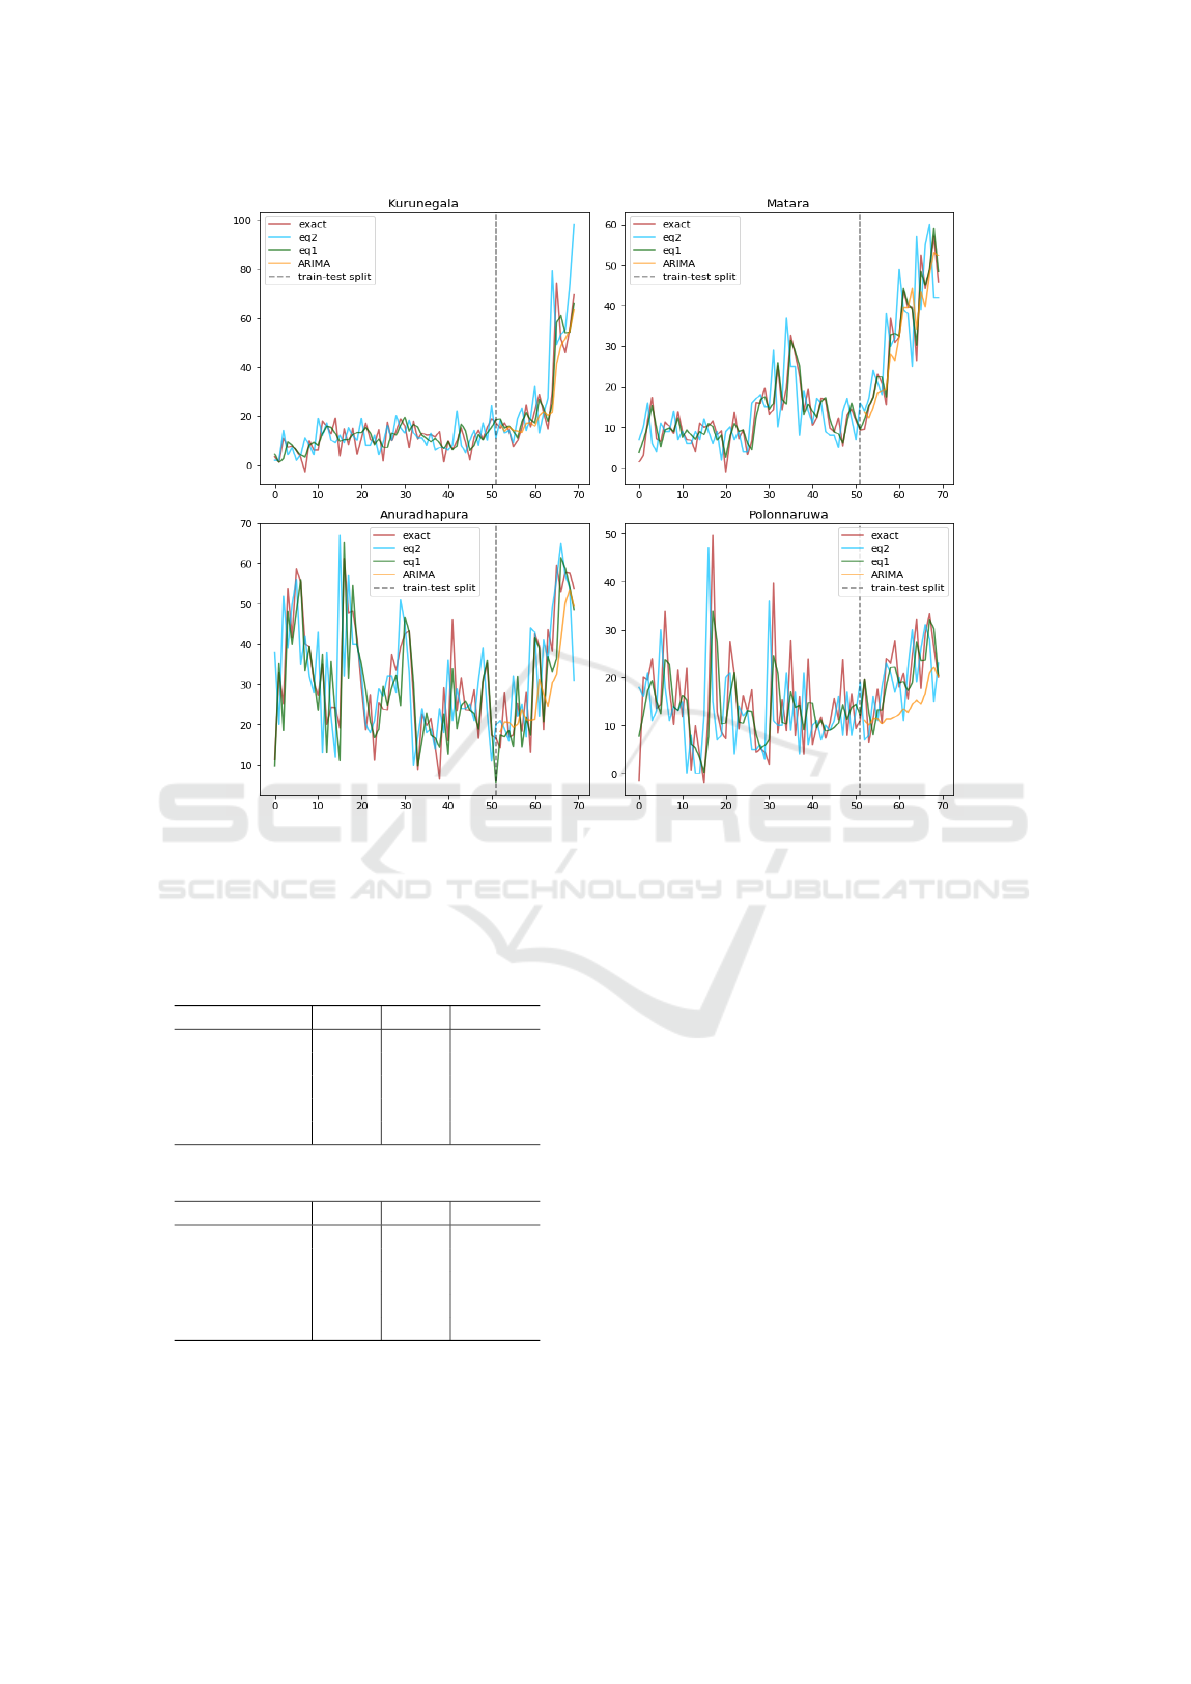
Figure 6: Training and prediction (separated by dashed line) of models (1) and (2) vs. ARIMA in 4 regions of Sri Lanka.
We note that RMSE ≥ MAE, and it can be shown that
RMSE−MAE = Var(e). We observe that equation (1)
outperforms ARIMA model in both MAE and RMSE
prediction errors.
Table 1: RMSE prediction errors of different models.
Region (1) (2) ARIMA
Matara 11.38 11.36 11.92
Anuradhapura 14.70 12.81 14.70
Polonnaruwa 8.65 8.04 8.65
Kurunegala 14.70 10.08 10.35
Hambantota 32.76 32.12 34.63
Table 2: MAE errors of different models.
Region (1) (2) ARIMA
Matara 9.33 8.62 9.54
Anuradhapura 10.25 9.88 12.2
Polonnaruwa 7.20 6.08 7.57
Kurunegala 17.50 16.80 17.50
Hambantota 41.28 39.77 41.28
Equation (2) performs the best among the three
models. Hence, the edge features in cases of
neighboring regions helped model (1) to outperform
ARIMA, which is only based on historical observa-
tions of the region of interest. The external climate
(see Fig. 5 for a seasonality illustration) information
helps model (2) to further improve prediction.
5 CONCLUSION
In this study, we integrated components of geograph-
ical spatial information, temperature, and seasonality
to build a spatio-temporal network model for predict-
ing vector-borne disease cases. We employ the cross
layer from recommendation system to compute the
order-2 interaction of climate data, and utilize embed-
ding layer to map month ID to higher dimensions to
learn seasonality. The model is successfully trained
on leishmaniasis data of several regions in Sri Lanka
with high infections (see Fig. 6).
In future work, we plan to study other vector-
borne disease data with our model (2), and also gen-
eralize RNN to an efficient transformer model to ex-
plore additional non-local temporal information for
improving prediction.
As suggested in Fig. 3, the effects of climatic data
may have a latent period to induce vector growth and
subsequent case upswing. In future work, we plan
An Integrated Recurrent Neural Network and Regression Model with Spatial and Climatic Couplings for Vector-borne Disease Dynamics
509

to introduce a time delay in the climate term of our
model and learn it from the data for another improve-
ment.
ACKNOWLEDGEMENTS
This work was partially supported by NSF grants
DMS-1924548 and DMS-1952644.
REFERENCES
L. Chaves and M. Pascual. Climate cycles and forecasts
of Cutaneous Leishmaniasis, a nonstationary vector-
borne disease. PLoS Med. 3(8):e295, 2006.
J. Elith and J. Leathwick. Species distribution models: eco-
logical explanation and prediction across space and
time. Ann. Rev. Ecol. Evol. Syst., 40:677–97, 2009.
X. He, L. Liao, H. Zhang, L. Nie, X. Hu, and T.-S. Chua.
Neural collaborative filtering. In Proceedings of the
26th International Conference on World Wide Web,
pages 173–182, 2017.
S. Hochreiter and J. Schmidhuber. Long short-term mem-
ory. Neural computation, 9(8):1735–1780, 1997.
N. Karunaweera, S. Ginige, S. Senanayake, H. Silva,
N. Manamperi, N. Samaranayake, and et al. Spa-
tial epidemiologic trends and hotspots of Leishmania-
sis in Sri Lanka (2001-2018). Emerg. Infect. Disease
26(1):1–10, 2018.
P. Kyriakidis and A. Journel. Geostatistical space–time
models: a review. Math Geol., 31:651–84, 1999.
Z. Li, X. Luo, B. Wang, A. L. Bertozzi, and J. Xin. A
study on graph-structured recurrent neural networks
and sparsification with application to epidemic fore-
casting. In World Congress on Global Optimization,
pages 730–739. Springer, 2019.
Z. Li, Y. Zheng, J. Xin, and G. Zhou. A recurrent neu-
ral network and differential equation based spatiotem-
poral infectious disease model with application to
Covid-19. Proceedings of KDIR 2020; arXiv preprint
arXiv:2007.10929, 2020.
H. Siriwardana, N. Thalagala, and N. Karunaweera. Clin-
ical and epidemiological studies on the cutaneous
leishmaniasis caused by Leishmania Donovani in Sri
Lanka. Ann. Trop. Med. Parasitol. 104(3):213–223,
2010.
S. J. Taylor and B. Letham. Forecasting at scale. The Amer-
ican Statistician, 72(1):37–45, 2018.
R. Wang, B. Fu, G. Fu, and M. Wang. Deep & cross net-
work for ad click predictions. In Proceedings of the
ADKDD’17, pages 1–7. 2017.
S. Yang, M. Santillana, and S. C. Kou. Accurate estima-
tion of influenza epidemics using google search data
via argo. Proceedings of the National Academy of Sci-
ences, 112(47):14473–14478, 2015.
Y. Zheng, Z. Li, J. Xin, and G. Zhou. A spatial-temporal
graph based hybrid infectious disease model with ap-
plication to COVID-19. Proceedings of ICPRAM
2021; arXiv preprint arXiv:2010.09077, 2020.
G. Zhou, N. Minakawa, A. K. Githeko, and G. Yan. As-
sociation between climate variability and malaria epi-
demics in the east African highlands. Proceedings
of the National Academy of Sciences, 101(8):2375–
2380, 2004.
ICPRAM 2022 - 11th International Conference on Pattern Recognition Applications and Methods
510
