
Leveraging Causal Relations to Provide Counterfactual Explanations
and Feasible Recommendations to End Users
Riccardo Crupi
1
, Beatriz San Miguel Gonz
´
alez
2
, Alessandro Castelnovo
1
and Daniele Regoli
1 a
1
Intesa Sanpaolo S.p.A., Turin, Italy
2
Fujitsu Research of Europe, Madrid, Spain
Keywords:
Explainable Artificial Intelligence, Counterfactual Explanations, Causality, Recourse.
Abstract:
Over the last years, there has been a growing debate on the ethical issues of Artificial Intelligence (AI).
Explainable Artificial Intelligence (XAI) has appeared as a key element to enhance trust of AI systems from
both technological and human-understandable perspectives. In this sense, counterfactual explanations are
becoming a de facto solution for end users to assist them in acting to achieve a desired outcome. In this paper,
we present a new method called Counterfactual Explanations as Interventions in Latent Space (CEILS) to
generate explanations focused on the production of feasible user actions. The main features of CEILS are: it
takes into account the underlying causal relations by design, and can be set on top of an arbitrary counterfactual
explanation generator. We demonstrate how CEILS succeeds through its evaluation on a real dataset of the
financial domain.
1 INTRODUCTION
Note-worthy governmental initiatives, such as the
General Data Protection Regulation (GDPR) (The
European Union, 2016) and Ethics guidelines for
trustworthy Artificial Intelligence (AI) (High-Level
Expert Group on AI, 2019) in Europe, and the De-
fence Advanced Research Projects Agency’s Explain-
able Artificial Intelligence (XAI) program of the
United States (Gunning and Aha, 2019), endeavour
to promote the creation of trustworthy AI systems
based on human oversight, prevention of harm, trans-
parency, interpretability, accountability, etc. In this
sense, the XAI field has appeared as a crucial set of
technologies to improve and ensure trustworthiness of
AI systems.
XAI addresses different purposes sought by the
stakeholders of AI systems (Arrieta et al., 2020). XAI
can provide reasons and justifications for the whole
logic of an AI model or a specific outcome, consid-
ering both technical and non-technical forms. For ex-
ample, AI developers can take advantage of explana-
tions to verify that AI outcomes are not erroneous,
biased or insecure; to ensure the efficiency and func-
tionality; and to get new insights to improve the sys-
tem. Moreover, non-technical profiles (i.e. regula-
a
https://orcid.org/0000-0003-2711-8343
tors, domain experts, executives and end users) can
receive explanations to assess and certify regulatory
compliance, gain business knowledge and get insights
to their specific situation in a human-understandable
way.
In this paper, we present CEILS
1
: Counterfac-
tual Explanations as Interventions in Latent Space,
a new method to generate counterfactual explana-
tions and recommendations. Counterfactual explana-
tions (Wachter et al., 2017) are a set of statements to
communicate to end users what should change in their
features in order to receive a desired result. These are
gaining large acceptance in technical, legal, and busi-
ness contexts (Barocas et al., 2020). Their advantages
include: help end users whose life is impacted by au-
tomatic decisions to interact with AI systems, do not
disclose technical details of the models, thus protect
trade secrets and commercial interests and is appro-
priate to legal frameworks.
While there are significant efforts to generate
counterfactual explanations (Verma et al., 2020;
Stepin et al., 2021), they generally fall short of gener-
ating feasible actions that end users should carry out
in practice. CEILS, on the other hand, is designed
to leverage the underlying causal relations to generate
1
CEILS code is publicly available at the repository
https://github.com/FLE-ISP/CEILS
24
Crupi, R., San Miguel González, B., Castelnovo, A. and Regoli, D.
Leveraging Causal Relations to Provide Counterfactual Explanations and Feasible Recommendations to End Users.
DOI: 10.5220/0010761500003116
In Proceedings of the 14th International Conference on Agents and Artificial Intelligence (ICAART 2022) - Volume 2, pages 24-32
ISBN: 978-989-758-547-0; ISSN: 2184-433X
Copyright
c
2022 by SCITEPRESS – Science and Technology Publications, Lda. All rights reserved

feasible recommendations to end users on how to act
to reach a desired outcome. Moreover, CEILS does
that by building on top of an arbitrary counterfactual
generator, thus avoiding the need of dealing with an
ad hoc optimization problem.
It is important to point out that counterfactual ex-
planations and counterfactuals in the causal inference
field are separated concepts. Generally speaking,
counterfactual explanations do not account for any
causal relationship among data, and these are not to
be confused with counterfactuals in the causal infer-
ence setting (i.e. instances answering to questions of
the form “what would have happened if. . . ”) (Pearl
et al., 2000). However, CEILS, by explicitly consider-
ing the underlying causal structure, provides a bridge
between these two otherwise unrelated concepts (see
Section 3.1.4 for more details).
The main contributions of this work are:
• to provide a novel and straightforward way to ac-
count for causality in generating counterfactual
explanations of AI models,
• to provide counterfactuals explanations along
with (causally) feasible actions to reach them.
The structure of this paper is the following. First,
Section 2 summarizes prior work for the generation
of counterfactual explanations. Then, Section 3 de-
tails the CEILS proposal and Section 4 describes its
evaluation in a real dataset of the financial domain.
Finally, Section 5 concludes the paper and outlines
future work.
2 RELATED WORK
Most of the prior approaches for the generation of
counterfactual explanations relies on establishing an
optimization problem, usually to find the nearest
counterfactual with respect to the input to be ex-
plained. This has been understood in different ways:
minimizing the distance among the explanation and
the original instance (proximity) (Wachter et al., 2017)
or the training data (data manifold closeness) (Joshi
et al., 2019), keeping a low number of feature changes
(sparsity) (White and Garcez, 2019), adhering to ob-
served correlations or generating a set of diverse ex-
planations (Mothilal et al., 2020).
Moreover, other works incorporate causality to
produce explanations more grounded with reality
(Mahajan et al., 2019). In general, current solu-
tions provide a common understanding of a decision.
However they fall short of assisting end users with
feasible recommendations to act and achieve a de-
sired outcome (Karimi et al., 2020). A set of pro-
posals addresses this last issue through the definition
of a recourse problem (Ustun et al., 2019; Karimi
et al., 2020). Our work is focused on the production
of counterfactual explanations with recommendations
and actions more realistic and feasible for end users.
3 PROPOSED METHOD
Figure 1 depicts a general overview of the CEILS con-
text and its main building blocks. Like other coun-
terfactual explanation methods, CEILS offers to end
user a set of statements to indicate what should be
changed in order to achieve a desired outcome. How-
ever, CEILS produces not only explanations, but also
feasible actions.
By way of example, consider a simplified scenario
of an AI model used for loan approvals that takes into
account age, income and credit score of an end user to
decide if a loan would be accepted or rejected. When
a person is denied a loan, counterfactual explanations
indicate what input data (features) should be altered
to access to the loan. For instances, the person may
receive as counterfactual explanations: “reduce your
age”, “increase your income and credit score”, “im-
prove your credit score value”, etc. As can be de-
duced from the examples, these explanations contain
unfeasible and impractical actions (i.e. for end users,
it is impossible to reduce their age, or usually they
have no control over their credit scores values). With
our proposal, feasible actions are delivered to end
users due to the fact that causal relations are taken into
account by design, e.g. credit score is in general influ-
enced by age and income and age can only increase.
Therefore, using CEILS, a person could receive as a
recommended action ”increase your income”, which
would impact the credit score and guarantee the loan
approval.
The CEILS methodology consists of three main
steps:
1. creation of a model in a latent space (i.e. space of
unobserved variables) through a Structural Causal
Model – comprised by a Causal Graph and a set
of Structural Equations;
2. generation of counterfactual explanations with
an arbitrary generator using the aforementioned
model; and
3. translation of counterfactual explanations to the
original feature space.
It is important to note that our method requires as
inputs the historical data used to build the AI model
that will be explained and the causal graph that de-
scribes the causal relations among the features of the
Leveraging Causal Relations to Provide Counterfactual Explanations and Feasible Recommendations to End Users
25
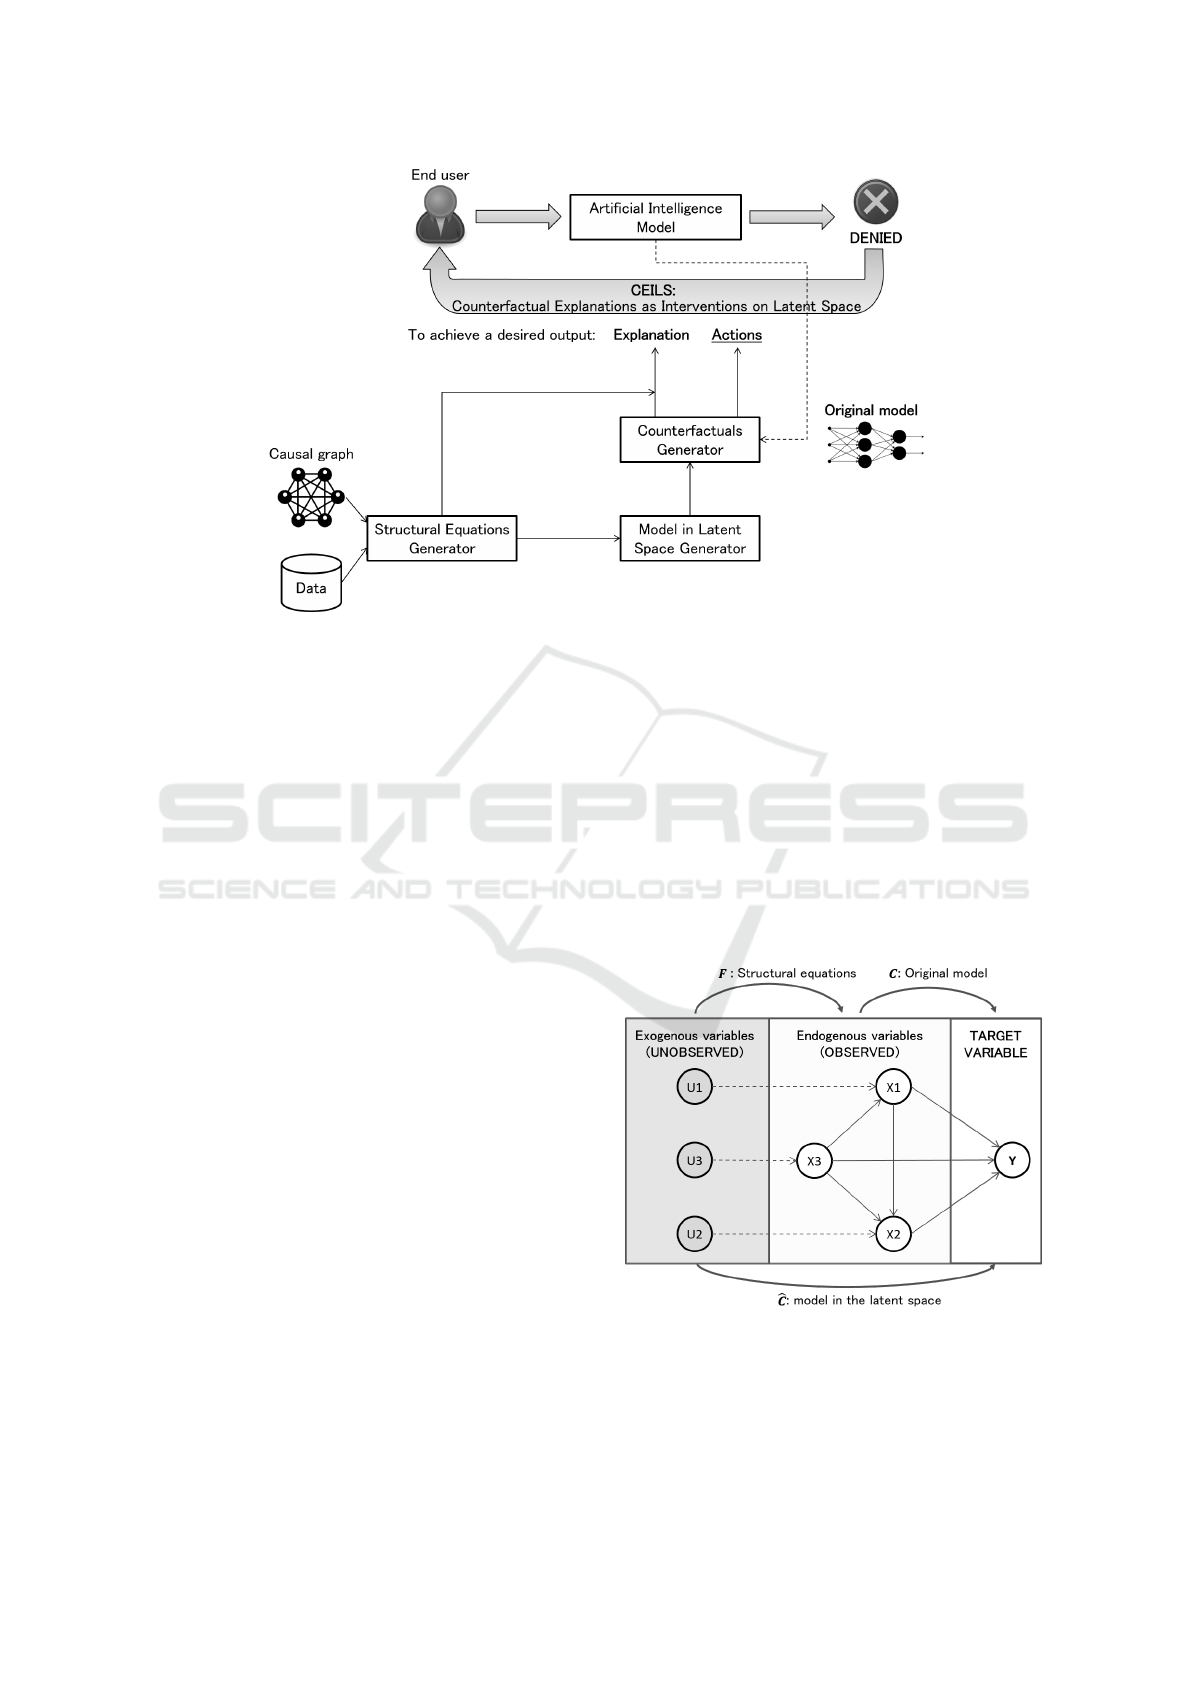
Figure 1: CEILS context and building blocks. The context in which CEILS operates is similar to other explainability methods:
a user interacting with an AI model receiving a negative outcome together with an explanation of the outcome (provided by
CEILS). Unlike other methods, CEILS provides not only explanations but also realistic actions. The main building blocks of
CEILS are shown: Data, Casual Graph, Structural Equations Generator, Model in Latent Space Generator and Counterfactuals
Generator.
dataset. Moreover, CEILS needs to have access to the
original model to generate the explanations.
On the bottom part of Figure 1 the main CEILS
building blocks are shown. Next, we detail each block
of the proposal.
3.1 CEILS: Building Blocks
3.1.1 Causal Graph
CEILS requires to access to a predefined causal graph
that encodes the causal relations among the features
of the dataset. Modeling this causal knowledge is
complex and challenging since this requires under-
standing relations beyond statistical dependencies.
Different causal discovery algorithms have been pro-
posed to identify causal relationships from observa-
tional data through automatic methods (Kalainathan
et al., 2020; Kalisch et al., 2012). In general, it is
important that domain experts validate the relations
detected by the causal discovery routine, or include
new ones when deemed necessary.
Causal relationships among features are modelled
via a Directed Acyclic Graph (DAG) G = (V, E), with
the set V of vertices (or nodes) and the set E of di-
rected edges (or links). Nodes of the graph G are
composed by:
• X = (X
1
, . . . , X
d
): endogenous variables, repre-
senting the actual (observed) variables used as
predictors in the model;
• U = (U
1
, . . . , U
d
): exogenous variables, represent-
ing (unobserved) factors not accounted for by the
features X; and
• Y represents the dependent variable to be pre-
dicted by means of X.
In Figure 2 an example of a causal graph is included,
pointing out the relations among the different kind of
nodes (X, U, Y ).
Figure 2: Example of a causal graph, indicating the different
kind of nodes (U, X, and Y ), and the functions associated
with the CEILS methodology (F, C and
ˆ
C ).
ICAART 2022 - 14th International Conference on Agents and Artificial Intelligence
26

3.1.2 Structural Equations
The Structural Causal Model encodes a more detailed
description of causal relationships. This is defined by
a triplet (X, U, F) where F represent a set of func-
tions called Structural Equations F : U → X , map-
ping the exogenous (unobserved) variables living in
the domain U to the endogenous (observed) ones
X ∋ X = F(U).
The first step of the CEILS methodology is to infer
the Structural Equation from observations (X), given
the DAG. It does so by assuming an Additive Noise
Model (see, e.g., (Peters et al., 2014)):
X
j
= f
j
(pa(X
j
)) +U
j
, ∀ j = 1. . . d. (1)
where pa(X
j
) denotes the parent nodes of X
j
with
respect to the DAG. Thus, in the example of Fig-
ure 2 the variable X
2
, whose parents are the nodes
X
1
and X
3
, would be modeled by the equation: X
2
=
f
2
(X
1
, X
3
) +U
2
.
A regressor model M
j
is trained to estimate each
function f
j
, predicting a variable X
j
from its parent
nodes. A node without parents (e.g. X
3
in Figure 2)
is referred to as a root node, while residuals are an
estimate of the latent variables: namely, to calculate
the value of the latent variable U given X one would
compute:
(
ˆ
U
j
= X
j
, for all roots j,
ˆ
U
j
= X
j
− M
j
(pa(X
j
)), for all non-roots j.
(2)
Therefore, for the example of the Figure 2, the esti-
mated value of the latent variable U
3
would be equal
to X
3
since this has no parents, while for the variable
X
2
— with parents X
1
and X
3
— the estimation of the
latent variable would be
ˆ
U
2
= X
2
− M
2
(X
1
, X
3
).
Structural Equations for root nodes r simply re-
duce to F
r
(U) = U
r
. Once all models M
j
are learned
from a training dataset, it is possible to recursively
compute the actual function F connecting U to X —
namely X = F(U) — following the causal flow in the
DAG (i.e from the root nodes down to the leaves):
F
j
(U) = U
j
, for all roots j,
F
j
(U) = M
j
{
F
v
(U)
}
v∈pa(X
j
)
+U
j
, j non-root.
(3)
Thus, starting from root nodes — for which the re-
lation is trivial — one can recursively construct the
full relation F : U 7→ X. In the example of Figure 2
equation (3) would read:
X = F(U) =
U
3
M
1
(U
3
) +U
1
M
2
(M
1
(U
3
) +U
1
, U
3
) +U
2
. (4)
3.1.3 Model in the Latent Space
Once the relations X = F(U) are available, it is pos-
sible to build the model:
ˆ
C (U) = C ◦ F(U), (5)
where C is the original model that predicts the tar-
get variable Y given X, of which we need to provide
counterfactual explanations. For example, this could
be an arbitrary machine learning classifier. Therefore,
ˆ
C has domain in the (latent) space of variables U and
leverages the Structural Causal Model by means of F
in order to replicate C in estimating Y .
Figure 2 shows the relations among the functions
F, C and
ˆ
C in a toy example: the original model C
and the Structural Equations F, are composed to get
the model in the latent space
ˆ
C .
3.1.4 Counterfactuals Generator
Given the latent-space model
ˆ
C as by equation (5), an
arbitrary counterfactual explanations generator can be
employed. As we mentioned in Section 2, most ap-
proaches to generate counterfactual explanations rely
on an optimization process based on different metrics
(i.e. proximity, sparsity, etc.).
More precisely, given an instance x for which we
want to find a counterfactual explanation, CEILS pre-
scribes the following three steps:
1. compute the latent variables u corresponding to
x by means of residuals of models
M
j
d
j=1
(eq. (2));
2. run a counterfactual generator for the model
ˆ
C rel-
ative to the point u, thus obtaining u
cf
= u + δ;
3. compute x
cf
= F(u + δ).
Notice that these three points correspond precisely to
the well-known steps of counterfactual computation,
e.g. as described in chapter 4 of (Pearl et al., 2016),
namely:
1. abduction, i.e. update the unobserved variables to
account for the observed data X = x;
2. action — the crucial step — that consists in inter-
vening on variables to change the observed val-
ues;
3. prediction, i.e. use the new variables to actually
compute the counterfactual instance.
Namely, the CEILS approach — similarly to (Karimi
et al., 2020) — provides a natural bridge between the
two separate concepts of XAI counterfactual explana-
tions and causal counterfactuals in the sense of (Pearl
et al., 2016).
Leveraging Causal Relations to Provide Counterfactual Explanations and Feasible Recommendations to End Users
27

It is important to point out that the main advantage
of CEILS is that it provides not only the counterfac-
tual explanation x
cf
, but also the action δ needed to
reach it. In particular, in standard counterfactual ex-
planation methods the action is seen a shift in feature
space, but this kind of actions represent, in general,
unfeasible recommendations, since they completely
neglect the fact that a change in a feature has impacts
on others. Our method, instead, recommending ac-
tions as shift in the latent space, takes into account
the underlying causal flow. Incidentally, notice that
the latent space action δ is an example of soft inter-
vention (Eberhardt and Scheines, 2007) in that it is
performed on top of other changes in the variable due
to changes in its parents.
4 EVALUATION
We demonstrate the advantages of CEILS on a real
dataset of the financial domain. The evaluation of the
results is based on a set of known metrics and new
ones that we propose to capture the particularities of
CEILS.
4.1 Dataset and Causal Graph
We use a proprietary dataset of past loan applica-
tions (Castelnovo et al., 2020). This dataset com-
prises 220,304 applications and 8 features (namely
gender, age, citizenship, monthly income, bank se-
niority, requested amount, number of installments and
rating) to determine whether the loan application is
accepted or rejected. The features are related accord-
ing to the causal graph (Figure 3) that we obtain us-
ing different causal discovery algorithms. In particu-
lar, we employed the Python Causal Discovery Tool-
Box (Kalainathan and Goudet, 2019), including dif-
ferent graph modelling algorithms on observational
data (i.e. SAM, PC) and the NOTEARS algorithm
(Zheng et al., 2018) included in the Python library
CausalNex. Additionally, a manual revision has been
performed by a group of domain experts to validate
each causal relation detected or to include new ones.
Among the features, rating indicates the credit-
worthiness of an applicant, i.e. an estimation of
the probability that a customer will repay loans in a
timely manner. Usually, end users cannot directly in-
tervene on this feature, being it a complicated func-
tion of other variables. Thus, we set up our experi-
ment constraining rating in such a way that no direct
intervention is made on it. Namely, rating is consid-
ered a feature non-actionable but that can vary due to
changes in other variable. Gender and citizenship, on
Figure 3: Causal graph related to the proprietary loan appli-
cations dataset.
the other hand, are constrained to be immutable fea-
tures (they cannot change in any way), meanwhile age
and bank seniority can only increase.
4.2 Experiments Setup
First, we build the original AI model, which would be
explained, using the 8 features of the dataset to predict
the target variable that indicates if a loan application
will be accepted or rejected. This model is established
through a feed-forward neural network with 2 hidden
layers with ReLU activation functions.
On the other hand, the Structural Causal Model
relies on the DAG represented in Figure 3. Addition-
ally, Structural Equations are calculated to map un-
observed variables to the 8 observed variables using
feed-forward neural networks with 2 hidden layers.
Similarly, the model in the latent space is based on
a feed-forward neural network with 2 hidden layers
with ReLU activation functions.
The popular open source Machine Learning li-
brary, TensorFlow, is used for setting up and training
the neural networks.
We rely on counterfactual explanations guided by
prototypes proposed by (Van Looveren and Klaise,
2019) included in the open source library Al-
ibi (Klaise et al., 2019) as our baseline generator
of counterfactuals explanations. In particular, this
is used as counterfactuals generator for the CEILS
method (check Figure 1 and Section 3.1.4 for more
details) and on the other hand, to generate counter-
factuals explanations that will be compared with the
explanations generated by CEILS.
Therefore, we compute the corresponding coun-
terfactual explanations first using the baseline ap-
proach (Van Looveren and Klaise, 2019) and then
overlaying our proposed CEILS method. 1,000 ran-
ICAART 2022 - 14th International Conference on Agents and Artificial Intelligence
28

Table 1: Comparison results of the baseline approach and
the CEILS method based on 8 metrics.
baseline CEILS
validity 22% 82%
continuous proximity 289.57 ± 830.79 43.23 ± 109.46
categorical proximity 0.0 ± 0.0 0.09 ± 0.15
sparsity 2.86 ± 0.95 2.83 ± 1.17
sparsity action - 2.28 ± 1.04
distance 2.16 ± 1.1 1.72 ± 0.87
cost 2.51 ± 1.24 1.35 ± 0.81
feasibility 0.064 1.0
dom instances of the dataset are used as factual obser-
vations to be explained.
As mentioned above, gender and citizenship are
treated as immutable features while rating can vary
only as a consequence of changes in other variables
and cannot be directly acted upon. To implement
this, in CEILS we simply keep the corresponding la-
tent variables fixed (gender and citizenship are root
nodes, thus fixing their latent counterpart is equiva-
lent to constrain them to be immutable), while in the
baseline approach we directly fix the variables in the
X space. This means that, for the baseline approach,
rating is effectively immutable, while in CEILS it is
non-actionable but mutable.
The two sets of explanations are evaluated based
on state-of-the-art metrics, such as validity, proxim-
ity and sparsity (refer to (Mothilal et al., 2020) for
more details). Moreover, we define three new met-
rics (i.e. distance, cost, and feasibility) to capture the
particularities of our approach. Next, we explain the
meaning of each metrics with the report of the results.
4.3 Results
Table 1 summarizes the results obtained for both
methods (baseline and CEILS) with respect to the
different metrics: validity, proximity (for continuous
and categorical features), sparsity (including the ac-
tion provided by CEILS), distance, cost and feasibil-
ity.
First, validity refers to the fraction of generated
explanations that are valid counterfactuals, i.e. that
are given a different outcome y with respect to the
factual instance. Here, we can observe the first big
difference among the two approaches: only 22% of
instances have an associated counterfactual explana-
tion with the baseline approach, while 82% of expla-
nations are found with the CEILS method.
Intuitively the aforementioned difference in the
validity is explained by the rating feature, which is
crucial to estimate the granting of loans and we con-
figure it to be non directly actionable, since end users
cannot control it. This explains why the baseline
method falls short in providing valid counterfactual
explanations: this approach has no way of changing
the rating, thus for it is either impossible to find actual
counterfactual explanations or they are too far to be
considered valid. On the other hand, CEILS is much
more efficient in providing valid explanations, since it
can indirectly act on rating by changing variables that
causally impact it (i.e. seniority or income). More-
over, CEILS provides to end users the action to be per-
formed on these variables that are needed to change
the rating appropriately.
To clarify the differences among the methods,
consider the example included in Table 2, where
an application has been rejected and the counterfac-
tual explanation indicates how to act to have it ap-
proved (decision = 0 → decision = 1). As expected,
immutable features (i.e. gender and citizenship) do
not vary their values, while age and bank seniority
show equal or higher values with respect to the orig-
inal instance. However, the baseline method pro-
duces a counterfactual explanation with values far
away from the factual profile (i.e. increase the income
to 3643.3K and almost double the amount requested
with less number of installments). On the other hand,
if we focus on the action recommended by CEILS,
this only suggests to increase the bank seniority and
the requested amount
2
. Increasing the bank senior-
ity (action seniority = 5.4) results in a better rating
(∆CEILS rating = -0.375), thus, ultimately, in loan
approval. Evidently, an increase in the seniority is
impossible without a corresponding increase in age:
actually, we have treated bank seniority as an action-
able feature, but it would have been more appropriate
to consider it as mutable only as a consequence of
age changes, since seniority cannot be controlled in-
dependently of age. Nevertheless, we have decided to
keep seniority actionable to focus our discussion on
rating and not to limit too much the baseline method
(for which it would have been impossible to change
seniority as well as rating).
Regarding the rest of metrics in Table 1, it is im-
portant to note that they are computed over the ex-
planations common to both methods (22% according
to the validity), i.e. on observations to which both
CEILS and the baseline were able to provide a valid
explanation. In particular, results included in the table
correspond to the mean and standard deviation of the
metrics over all valid explanations.
2
Both methods apparently provide the counter-intuitive
suggestion of increasing the requested amount: this is due to
the fact that the baseline method searches for explanations
as close as possible to the data distribution. In other words,
a too small requested amount is not plausible with respect
to the other suggested features.
Leveraging Causal Relations to Provide Counterfactual Explanations and Feasible Recommendations to End Users
29

Table 2: Example of an instance, counterfactual explana-
tions obtained by the baseline approach and CEILS method,
differences among the original instance and the counterfac-
tual explanations for both methods, and action provided by
CEILS method.
counterfactuals CEILS
variable instance baseline CEILS ∆baseline ∆CEILS action
decision 0 1 1
gender 1 1 1 0 0 0
age 30 30 30 0 0 0
citizenship 1 1 1 0 0 0
income 56.7K 3700K 56.7K 3643.3K 0 0
seniority 0 8.1 5.4 8.1 5.4 5.4
amount 210K 409K 320K 199K 110K 110K
installments 48 33.4 53.1 -14.6 5.1 0
rating 10 10 9.625 0 -0.375 0
Thus, proximity refers to the distance between
the original instance and the counterfactual explana-
tion. We distinguish among proximity for continu-
ous and categorical features. For continuous features,
we measure proximity as feature-wise L
1
distance re-
scaled by the Median Absolute Deviation from the
median (MAD). For categorical features, we consider
a distance of 1 if there is values mismatch. The
results show better values of proximity taking into
account continuous features for the CEILS method.
This means that the explanations obtained are closer
to the original input of the end user, which is a desir-
able propriety. Regarding the proximity for categor-
ical features, there is no major difference among the
methods.
Moreover, we measure the sparsity of the expla-
nations obtained as the number of features that need
to change with respect to the original input
3
. In the
feature space the difference among the methods is not
remarkable, but notice that in terms of recommended
actions (“sparsity action” in Table 1) CEILS is able to
slightly improve this metric as well.
4
Closely related to the proximity metric, the dis-
tance measure the L
1
distance between counterfac-
tual explanation and the original instance
5
. Again,
the CEILS method obtains better values (1.72) with
respect to the baseline method (2.16).
Finally, we propose to measure cost and feasibil-
ity: these 2 metrics are designed to compare CEILS
actions with the actions that the baseline approach
would have recommended considering the Structural
3
For continuous feature a tolerance threshold is consid-
ered similarly to (Mothilal et al., 2020).
4
Notice that for non-causal counterfactual explanations
actions actually boil down to the simple difference in feature
space, thus sparsity and sparsity action coincide. Another
way to compute actions for non-causal explanations could
be what we call ex-post actions, mentioned below in the
text.
5
Notice that this metric is computed over standardized
feature values.
Causal Model ex post, i.e. the actions — given the
SCM — that one should perform in order to reach the
baseline explanations.
On the one hand, cost is defined as the L
1
norm of
the action that has to be done in order to reach a coun-
terfactual explanation
6
. In the evaluation, a lower
value of cost is obtained with the CEILS method
since the causal influence reduces the effort in order
to reach an explanation.
On the other hand, the feasibility metric shows
the percentage of actions that are compatible with the
feasibility constraints over features, e.g. if the vari-
able bank seniority can only increase, the action over
bank seniority must be a positive value for the corre-
sponding explanation to be feasible. We observe that
the CEILS method perfectly preserves the underlying
causality as expected (a value of 1.0), while the re-
constructed actions of the baseline spoil almost com-
pletely the actionability of the features (0.064) (e.g.
to keep the rating fixed while changing income, the
baseline should actually recommend a non-null action
on rating, which is unfeasible).
5 CONCLUSIONS AND FUTURE
WORK
In this paper, we present the CEILS methodology
for generating counterfactual explanations focused on
providing feasible actions to end users who want to
achieve a desired outcome. The main novelty, which
is reached via the Structural Causal Model and by
building a model in the latent space, lies in the pos-
sibility of embedding it in any existing counterfactual
generator, effectively producing realistic recommen-
dations.
Indeed, because of variable interdependence,
static counterfactual explanations generators (in the
sense of non-causal) fail, in general, to provide feasi-
ble actions, recommending a set of interventions that
may be either impossible to perform or sub-optimal
in reaching a desired result, as outlined in Section 4
(check the example included in Table 2). On the other
hand, CEILS leverages the underlying causal relation-
ships among variables to provide recommendations
that are feasible and also to reduce the effort in terms
of actions to reach valid counterfactual profiles (e.g.
acting on seniority to influence rating in the example
of Table 2).
Our first practical evaluation employs a real
dataset of the financial domain and is based on well-
6
Notice that this metric is computed over standardized
feature values.
ICAART 2022 - 14th International Conference on Agents and Artificial Intelligence
30

known metrics and others that capture the particu-
larities of CEILS that confirm the efficiency of our
method in generating feasible actions with respect to
its baseline counterfactual generator.
Despite the growing research on the field of coun-
terfactual explanations, there are a lot of open ques-
tions and challenges yet to be tackled (Verma et al.,
2020). In particular, we are interested in relaxing
the assumption of having a complete and reliable
causal graph and work with incomplete causal rela-
tions. Moreover, as for future work, we consider to
extend our evaluation by employing other counterfac-
tual generators as baselines to analyze how it could
contribute to the overall results, and also to compare
the explanations produced by other causal methods
with the ones found with CEILS, and possibly involv-
ing end users to obtain feedback that will guide to-
wards better explanations. The preprint (Crupi et al.,
2021) includes detailed evaluations and experiments
on additional datasets.
REFERENCES
Arrieta, A. B., D
´
ıaz-Rodr
´
ıguez, N., Del Ser, J., Bennetot,
A., Tabik, S., Barbado, A., Garc
´
ıa, S., Gil-L
´
opez, S.,
Molina, D., Benjamins, R., et al. (2020). Explainable
Artificial Intelligence (XAI): Concepts, taxonomies,
opportunities and challenges toward responsible AI.
Information Fusion, 58:82–115.
Barocas, S., Selbst, A. D., and Raghavan, M. (2020). The
hidden assumptions behind counterfactual explana-
tions and principal reasons. In Proceedings of the
2020 Conference on Fairness, Accountability, and
Transparency, pages 80–89.
Castelnovo, A., Crupi, R., Del Gamba, G., Greco, G.,
Naseer, A., Regoli, D., and Gonzalez, B. S. M. (2020).
Befair: Addressing fairness in the banking sector. In
2020 IEEE International Conference on Big Data (Big
Data), pages 3652–3661. IEEE.
Crupi, R., Castelnovo, A., Regoli, D., and San
Miguel Gonz
´
alez, B. (2021). Counterfactual expla-
nations as interventions in latent space. arXiv preprint
arXiv:2106.07754.
Eberhardt, F. and Scheines, R. (2007). Interventions and
causal inference. Philosophy of science, 74(5):981–
995.
Gunning, D. and Aha, D. (2019). DARPA’s explainable
artificial intelligence (XAI) program. AI Magazine,
40(2):44–58.
High-Level Expert Group on AI (2019). Ethics
guidelines for trustworthy AI. https:
//ec.europa.eu/digital-single-market/en/news/
ethics-guidelines-trustworthy-ai.
Joshi, S., Koyejo, O., Vijitbenjaronk, W., Kim, B.,
and Ghosh, J. (2019). Towards realistic individ-
ual recourse and actionable explanations in black-
box decision making systems. arXiv preprint
arXiv:1907.09615.
Kalainathan, D. and Goudet, O. (2019). Causal discov-
ery toolbox: Uncover causal relationships in python.
arXiv preprint arXiv:1903.02278.
Kalainathan, D., Goudet, O., and Dutta, R. (2020). Causal
Discovery Toolbox: Uncovering causal relationships
in Python. Journal of Machine Learning Research,
21(37):1–5.
Kalisch, M., M
¨
achler, M., Colombo, D., Maathuis, M. H.,
and B
¨
uhlmann, P. (2012). Causal inference using
graphical models with the R package pcalg. Journal
of Statistical Software, 47:1–26.
Karimi, A.-H., Sch
¨
olkopf, B., and Valera, I. (2020). Algo-
rithmic recourse: from counterfactual explanations to
interventions. arXiv preprint arXiv:2002.06278.
Klaise, J., Van Looveren, A., Vacanti, G., and Coca, A.
(2019). Alibi: Algorithms for monitoring and ex-
plaining machine learning models. https://github.com/
SeldonIO/alibi.
Mahajan, D., Tan, C., and Sharma, A. (2019). Pre-
serving causal constraints in counterfactual explana-
tions for machine learning classifiers. arXiv preprint
arXiv:1912.03277.
Mothilal, R. K., Sharma, A., and Tan, C. (2020). Explain-
ing machine learning classifiers through diverse coun-
terfactual explanations. In Proceedings of the 2020
Conference on Fairness, Accountability, and Trans-
parency, pages 607–617.
Pearl, J. et al. (2000). Models, reasoning and inference.
Cambridge, UK: CambridgeUniversityPress, 19.
Pearl, J., Glymour, M., and Jewell, N. P. (2016). Causal
inference in statistics: A primer. John Wiley & Sons.
Peters, J., Mooij, J. M., Janzing, D., and Sch
¨
olkopf, B.
(2014). Causal discovery with continuous additive
noise models. Journal of Machine Learning Research,
15(58).
Stepin, I., Alonso, J. M., Catala, A., and Pereira-Fari
˜
na, M.
(2021). A survey of contrastive and counterfactual ex-
planation generation methods for explainable artificial
intelligence. IEEE Access, 9:11974–12001.
The European Union (2016). EU General Data Protec-
tion Regulation (GDPR): Regulation (EU) 2016/679
of the European Parliament and of the Council of 27
April 2016 on the protection of natural persons with
regard to the processing of personal data and on the
free movement of such data, and repealing Directive
95/46/EC (General Data Protection Regulation). Offi-
cial Journal of the European Union. http://data.europa.
eu/eli/reg/2016/679/2016-05-04.
Ustun, B., Spangher, A., and Liu, Y. (2019). Actionable re-
course in linear classification. In Proceedings of the
Conference on Fairness, Accountability, and Trans-
parency, pages 10–19.
Van Looveren, A. and Klaise, J. (2019). Interpretable coun-
terfactual explanations guided by prototypes. arXiv
preprint arXiv:1907.02584.
Verma, S., Dickerson, J., and Hines, K. (2020). Counter-
factual explanations for machine learning: A review.
arXiv preprint arXiv:2010.10596.
Leveraging Causal Relations to Provide Counterfactual Explanations and Feasible Recommendations to End Users
31

Wachter, S., Mittelstadt, B., and Russell, C. (2017). Coun-
terfactual explanations without opening the black box:
Automated decisions and the gdpr. Harv. JL & Tech.,
31:841.
White, A. and Garcez, A. d. A. (2019). Measurable coun-
terfactual local explanations for any classifier. arXiv
preprint arXiv:1908.03020.
Zheng, X., Aragam, B., Ravikumar, P. K., and Xing, E. P.
(2018). Dags with no tears: Continuous optimization
for structure learning. In Advances in Neural Informa-
tion Processing Systems, pages 9472–9483.
ICAART 2022 - 14th International Conference on Agents and Artificial Intelligence
32
