
Contactless Heart Rate Measurement using Image Processing
Gaganjot Kaur
a
and Jeff Kilby
b
Department of Electrical and Electronic Engineering, Auckland University of Technology, City Campus,
Auckland, New Zealand
Keywords: Heart Rate (HR), Spatial and Temporal Processing.
Abstract: Non-contact methods of determining the human body’s heart rate are of interest for clinical use. This research
used a video magnification technique on the individual frames from a 15-second video taken using a digital
single-lens reflex (DSLR) camera at 30 frames per second. It was possible to determine the heart rate beats
per minute by extracting the green spectrum from a region of interest information from the video frames. In
this paper, three methods are presented using this colour change between the frames transform as a signal to
find the heart rate. While capturing the video’s using the camera, a commercially available pulse oximeter
was used to obtain the pulse rate from the participant’s finger to validate the values calculated from the image
processing techniques presented. The results show that it is possible to get a heart rate in terms of pulse rate
reading using a camera and the developed MATLAB code.
1 INTRODUCTION
Heart rate (HR) variability is an essential parameter
in the clinical environment for assessing the heart’s
function. It is helpful to indicate health status and
diagnostics and assess cardiovascular diseases and
chronic diseases (Stouffer et al., 2018). The
frequency at which the heart beats, referred to as
pulse rate, is measured in the number of these beats
that occur per minute (bpm); the pulse rate changes
depending on the body’s need for oxygen (Schantz et
al., 2019). Many factors can influence this, including
but not limited to physical activity, emotion, illness,
stress, and drugs (Allen, 2007). Regular resting heart
rate for healthy adults falls within a range of 60 to 100
beats per minute (The Gale Encyclopedia of Fitness,
2012).
In 1938, Hertzman was the first to introduce the
term photoplethysmography (PPG) as a description of
a non-invasive optical technique for detecting the
changes in blood volume in blood vessels (Kamshilin
& Margaryants, 2017). It measures the light reflected
from or transmitted through the body by using the
principle that oxygenated haemoglobin absorbs more
light than its surrounding tissue (McDuff et al., 2015;
Verkruysse et al., 2008).
a
https://orcid.org/0000-0002-8379-4429
b
https://orcid.org/0000-0001-5010-7170
PPG became a popular method for measuring the
heart rate: it is non-invasive, less expensive, and less
complex (Feukeu & Winberg, 2019). Pulse oximeters
first became available commercially in 1983
(Kamshilin & Margaryants, 2017). They usually
contain two red and infrared lights (Aarthi et al.,
2019). A pulse oximeter is designed to fit over a
finger or, in some cases, an ear, toe, wrist and send
wavelengths of red and near-infrared through the
body.
Imaging PPG (iPPG) signal is similar to PPG
signal recorded in a non-contact method using a
camera. iPPG is an emerging technique that senses
cardiovascular signals in the outer skin layers
(Zaunseder et al., 2018).
2 THEORY
Non-contact measurement using videos is a popular
research area, and many tools are available to process
the videos in terms of colour and motion, such as
Eulerian Video Magnification (Wu et al., 2012). The
Eulerian method uses spatiotemporal filtering for the
extraction of motion and colour variations in the
video. Spatial decomposition is building image
Kaur, G. and Kilby, J.
Contactless Heart Rate Measurement using Image Processing.
DOI: 10.5220/0010761400003123
In Proceedings of the 15th International Joint Conference on Biomedical Engineering Systems and Technologies (BIOSTEC 2022) - Volume 4: BIOSIGNALS, pages 111-116
ISBN: 978-989-758-552-4; ISSN: 2184-4305
Copyright
c
2022 by SCITEPRESS – Science and Technology Publications, Lda. All rights reserved
111
pyramids that decompose the video sequence into
different spatial frequency bands. Spatial processing
aims to increase the temporal signal-to-noise ratio by
pooling multiple pixels, spatially low-pass filter the
video frames, and down sample them for
computational efficiency. In the general case, the
entire Laplacian pyramid was computed (Burt &
Adelson, 1983). The Laplacian pyramid is a sequence
of images 𝐿
, 𝐿
, … . , 𝐿
. Each is the difference
between the two levels of the Gaussian pyramid is
given by:
𝐿
= 𝑔
−EXPAND
𝑔
(1)
𝐿
= 𝑔
−EXPAND
𝑔
(2)
where 𝑔
is the 𝑙
level of Gaussian pyramid and
𝑔
and 𝑔
are second and third levels, respectively.
Temporal processing performs on each spatial
band that considers the time series corresponding to a
pixel value in a frequency band and applies a band-
pass filter to extract the frequency band of interest
(Wu et al., 2012).
3 METHODOLOGY
This section covers the procedure used to record and
process videos to determine the heart rate in bpm.
The results presented are from a pilot study where
videos were recorded from two participants using a
mirror-less DSLR, Olympus Pen Lite E-PL5 16-
megapixels CMOS sensor camera fitted with an
Olympus M Zuiko Digital 14-150mm F4-5.6 lens.
The videos were recorded at 30 frames per second
with a resolution of 1920×1080 pixels. The camera
was mounted on a tripod to eliminate any possible
movement artefacts due to the camera during
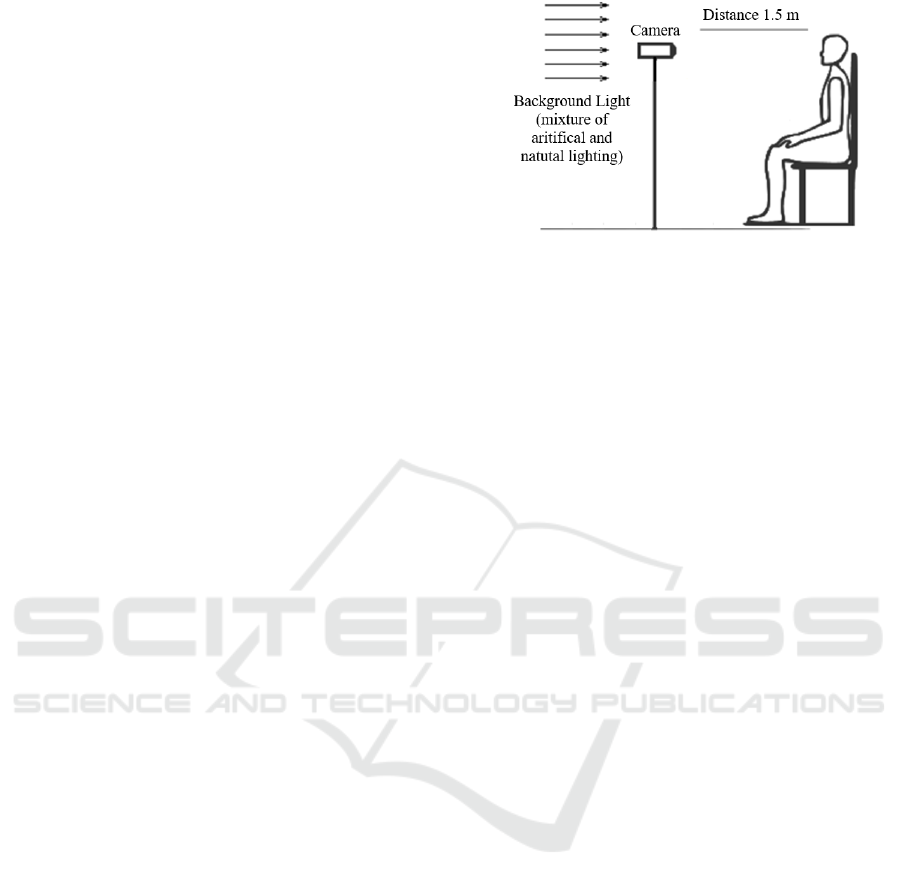
recording. The camera was positioned at the required
distance to have the participants face in the camera
frame; this distance was 1.5 metres. Video capture
took place in a large room with natural light and
artificial light throughout the room, so the
participants were not under any direct or forced
illumination. The participants sat upright on a chair
with the back of the chair against a dark coloured wall
to provide a clear difference in colour between the
area that was the participant’s face/head and the
background, shown in Figure 1.
Figure 1: Setup of video recording.
Each video was recorded 15 to 20 seconds in
length. During filming, the participants were asked to
remain as still as possible but to breathe normally.
While videos were recording, the participants
wore a Rossmax SB100 Finger Pulse Oximeter to
validate the recorded videos’ results, placed on their
dominant hand’s first finger.
3.1 Object Detection
Object detection can identify the video’s region of
interest (ROI) to mitigate background noise
interference (Poh et al., 2010). Bush compared
various ROIs of the face for HR detection: a standard
bounding box ROI, a box with the eyes removed, a
box section of the forehead, and the face cropped
(Bush, 2016). Bush also reported that all four
approaches performed equally in error rate whether
the participant was still or moving; the forehead
targeted area had a slightly lower error rate (Bush,
2016). However, the forehead ROI resulted in a
significantly higher outlier percentage. Overall, the
most efficient was the simple ROI as it is the fastest
to compute and has equivalence performance to the
more targeted ROIs. However, if noise interference
from the background is a concern, then a segmented
region cropping the face should be considered.
3.2 Image Processing
The video was separated into a sequence of image
frames then passed through a series of image
processing techniques.
The spatial decomposition of each frame will
characterise the variation over space; this process will
reduce image noise and increase the temporal signal-
to-noise ratio (Poh et al., 2010). Wu et al. approach
was to decompose each frame to different spatial
frequency bands, applying Gaussian blur to pool
multiple pixels together (Wu et al., 2012). The green
colour channel’s pixel values were pooled together to
compute the average quantity of green across all
BIOSIGNALS 2022 - 15th International Conference on Bio-inspired Systems and Signal Processing
112
frames and the corresponding variation per frame; to
obtain a signal representing the green colour
channel’s fluctuations within the ROI (Alghoul et al.,
2017).
3.3 Video Processing
The MATLAB (release R2020b) function
‘VideoReader’ was used for processing the videos,
which extracted the required information: frame rate,
number of frames, video height, video width and
duration
.
Using object detection application was used to
identify an ROI; the algorithm is performed on each
video frame to obtain an ROI. The MATLAB code
detected the ROI once and applied the same ROI to
all the frames. To improve the efficiency of the code
by reducing the computation time. The ROI output is
a four-element vector [x, y, width, height] bounding
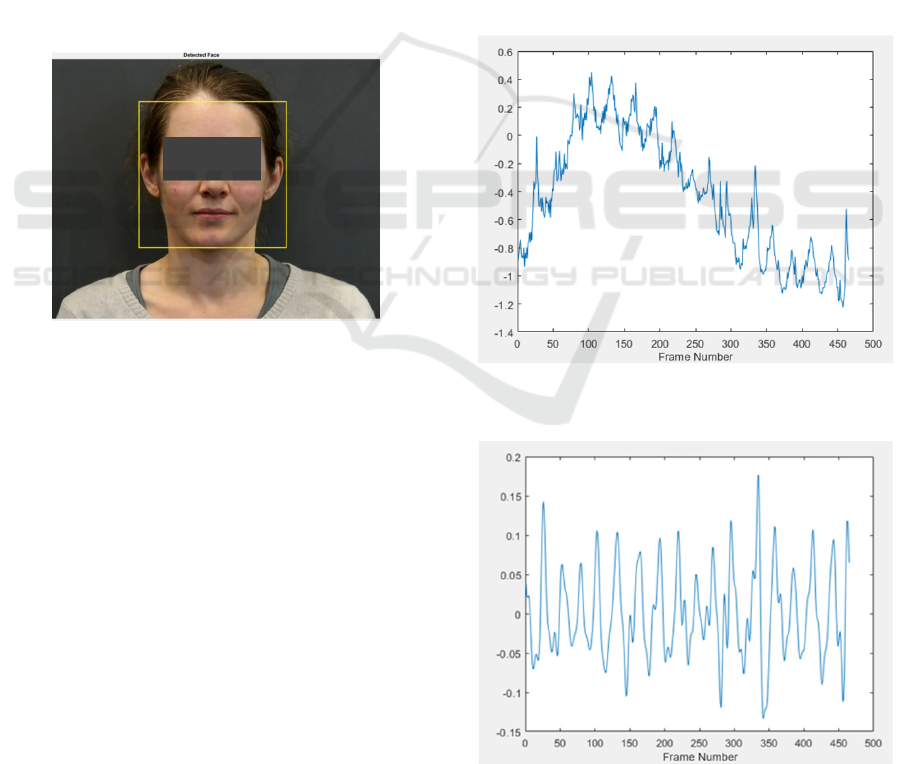
box square in shape see Figure 2.
Figure 2: ROI identified face detected.
To compute the average pixel value of the green
colour channel, developed using MATLAB code was
used, and the signal processing code was used for
achieving temporal image processing.
3.4 Heart Rate Measurements
For the research presented using the signals, the heart
rate beats per minute able to be found using one of the
following three methods:
• Method 1: using the FFT of the filtered signal in
the frequency domain and using the dominant
peak frequency corresponds to the
• mean bpm measurement.
• Method 2: using the number of peaks over the
video’s total time to calculate the mean bpm. This
method used the MATLAB’ findpeaks’ function
with conditions applied to minimum peak height,
minimum peak distance, and minimum peak
prominence. The peak HR values were plotted
against time, with each measurement identified
with a marker.
• Method 3: uses results obtained in method 2; two
consecutive peak values were used to calculate an
HR value. These values were then plotted against
time to show the variation of HR for the video
4 RESULTS
The results presented were obtained using video
filename: P101.
4.1 Method 1
Figure 3 shows the selected colour channel
fluctuations within the ROI, plotting the green colour
channel signal.
Figure 3: Signal for fluctuations in the green colour channel
within ROI.
Figure 4: Filtered signal against frame number.
Contactless Heart Rate Measurement using Image Processing
113
The filtered signal is plotted against to frame
number, shown in Figure 4.
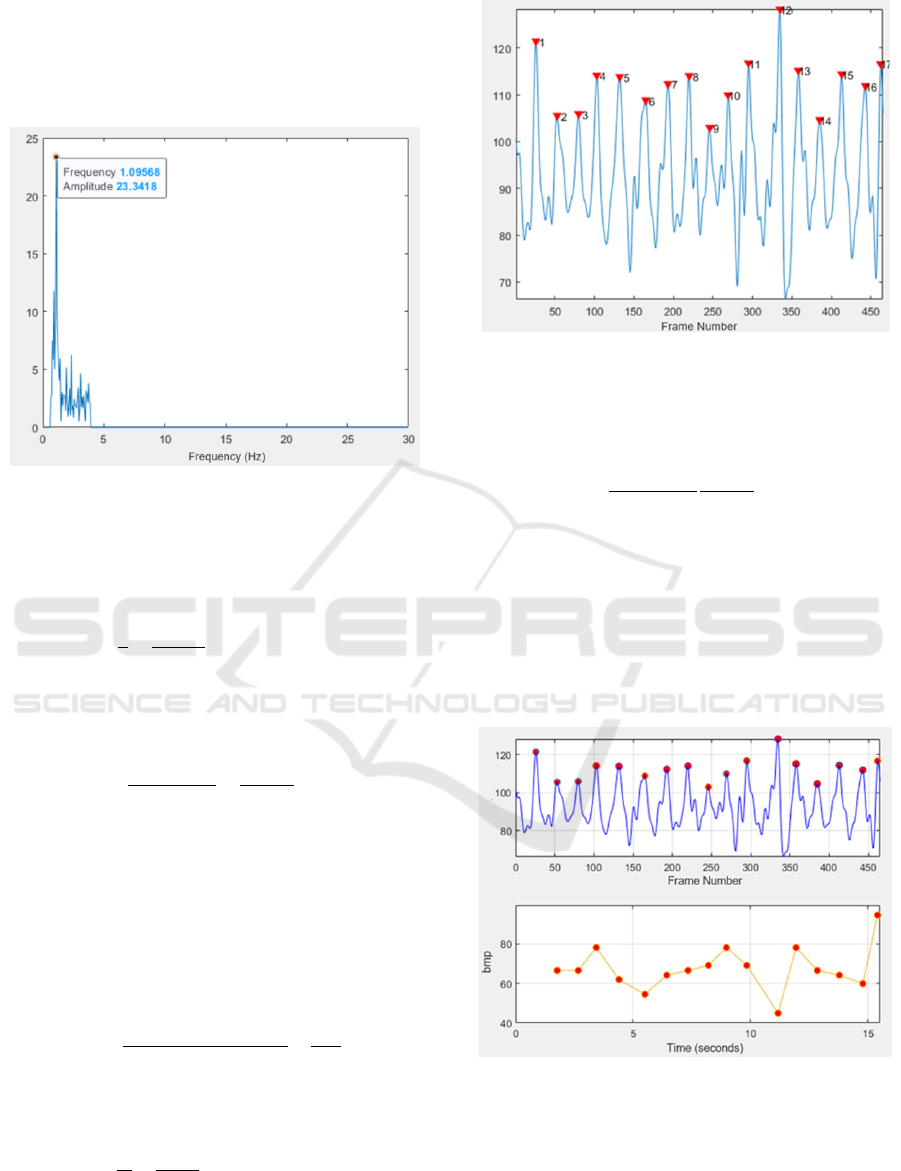
The FFT of the filtered signal shown in Figure 5
shows the maximum peak value was extracted and
marked on the plot.
Figure 5: FFT plot of filtered signal in the frequency
domain.
The dominant frequency is at 1.09568 Hz
corresponds to a mean HR value of 65.74 bpm and
which was calculated as follows:
𝑇=
1
𝑓
=
1
1.0956
= 0.9127𝑠𝑒𝑐𝑜𝑛𝑑𝑠
where T is the periodic time in seconds, and 𝑓 is the
frequency in Hz. So, the heart rate in beats per minute
(
𝑏𝑝𝑚) is:
𝑏𝑝𝑚 =
60 𝑠𝑒𝑐𝑜𝑛𝑑𝑠
𝑇
=
60
0.9127
= 65.74
4.2 Method 2
Figure 6 shows the filtered signal waveform where
each peak associated with each heartbeat is marked
and numbered and plotted against frame number.
The mean HR is 65.67 bpm, calculated from the
total number of peaks against the number of frames
and HR in bpm and was calculated as follows:
𝑛=
𝑡𝑜𝑡𝑎𝑙 𝑓𝑟𝑎𝑚𝑒 𝑛𝑢𝑚𝑏𝑒𝑟
𝑛𝑢𝑚𝑏𝑒𝑟 𝑜𝑓 𝑝𝑒𝑎𝑘𝑠
=
466
17
= 27.41 𝑓𝑟𝑎𝑚𝑒𝑠/𝑝𝑒𝑎𝑘
where 𝑛 is the mean number of frame per peak, so:
𝑇=
𝑛
𝑚
=
27.41
30
= 0. 9136 𝑠𝑒𝑐𝑜𝑛𝑑𝑠
Figure 6: Peaks detected marked and numbered for the
signal from Figure 4.
where 𝑚 is the frames per second (fps), the heart rate
in beats per minute (𝑏𝑝𝑚) is:
𝑏𝑝𝑚 =
60 𝑠𝑒𝑐𝑜𝑛𝑑𝑠
𝑇
60
0.9136
= 65.67
4.3 Method 3
In Figure 7, the top plot is a repeat of Figure 6, and
the bottom plot shows the result using two
consecutive and finding the HR values in bpm; this is
repeated for all the values and then plotted against
time. The overall mean for the bottom plot HR values
was calculated and had a value is 67.73 bpm.
Figure 7: The signal is taken from Figure 6 (top), and HR
values are plotted against time (bottom).
The results presented in this paper, which used
video filename: P101 gave HR values for (a) method
one equal to 65.74 bpm, (b) method two a mean value
HR of 65.67 bpm and (c) method three a mean HR of
67.73 bpm. A commercially purchased pulse
BIOSIGNALS 2022 - 15th International Conference on Bio-inspired Systems and Signal Processing
114

oximeter was used to validate all the results taken; for
video file P101, the HR range obtained was 68-65
bpm, an average of 66.5 bpm.
Table I shows the experimental results from six
recorded videos taken using two participants. Both
particants where female with an average age of 25
years with fair skin complextion.
Table 1: Video result values of Participant 1 and 2.
Participant 1
Video
No.
Experimental HR Values
(bpm)
Validation HR
Values from
Pulse Oximeter
(bpm)
Method
1
Method
2
Method
3
Range
Averag
e
P101 65.74
65.67 67.73 68-65 66.50
P102 63.69
63.69 64.93 60-63 61.50
P103 87.19
79.92 86.68 108-80 94.00
Participant 2
Video
Experimental HR Values
(bpm)
Validation HR
Values from
Pulse Oximeter
(bpm)
Method
1
Method
2
Method
3
Range Average
P209 98.72
98.72 103.10 110-98 104.00
P210 98.08
94.45 95.75 104-99 101.50
P211 99.33
95.90 99.46 102-99 100.50
5 CONCLUSION
From the results obtained, three limitations have been
identified.
Firstly, the recording of the pulse oximeter results
parallel to the video recording was done by observing
and writing the values down on paper. This approach
introduced human error to the validation results. This
error was eliminated by using a pulse oximeter with a
wireless data logger.
Secondly, there is a weak correlation in the results
at higher HR values and reduced accuracy from the
experimental results.
The third limitation is the video recording were
taken with the highest quality camera that was
accessible, though these observations were also
evident in the other standard consumer camera
devices. When reviewing the video footage, video
recording starts and stops; this can introduce
unwanted interference in the image due to the camera
sensor’s light sensitivity. At times during the
recording, the camera footage becomes blurry, and
then the camera refocuses itself.
This research has demonstrated that it is possible
to acquire HR measurement without physical contact
with the participant by obtaining a signal through
image processing of a video recording. Factors such
as the lighting conditions, video recording settings,
and ROI. All these variables require further
investigation to see how they influence HR value
accuracy. However, precision drops under non-ideal
conditions. Though the delivered product is
promising, these limitations would be significant for
real-world application.
Further work is to create a more robust product
and record videos from a more significant number of
participants for data collection so results are
validated.
REFERENCES
Aarthi, Y., Karthikeyan, B., Raj, N. P., & Ganesan, M.
(2019). Fingertip Based Estimation Of Heart Rate
Using Photoplethysmography. 5th International
Conference on Advanced Computing &
Communication Systems (ICACCS),
Alghoul, K., Alharthi, S., Al Osman, H., & El Saddik, A.
(2017). Heart Rate Variability Extraction From Videos
Signals: ICA vs. EVM Comparison. IEEE Access, 5,
4711-4719.
Allen, J. (2007, Mar). Photoplethysmography and its
application in clinical physiological measurement.
Physiol Meas, 28(3), R1-39. https://doi.org/10.1088/
0967-3334/28/3/R01
Burt, P., & Adelson, E. (1983). The Laplacian Pyramid as
a Compact Image Code. IEEE Transactions on
Communications, 31(4), 532-540.
Bush, I. (2016). Measuring heart rate from video. In
Standford Computer Science, in press.
Feukeu, E., & Winberg, S. (2019). Photoplethysmography:
Light Emitter Diode Wavelength Derivation from the
Absorption Spectra of Haemoglobin. International
Multidisciplinary Information Technology and
Engineering Conference (IMITEC),
The Gale Encyclopedia of Fitness. (2012). (First ed.). Gale,
Cengage Learning.
Kamshilin, A. A., & Margaryants, N. B. (2017). Origin of
Photoplethysmographic Waveform at Green Light.
Physics Procedia, 86, 72-80.
McDuff, D. J., Estepp, J. R., Piasecki, A. M., & Blackford,
E. B. (2015). A survey of Remote Optical
Photoplethysmographic Imaging Methods. 37th
Annual International Conference of the IEEE
Engineering in Medicine and Biology Society (EMBC),
Poh, M.-Z., McDuff, D. J., & Picard, R. W. (2010). Non-
contact, automated cardiac pulse measurements using
video imaging and blind source separation. Optics
express, 18(10), 10762-10774.
Schantz, P., Salier Eriksson, J., & Rosdahl, H. (2019). The
heart rate method for estimating oxygen uptake:
Contactless Heart Rate Measurement using Image Processing
115

Analyses of reproducibility using a range of heart rates
from cycle commuting. PLOS ONE, 14(7), 1-20.
Stouffer, G., Runge, M. S., Patterson, C., & Rossi, J. S.
(2018). Netter's Cardiology E-Book. Elsevier Health
Sciences.
Verkruysse, W., Svaasand, L. O., & Nelson, J. S. (2008).
Remote plethysmographic imaging using ambient light.
Optics express, 16(26), 21434-21445.
Wu, H.-Y., Rubinstein, M., Shih, E., Guttag, J., Durand, F.,
& Freeman, W. (2012). Eulerian Video Magnification
for Revealing Subtle Changes in the World. ACM
Transactions on Graphics - TOG, 31.
Zaunseder, S., Trumpp, A., Wedekind, D., & Malberg, H.
(2018, Oct 25). Cardiovascular assessment by imaging
photoplethysmography - a review. Biomed Tech (Berl),
63(5), 617-634. https://doi.org/10.1515/bmt-2017-0119
BIOSIGNALS 2022 - 15th International Conference on Bio-inspired Systems and Signal Processing
116
