
Analysis of ERGM Evolutionary Dynamics from a Multi-layer
Network Perspective: Based on New Energy Vehicle Industry Data
1
Hansong Zou
1a
and Qin Liu
2b
1
Wuhan University of Technology, Wuhan University of Technology, Wuhan, China
2
School of Management, Wuhan University of Technology, Wuhan, China
Keywords: Multi-layer Network, ERGM, Evolutionary Dynamics, Data Mining, Statistical Analysis.
Abstract: In the context of environment and energy bundle, the development of the economy has gradually entered into
a new state, and more and more countries have started to pay attention to the environment and ecological
development issues, and have made strategic deployment at the national macro level. In order to optimize the
green innovation network and promote the development of green innovation, this study, from the perspective
of a multi-layer network, uses the data of new energy vehicle patent citation, paper co-publication data, and
production supply relationship data from 2009 to 2020, constructs a multi-layer network including paper
knowledge network, innovation R&D network and production supply network to explore the evolution of
structural characteristics of new energy vehicle innovation network, and uses principal component analysis to
obtain knowledge capability and production capacity variables, and constructs ERGM model to analyze the
evolutionary dynamics of the multilayer network. The results show that the innovation level of the new energy
vehicle industry is closely related to the network structure; at the level of evolutionary dynamics, the number
of partners, the degree of similarity in production level is positively related to partnership formation, the
number of shared partners is negatively related to partnership formation, and the difference in knowledge
level has no significant determining effect on relationship formation.
1 INTRODUCTION
Under the background of resource environment and
energy constraint, more and more countries are
implementing the guiding measures of "innovation-
driven, quality-first, green development and
structural optimization". As a perfect combination of
green, innovation, and economic development, the
new energy vehicle industry, which belongs to the
manufacturing industry, has become an important
object of research for scholars. However, the current
new energy vehicle industry faces problems such as
imperfect innovation deployment, unbalanced
industrial layout, and insufficient innovation
efficiency. Therefore, it is important to explore the
evolution and layout of collaborative innovation and
industrial chain network of new energy vehicles and
identify the key factors affecting innovation
performance.
a
https://orcid.org/0000-0003
-
3094-7513
b
https://orcid.org/0000-0003-0719-148X
For the evolution of green innovation networks,
studies mainly focus on two perspectives: the
evolution of network structure and the dynamics of
network evolution. From the perspective of network
structure characteristics, at the level of evaluation of
influencing factors, Xu used the method of cluster
analysis to divide the development stages of new
energy vehicle technology innovation and
dynamically analyzed its network evolution in three
aspects: the overall network characteristics, the
location characteristics of innovation subjects, and
the distribution of the depth and breadth of
cooperation of innovation subjects (Xu 2020). In the
spatial and temporal dimensions, Cao et al. used the
social networks to analyze the network structure and
the evolution pattern of spatial distribution of the new
energy vehicle patent cooperation network during
1989-2015 (Cao 2019). Lee analyzed the evolution of
the network structure of collaborative inventions in
390
Zou, H. and Liu, Q.
Analysis of ERGM Evolutionary Dynamics from a Multi-layer Network Perspective: Based on New Energy Vehicle Industry Data.
DOI: 10.5220/0011346100003437
In Proceedings of the 1st International Conference on Public Management and Big Data Analysis (PMBDA 2021), pages 390-397
ISBN: 978-989-758-589-0
Copyright
c
2022 by SCITEPRESS – Science and Technology Publications, Lda. All rights reserved

urban areas in the United States during 1979-2009
and found that the complexity of intercity networks
expanded and deepened, and technical collaborative
inventions were closely linked to core urban areas
(Lee 2016).
In the perspective of the evolutionary dynamic,
Ruan clarified the dynamics of technological
innovation network evolution and used ERGM to
analyze the evolutionary dynamics of OLED
technology innovation networks from five different
proximities: geographic, social, technological,
organizational, and institutional (Ruan 2018).
CSternitzke et al. found that collaborative
relationships among inventors can facilitate
knowledge interaction processes among inventor
collaborative network organizations (Csternitzke
2016).
Comprehensive domestic and international
literature reveals that existing system theories have
studied the structure, innovation dynamics,
innovation process, and innovation performance of
green innovation systems in traditional
manufacturing industries in a relatively detailed
manner, but the current research on innovation
networks often focuses only on a certain level of
R&D or industry, lacking the overall exploration of
the integration of innovation and industry chains. In
addition, in terms of perspective, it is more from the
perspective of a single-layer network and lacks the
analysis of the inter-layer linkage between innovation
and industrial multi-layer networks to achieve multi-
layer interaction among academia, innovation, and
industry.
Based on this, this study constructs a multilayer
network from the perspective of multilayer networks,
using the data of new energy vehicle thesis, patent
data, and supply relationship data to build a
multilayer network for the fusion of the three layers
of networks in the manufacturing industry, analyze
the structure and evolution trend of the multilayer
network, and use ERGM to explore the influence of
knowledge and production capacity on the evolution
of the innovation network. In order to analyze the
innovation ecological network of new energy
vehicles with the help of the multilayer network
theory, and to provide references for the construction
and optimization of the green innovation ecological
network of the national manufacturing industry.
2 DATA SOURCES AND
RESEARCH METHODS
2.1 Data Source and Processing
New energy vehicles, as the leading industry of green
innovation, exploring the technological innovation
network of it is representative and relevant. And
among many innovation achievements, patents are
the most widely used data in the field of innovation,
which are advanced and innovative (Zhao 2009), so
this paper selects the field of new energy vehicles as
the empirical object and uses patent R&D as a
measure of innovation performance.
In terms of data selection, this study selected 60
new energy vehicle innovation subjects including
BYD, Xiaopeng Automobile, Chery Automobile, and
other vehicle enterprises as research objects. Because
new energy vehicles formally entered the preparation
stage of R&D industrialization around 2008, before
that it was mostly the strategic layout stage with fewer
invention patents, and the patent data in 2021 is
incomplete, so the data period chosen in this paper is
2009-2020, and a three-tier network of academia,
research, and industry is established to analyze the
evolutionary characteristics and formation
mechanism of the innovation network of new energy
vehicles.
2.1.1 Knowledge Learning Layer
The knowledge layer network was based on the
publication of papers, and the paper data were
exported on CNKI, Google Scholar based on the
advanced search mode of vehicle enterprise + time.
Duplicates were excluded and 15033 papers were
obtained. With the vehicle enterprise as the node and
the university institution as the intermediary, a
cooperative relationship was established based on the
joint publication of author units, and 3963
connections were obtained by screening out non-
intermediated institutions and isolated nodes.
2.1.2 Patent R&D Layer
The R&D layer is based on patent data, and on the
website of incopat (https://www.incopat.com/), input
(AP=(vehicle enterprise)) AND (AD=[20090101 TO
20211004]), export data according to the vehicle
enterprise as a unit, and after screening out invalid
data, get 86,839 patents, and use patent citation After
filtering out the invalid data, we got 86,839 patents,
and using the citation and cited relationship to
Analysis of ERGM Evolutionary Dynamics from a Multi-layer Network Perspective: Based on New Energy Vehicle Industry Data
391
establish a connection, we got 19,063 times of patent
citation frequency.
2.1.3 Supply Production Layer
The supply chain layer is based on the supply
relationship of new energy vehicle battery, drive
motor, battery control, and motor control, and the data
is exported from the "MARK LINES Global
Automotive Information Platform" website
(https://www.marklines.com/cn/cn) according to the
classification of each segment to obtain a total of We
filtered out 1,435 data of vehicle enterprises in the
scope of our study, and established connections by
supplying parts to vehicle enterprises with the vehicle
as a unit, and obtained supply relationships 740 times.
2.2 Research Methods and Models
Based on the network data, we use python to read the
data to establish a three-layer network of learning,
research, and production, and analyze the laws and
trends of network evolution over time from the
perspective of the multi-layer network, and select two
extrinsic variables, knowledge learning, and supply
production, as well as patent R&D itself as an
intrinsic variable, to investigate the impact of multi-
layer network structure on enterprise innovation
performance. The multi-layer network structure is
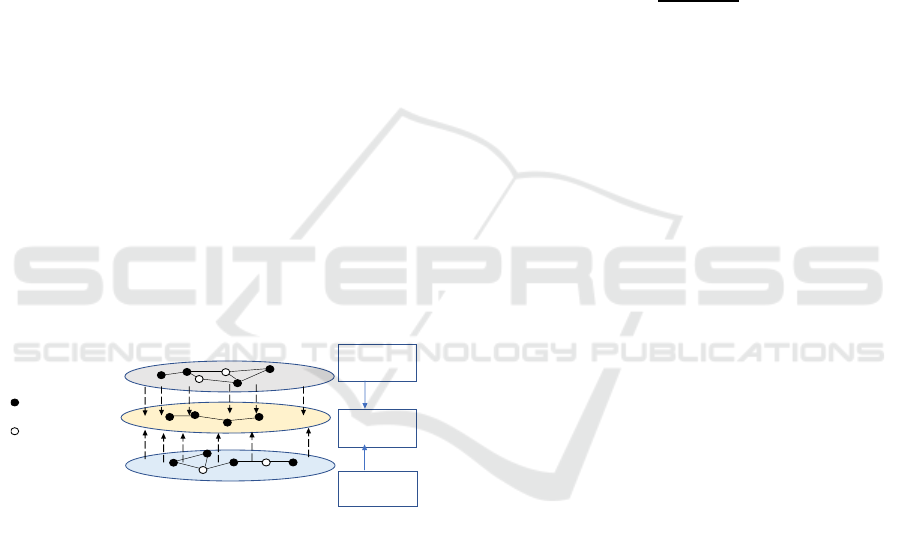
shown in Figure 1.
Figure 1: Schematic diagram of the network structure.
2.2.1 Structural Feature Analysis
The evolutionary characteristics of the innovation
network are described at two levels: overall network
and individual. Since cooperation and innovation
performance has a lag effect (Liu 2021), based on a
lag period of three years, the data from 2009-2020 are
divided into 2009-2011, 2010-2012, 2011-2013,
2012-2014, 2013-2015, 2014-2016, 2015-2017,
2016- 2018, 2017-2019 nine stages to analyze the
evolutionary characteristics of the innovation
network structure.
2.2.2 Evolutionary Dynamics Analysis
In order to study the impact of multi-chain integration
on innovation networks, this paper uses principal
component analysis to measure the knowledge and
production levels of nodes with the help of
knowledge layer and industry layer indicators as
exogenous variables, and the degree, degree-sharing,
and edge-sharing of nodes in the innovation network
as endogenous variables to establish hypotheses to
build a model. Finally, the ERGM model is fitted to
diagnose the impact of the variables on the evolution
of the innovation layer network.
The general form of the ERGM is as follows:
𝑃(𝑌 = 𝑦) =
(())
()
(1)
where k is a constant ensuring that the probability of
a new network structure ranges from 0 to 1 and θ' is a
coefficient of the network structure statistic g(y).
Based on the above assumptions, an analytical
framework containing endogenous structural
variables and exogenous node attributes is
constructed, and the model architecture is
schematically shown in Figure 2:
3 ANALYSIS OF THE
EVOLUTION OF MULTI-
LAYER INNOVATION
NETWORKS
Using the Gephi import network matrix, the stage
network indicators and the Pearson correlation
coefficients between each indicator and innovation
performance were obtained as shown in Figure 2, and
the influence of network structure on innovation
performance was analyzed by observing the changes
of each network indicator selected to integrate
innovation performance.
1) The number of nodes, which indicates the
number of subjects involved in knowledge citation in
the patent citation network, can be used to measure
the scale of the knowledge innovation network of new
energy vehicles. The nodes of vehicle enterprises in
each time window from 2009 to 2020 grew from 15
to 58, and the scale of the network continuously
expanded and stabilized. The larger the network and
the richer the network resources, the more it
facilitates knowledge integration and exchange and
innovation (Jin 2020), which has a positive effect on
innovation performance positively.
vehicle enterprises
Universities and Institutions
Knowledge
learning layer
Innovative R&D
layer
Supply
p
roduction layer
promote
promote
PMBDA 2021 - International Conference on Public Management and Big Data Analysis
392

2) The weighted average degree indicates the
average number of citations of patents in the current
window of each subject in the patent citation network,
which can be used to measure the closeness and
frequency of node connections in the knowledge
innovation network. As can be seen from the table,
the average degree shows a rising trend year by year
and the growth rate is steadily climbing, indicating
that the knowledge exchange among enterprises is
gradually frequent and close, which plays a role in
promoting knowledge innovation.
3) The agglomeration coefficient reflects the
formation and aggregation of community groups in
the network. It is also obvious from the table that with
the change of time, the clustering coefficient of the
patent citation network increases continuously and
stabilizes at about 0.8. It indicates that with the
passage of time, the knowledge cooperation among
enterprises in the new energy vehicle industry tends
to be more and more clustered and stable, forming a
joint development pattern centered on a small number
of strong enterprises.
Figure 2: Innovation Network Indicators.
4 STUDY OF THE
EVOLUTIONARY DYNAMICS
OF INNOVATION NETWORKS
4.1 Hypothesis Building
4.1.1 Endogenous Structural Variables
Network connections for technological innovation
have a certain preference, objects with high degree
nodes can be considered to have gained the
recognition of more companies and are more likely to
establish connections with other nodes in the choice
of companies, presenting as the basic side structure in
the network. However, network relationships are
established in long-term interactions between
subjects, after a long period of examination, learning,
and selection, and there are costs to be paid for
accumulating and maintaining network relationships,
requiring long-term and continuous investment in
relationship building, and when existing partners can
meet their own innovation needs, subjects are
reluctant to spend high costs to establish new
partnerships.
Therefore, the hypothesis is established that:
H1a: During the evolution of innovation
networks, nodes with a high degree tend to establish
new collaborations.
H1b: During the evolution of innovation
networks, nodes with a high degree tend to avoid
establishing new collaborations.
In the context of business innovation, sociologists
have coined the term 'transmissibility' to describe the
triadic sharing partnerships that are established
between firms. If both firm A and firm B are linked to
C, then firm C acts as a kind of intermediary, a
witness, and it is easier to build trust between A and
B, forming links that are presented as side and degree
sharing in the network.
Therefore, the hypothesis is established that:
H2a: Nodes with shared edges are more inclined
to establish new collaborations during the evolution
of innovation networks.
H3a: Degree sharing nodes are more inclined to
establish new collaborations during the evolution of
innovation networks.
4.1.2 Exogenous Attribute Variables
In addition to the characteristics of the location
structure of the nodes that affect the establishment of
network relationships, there are also attributes that are
inherent to the enterprises themselves that are
detached from the network structure. In order to study
the impact of chain integration of industry-academia-
research on enterprise innovation, this paper selects
two variables, knowledge level, and production level,
to explore their evolutionary dynamics.
In terms of knowledge level, the more similar the
knowledge level is, the more knowledge crossover
there is in the exchange process, the less costly it is to
transfer information and therefore the easier it is to
establish connections and the more efficient the
exchange of innovation is, which is explained by the
term 'homogeneity' in social networks. At the same
time, however, from another point of view, the
purpose of knowledge exchange is to complement
each other's strengths, and the closer the knowledge
of two companies is, the less benefit they can gain
from working with each other, and therefore the
similarity of knowledge levels may have the opposite
effect on the establishment of a partnership.
Analysis of ERGM Evolutionary Dynamics from a Multi-layer Network Perspective: Based on New Energy Vehicle Industry Data
393
Thus the hypothesis is established that:
H3a: During the evolution of an innovation
network, individuals with widely varying levels of
knowledge are more likely to form collaborative
relationships.
H3b: During the evolution of innovation
networks, individuals with similar levels of
knowledge are more likely to form collaborative
relationships.
In terms of production levels, as a business
enterprise, profit always comes first and a company's
production capacity determines to a certain extent the
ability to translate knowledge into real value, the
better the production capacity and production
conditions, the easier it is to attract companies to
establish connections.
Thus establishing the hypothesis that:
H4a: During the evolution of innovation
networks, cooperation is more likely to be established
between individuals with large differences in
production capacity.
H4b: During the evolution of innovation
networks, individuals with similar levels of
production are more likely to establish collaborative
relationships.
4.1.3 Calculation of Indicators of
Production Capacity and Knowledge
Level
There are two main types of indicators for an
enterprise's knowledge and production capacity.
The first category is its own attributes, for
example, the number of published papers can
represent its knowledge reserve, and the annual
output of an enterprise can measure its production
capacity. The second category is resource attributes,
which can be measured by their position in the
network.
In order to make a comprehensive measurement
of the knowledge level and production level of an
enterprise, this paper adopts the principal component
analysis method and uses SPSS to do principal
component analysis on the above variables, so as to
obtain a comprehensive score of knowledge level.
4.2 Study of the Evolutionary
Dynamics of ERGM Networks
4.2.1 Model Building
Based on the above hypothesis building, an analytical
framework containing endogenous structural
variables and exogenous node attributes is
constructed and the ERGM model is established as
follows.
𝑃
(
𝑋=𝑥
)
=
𝑒𝑥𝑝𝜃
Edges + 𝜃
Gwdsp +
𝜃
Gwesp + 𝜃
𝑛𝑜𝑑𝑚𝑎𝑡𝑐ℎ
(
Knowledge
)
+
𝜃
𝑛𝑜𝑑𝑒𝑐𝑜𝑣
(
Output
)
(2)
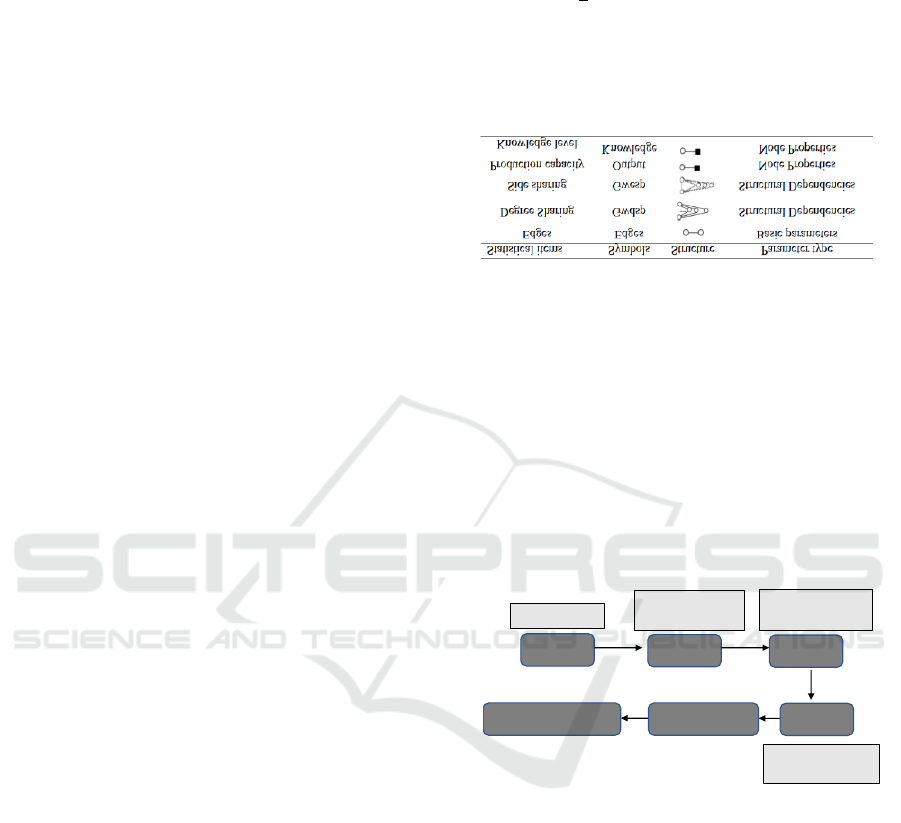
The specific variables and associated explanations
are shown in Figure 3 below:
Figure 3: Explanation of indicators.
4.2.2 ERGM Analysis Results
The ERGM model was calculated using the Statenet
program package in the R environment, and the
model parameters were estimated using Markovian
Monte Carlo maximum likelihood estimation
(MCMC), and the model fit was assessed. The patent
citation cooperation network of new energy vehicle
enterprises from 2009 to 2020 was introduced as the
observation network. Model architecture as in Figure
4.
Figure 4: Model architecture.
From the results, it can be seen in Figure 6 that
after adding the statistical terms in turn, Model4 has
the smallest AIC and BIC coefficients, indicating that
the model fits the observation network most closely.
From the specific fitting details, Figure 5 and
Figure 6 show the gap between each statistical term
of the model and the observation network. On the
whole, most of the indicators are concentrated near
the observation network, and as shown in Figure 7 the
deviation curve basically conforms to the normal
distribution characteristics and is concentrated near 0,
and each indicator fits better. From the degree
statistics results, the relationship between the number
of nodes of the simulated network and the
corresponding degree of the observed network can be
Model1
Model2
Model3
Goodness-of-fit test
Original model
Adding structural
dependencies
Adding knowledge
level
Adding production
capacity
MCMC Diagnosis
Model4
PMBDA 2021 - International Conference on Public Management and Big Data Analysis
394
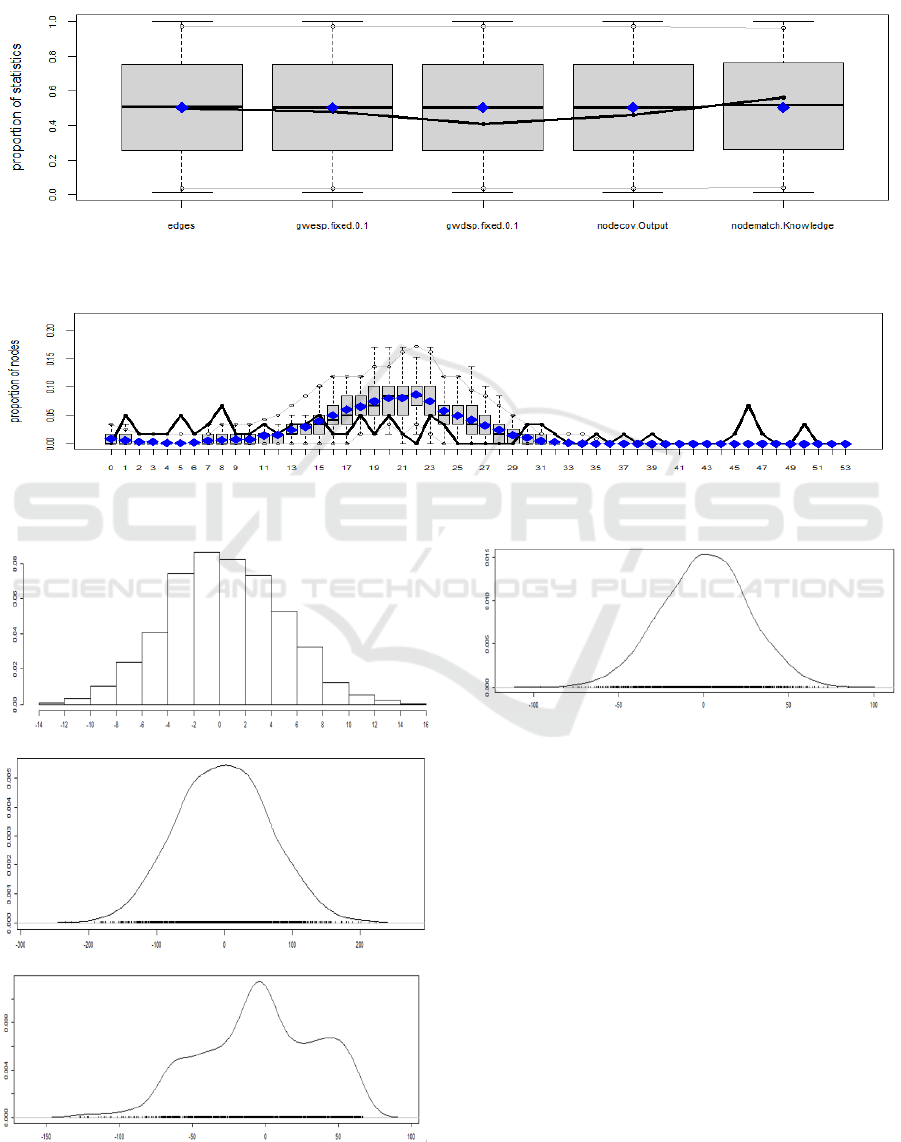
seen in Figure 3, and it can be found that the number
of nodes of the observed network for each degree is
roughly contained between the maximum and
minimum values of the simulated network,
fluctuating in a small range above and below the
mean value. So it can be seen that the integrated
model of Model4 is closer to the observed network
than the more advanced model, and it is reasonable to
assume that the other model is more accurate than the
other models in terms of estimation results.
Figure 5: Comparison of indicators.
Figure 6: Degree Comparison.
Figure 7: Metrics statistics of the simulation model.
As shown in Figure 8. The endogenous structure
of the dependency estimation results show that degree
extension edges are positively correlated in
relationship formation, thus supporting hypothesis
H1a and rejecting hypothesis H1b. Degree-sharing
and edge-sharing are significantly negatively
correlated in relationship formation, rejecting H2a,
H2b, which may be explained by the fact that in the
process of network formation, in the early stage of
formation, in order to expand the scale and absorb
resources, shared partners may have a positive effect
on relationship formation. However, in the growth
stage and beyond, the innovation network has been
gradually improved, the functional overlap of the
subjects is very high, and the differences that exist are
relatively small, which means that the possibility of
Analysis of ERGM Evolutionary Dynamics from a Multi-layer Network Perspective: Based on New Energy Vehicle Industry Data
395
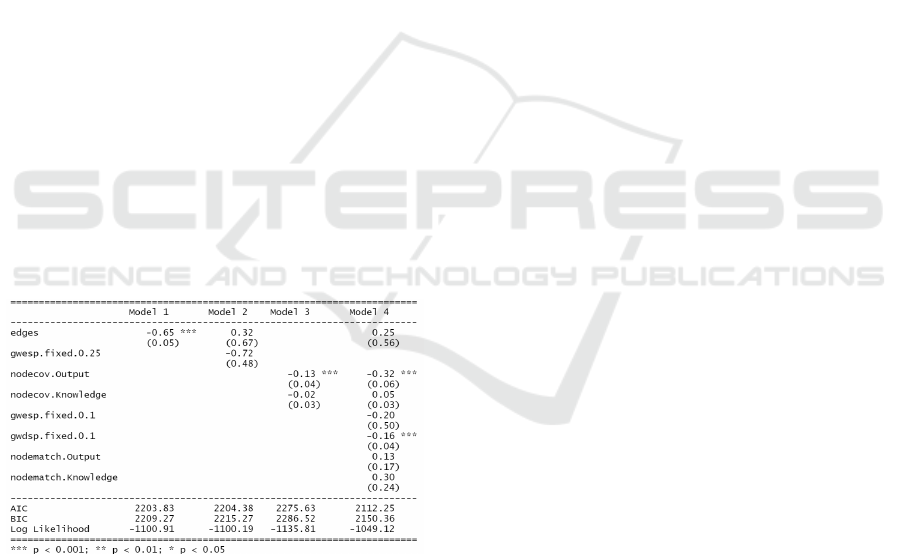
substitution is high. Firms choose to avoid sharing
their partners in order to safeguard their own interests
and to ensure the continued demand for themselves
by other subjects (Liu 2020).
The production capacity indicator Output is
significantly negatively correlated as a covariate and
positively correlated as a homogeneous indicator,
supporting hypothesis H4b and rejecting hypothesis
H4a, which implies that high production capacity is
not conducive to partnership building. The reason for
this may be that for large new energy vehicle
enterprises, which are prone to forming independent
production lines, they refuse to cooperate with small
new energy vehicle enterprises, choosing instead to
cooperate with similar enterprises on the basis of
other resource requirements for a win-win situation,
while for the few disadvantaged new energy
enterprises, they also lack the opportunity to
cooperate with large enterprises, thus reducing the
possibility of cooperation.
On the knowledge level indicator Knowledge, it is
significantly positively correlated as a covariate and
positively correlated as a homogeneous indicator, but
neither correlation is significant and thus for
hypothesis H3b, H3a cannot be judged. This suggests
that although firms with similar knowledge systems
are more likely to establish knowledge exchanges, the
crossover of knowledge systems in innovation R&D
is less likely to bring more benefits to both parties,
and the choice between benefits and exchange costs
depends on the needs of the firm.
Figure 8: Fitted coefficients for each model.
On the knowledge level indicator, it is
significantly negatively correlated when used as a
covariate and positively correlated when used as a
homogeneous type indicator, thus supporting
hypothesis H3b and rejecting hypothesis H3a, which
indicates that enterprises with similar knowledge
systems are more likely to establish knowledge
exchange, closer knowledge systems in innovation
R&D, and more likely to establish cooperation.
5 CONCLUSIONS
5.1 Main Research Conclusions
Based on the multilayer network perspective, this
study analyzes the trend of network structure
evolution and the evolutionary dynamics of the new
energy vehicle innovation network, and mainly draws
the following conclusions.
5.1.1 In the Process of Innovation Network
Evolution, the Number of Existing
Connection Relationships Is Positively
Correlated with Relationship
Formation
As can be seen in Figure 8, the coefficient on the
edges variable is positive, indicating that the number
of existing relationships is positively correlated with
relationship formation, suggesting a positive
feedback effect on the evolution of cooperative
relationships in network structures.
5.1.2 In the Evolution of Innovation
Networks, Shared Partners Are Not
Conducive to the Formation of New
Relationships
The analysis of the indicators in Figure 8 shows that
the coefficients of degree sharing (gwdsp) and side
sharing (gwesp) are negative and the correlation
between degree sharing and relationship formation is
high, indicating that sharing partners are not
conducive to relationship formation.
5.1.3 In the Process of Innovation Network
Evolution, the Degree of Similarity in
Production Level Is Positively Related
to Partnership, and the Level of
Knowledge Has No Significant Effect
on Relationship Formation.
As can be seen from Figure 8, production capacity
(Output) is negative when used as a covariate, while
it is positive when used as a covariate, indicating that,
the more individuals with similar production levels,
the more conducive to relationship formation. The
level of knowledge, however, is not significant as a
covariate or as a covariate and has no significant
effect on relationship formation.
PMBDA 2021 - International Conference on Public Management and Big Data Analysis
396

5.2 Recommendations
Multiple factors indicate that due to the gap in the
comprehensive capabilities of enterprises and the
control of resources caused by shared partners, strong
and weak enterprises are not conducive to
establishing connections, creating a bifurcation and
uneven distribution of resources in a certain
perspective, thus the state can introduce policies to
promote cooperation among multi-level enterprises
and give certain compensation to lead enterprises to
promote the balanced development of the industry.
5.3 Practical Implications and
Perspectives
This study from the perspective of multi-layer
networks, used the data of the new energy vehicle
industry to construct a three-layer network of
knowledge, innovation, and production. Through
principal component analysis to obtain variables, and
used the ERGM model to determine the influence of
variables on the formation of network relationships.
Due to the long time span of the data used in the
construction of the ERGM model, the different stages
of network formation are not fully used, and the
different evolutionary dynamics can be explored step
by step at a later stage by subdividing the network
formation stages.
ACKNOWLEDGEMENT
This work is supported by the Fundamental Research
Funds for the Central Universities (WUT:
2020VI028), and the National innovation and
entrepreneurship training program for college
students S202110497050 and S202110497061.
REFERENCES
CHROBOT-MASON D, GERBASI A, CULLEN-LESTER
K L (2016). Predicting leadership relationships: the
importance of collective identity. J. The Leadership
Quarterly.
JiGang Zhao, Gang Zeng. (2009). Spatial measurement of
innovation: data and indicators. J. Economic
Geography. 29, 1250-1255.
Lan Jian Liu, Meng Zhang, TianHang Huang. (2021). The
impact of government subsidies and tax incentives on
patent quality and their threshold effects--an empirical
analysis based on listed companies in the new energy
automobile industry. J. Scientific Research
Managemen. 42, 9-16.
Lee D. (2016). The Changing Structures of Co-invention
Networks in American Urban Areas. J. Procedia
Computer Science. 96, 1075-1085.
PingNan Ruan, LiWen Wang. (2018). A study on the
evolutionary dynamics of technological innovation
networks based on multidimensional proximity - taking
the OLED industry as an example, J. Research and
Development Management. 6, 59-66.
Xia Cao, ChuanYun Li, ChaoRan Lin. (2019). Research on
the evolution of patent cooperation networks based on
new energy vehicles[J]. Scientific Research
Management. 8, 179-188.
Xiaoyan Liu, Jing Wang. (2020). Research on the
evolutionary dynamics of technological innovation
networks based on TERGMs. J. Research Management.
4,171-181.
XiuRui Xu, ShanWu Tian, JunPeng Wang. (2020).
Analysis of the evolution of global new energy vehicle
technology innovation cooperation network. J.
Industrial Technology and Economics. 10, 65-73.
YongHong Jin, Yuan Liao, YuQin Xi. (2020). Venture
Capital Network Location, Investment Specialization
and Corporate Innovation. J. China Science and
Technology Forum. 2, 39-50.
Analysis of ERGM Evolutionary Dynamics from a Multi-layer Network Perspective: Based on New Energy Vehicle Industry Data
397
