
Research on Risk Assessment and Intervention Methods of Freight
Vehicle Traffic Safety via Data Analysis
Bowen Wang
1
, Jingsheng Wang
1,*
, Tianyu Xia
2
and Dandan Ding
2
1
School of Traffic Management, People's Public Security University of China, Beijing, China
2
School of Information Technology and Network Security, People's Public Security University of China, Beijing, China
Keywords: Traffic Safety; Freight Vehicles; Vehicle Factors.
Abstract: In order to deeply explore the traffic safety risks of freight vehicles, the data of freight vehicles in Ningxia
Autonomous Region is taken as an example. Through the analysis of the driver's traffic behavior and the
condition of the freight vehicle, the XGBOOST model is established to help the relevant departments
reasonably understand the driver's traffic safety risks. The analysis results show that the classification
accuracy of the XGBOOST model is 86%, and the fitting effect is good. In an analysis of driver traffic
behavior, drivers were more likely to cause more serious fatal accidents when they misused their turn signals
and lights. Using the wrong turn signal is 1% more likely to result in a fatal accident than using the right turn
signal. In the analysis of vehicle conditions, the legal and safety conditions of trucks in Ningxia Autonomous
Region are not good, and the vehicles have potential safety hazards. Relevant departments should strengthen
safety issues such as scrapped vehicles, irregular inspections, poor lighting, poor braking, and faulty signaling
devices.
1 INTRODUCTION
Heavy trucks have the characteristics of large
transportation volume, extensive management, lack
of monitoring channels, unfixed transportation
routes, and high mobility of vehicles (Park 2019). In
the process of driving heavy freight vehicles, due to
their own factors such as large body size, frequent
overloading, speeding, and weak safety awareness of
some drivers, they are very easy to cause heavy and
very serious traffic accidents, which directly affect
the property interests and safety of the people
(McDonald 2019). According to statistics from the
Traffic Management Bureau of the Ministry of Public
Security, the current domestic truck ownership
accounts for about 8% of the motor vehicle
population, and the death toll from truck accidents
accounts for about 30% of the total accident deaths.
The truck accident rate per 10,000 vehicles is higher
than the national traffic accident rate per 10,000
vehicles. More than twice as high, the frequency and
severity of truck accidents are significantly higher
than other motor vehicles, and road transportation
safety is very severe. Frequent traffic accidents of
freight vehicles have brought huge challenges to the
supervision of freight traffic safety (Muratori 2017,
Ruesch 2016, Wang 2021, Wang 2021). People are
increasingly realizing that it is urgent to prevent and
reduce freight vehicle traffic accidents and implement
road traffic safety management scientifically and
effectively (Taylor 2019, Wang 2021, Wang 2021).
Therefore, in order to dig deeper into the traffic
safety risks of freight vehicles, take the data of freight
vehicles in Ningxia Autonomous Region as
examples, analyze the traffic behaviors of drivers and
the status of freight vehicles to help relevant
departments rationally understand the traffic safety
risks of drivers.
2 ANALYSIS OF ILLEGAL DATA
ON FREIGHT VEHICLES
2.1 Data Source and Preprocessing
Page Setup
The two data sets studied in this paper come from the
databases of the public security traffic management
departments of Ningxia Autonomous Region. First,
the acquired data is preprocessed. In this article,
Wang, B., Wang, J., Xia, T. and Ding, D.
Research on Risk Assessment and Intervention Methods of Freight Vehicle Traffic Safety via Data Analysis.
DOI: 10.5220/0011345700003437
In Proceedings of the 1st International Conference on Public Management and Big Data Analysis (PMBDA 2021), pages 373-378
ISBN: 978-989-758-589-0
Copyright
c
2022 by SCITEPRESS – Science and Technology Publications, Lda. All rights reserved
373
duplicate samples and samples with more vacancies
are deleted.
2.2 Data Analysis
2.2.1 Irregular Use of Turn Signals
Vehicles, especially trucks with a large volume and
carrying capacity, are more likely to cause traffic
accidents when turning, changing lanes, U-turning,
overtaking, sudden braking, sudden start and other
special behaviors than when driving in a straight line.
As one of the traffic signals, the normal use of the
vehicle turn signal can remind other road users that
the vehicle is about to turn, change lanes, and turn
around, so that other road users can take measures
such as slowing down and avoiding in advance to
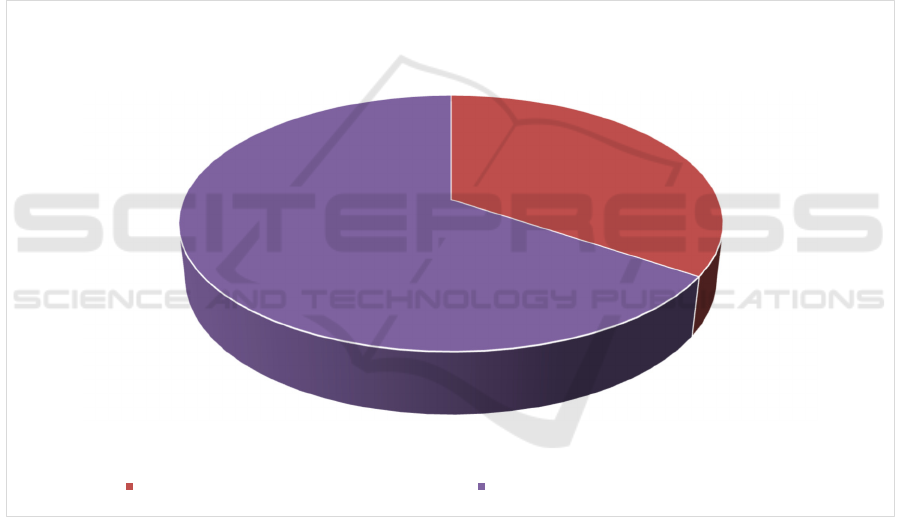
reduce traffic accidents. Taking the Ningxia
Autonomous Region as an example, the result of
analyzing the use of the turn signal of the accident
vehicle is shown in fig.1. There were a total of 305
truck traffic accidents, of which 200 were accidents
with the correct use of vehicle steering lights,
accounting for 66% of the total number of accidents.
There were 105 accidents with incorrect use of turn
signals, accounting for 34% of the total number of
accidents. In accidents with incorrect use of turn
signals, there are situations such as turning on the left
turn signal when the vehicle is going straight, and
double flashing when turning left and right. The
wrong signal is transmitted to other traffic
participants, which is a hidden danger to the
occurrence of traffic accidents.
Figure 1: The use of vehicle turn signal.
Further analysis of the use of the turn signal of the
accident vehicle, the distribution of accidents
corresponding to the correct and wrong use of the turn
signal is shown in fig.2 and fig.3 respectively. In the
data of accident vehicles, there were 97 fatal
accidents out of 200 accidents when the turn signal
was used correctly, accounting for 49% of the total
number of accidents when the turn signal was used
correctly. When the turn signal is used incorrectly,
there are 53 fatal accidents in 105 accidents,
accounting for 50% of the total number of accidents
when the turn signal is used incorrectly. The use of
the wrong turn signal is 1% higher than the
probability of a fatal accident when the turn signal is
used correctly.
34%
66%
Vehicle turn signal usage
Wrong use of vehicle turn signal Correct use of vehicle turn signal
PMBDA 2021 - International Conference on Public Management and Big Data Analysis
374
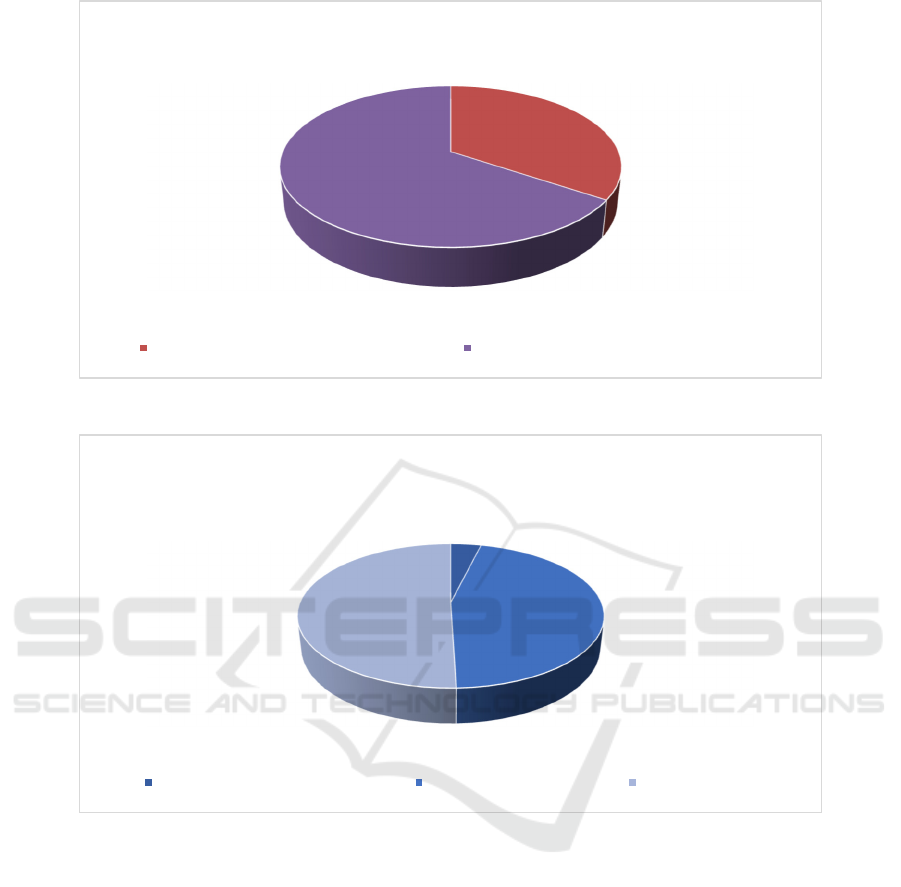
Figure 2: Distribution of accident types when vehicle turn signals are used correctly.
Figure 3: Distribution of accident types when vehicle turn signals are used incorrectly.
2.2.2 Irregular Use of Lighting
The use of low-beam, high-beam, and position lights
of vehicles can provide lighting and reminders for
vehicles under poor road lighting conditions, meeting
vehicles, etc., but the vehicle's low-beam, high-beam,
and position lights are wrong The use will not only
produce poor lighting effects for the driver, but also
its adverse effects on other road traffic users is also
one of the factors leading to traffic accidents. Take
Ningxia Autonomous Region as an example to
analyze the lighting usage of the truck in the accident,
and the result is shown in fig.4. There were a total of
305 truck accidents, of which 215 were accidents with
correct vehicle lighting, accounting for 70% of the
total number of accidents. There were 90 accidents
involving incorrect use of lighting, accounting for
30% of the total number of accidents. In the accidents
of incorrect use of lighting, there are situations in
which vehicles use high beams illegally when there
are street lights at night, and do not use lights when
there are no street lights at night. Wrong use of high
beam headlights can cause instant blindness to the
opposing driver. Do not use lights under poor lighting
conditions, which are all hidden dangers that lead to
traffic accidents.
34%
66%
Vehicle turn signal usage
Wrong use of vehicle turn signal Correct use of vehicle turn signal
4%
46%
50%
Type distribution of accidents when vehicle turn signals are used
incorrectly
Property damage accident Wounding accident Fatal accident
Research on Risk Assessment and Intervention Methods of Freight Vehicle Traffic Safety via Data Analysis
375
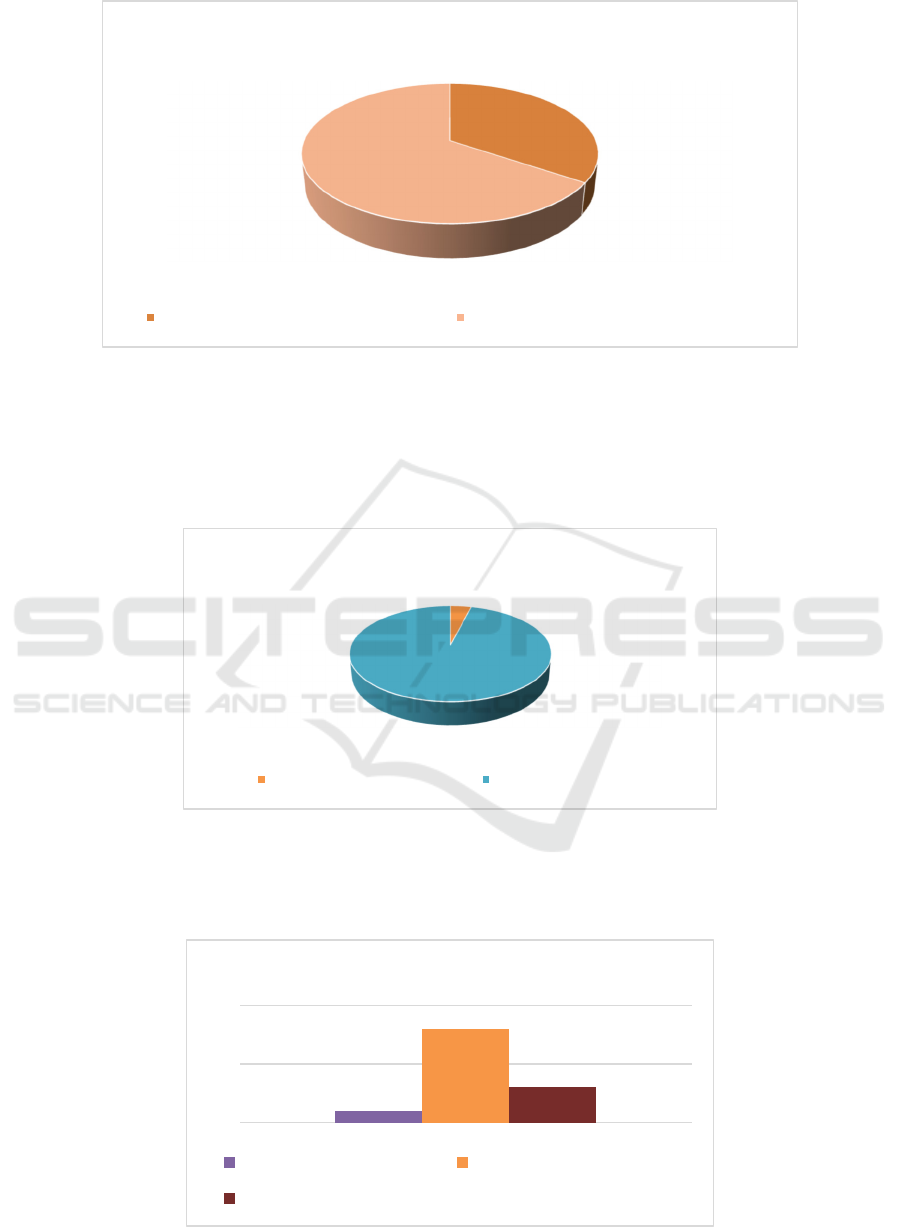
Figure 4: Use of vehicle lighting.
2.3 Vehicle Status
Taking Ningxia Autonomous Region as an example,
the result of the analysis of the legal status of the
accident vehicle is shown in fig.5. There were 305
truck accidents, of which 293 were accidents with
vehicles in a legal status, accounting for 96% of the
total number of accidents. There were 12 accidents in
which vehicles were illegal, accounting for 4% of the
total number of accidents.
Figure 5: Analysis of the legal status of vehicles.
Further analysis of the illegal status of the vehicle,
the illegal status of the vehicle is shown in fig.6.
Among the 12 accidents where vehicles were illegal,
1 vehicle was scrapped, 3 vehicles were not inspected
on time, and 8 vehicles were other reasons.
Figure 6: Analysis of illegal conditions in vehicles.
34%
66%
Vehicle turn signal usage
Wrong use of vehicle turn signal Correct use of vehicle turn signal
4%
96%
Legal status of the vehicle
Abnormal condition Normal condition
1
8
3
0
5
10
Illegal condition of the vehicle
Scrapped Other reasons
Unscheduled inspection
PMBDA 2021 - International Conference on Public Management and Big Data Analysis
376
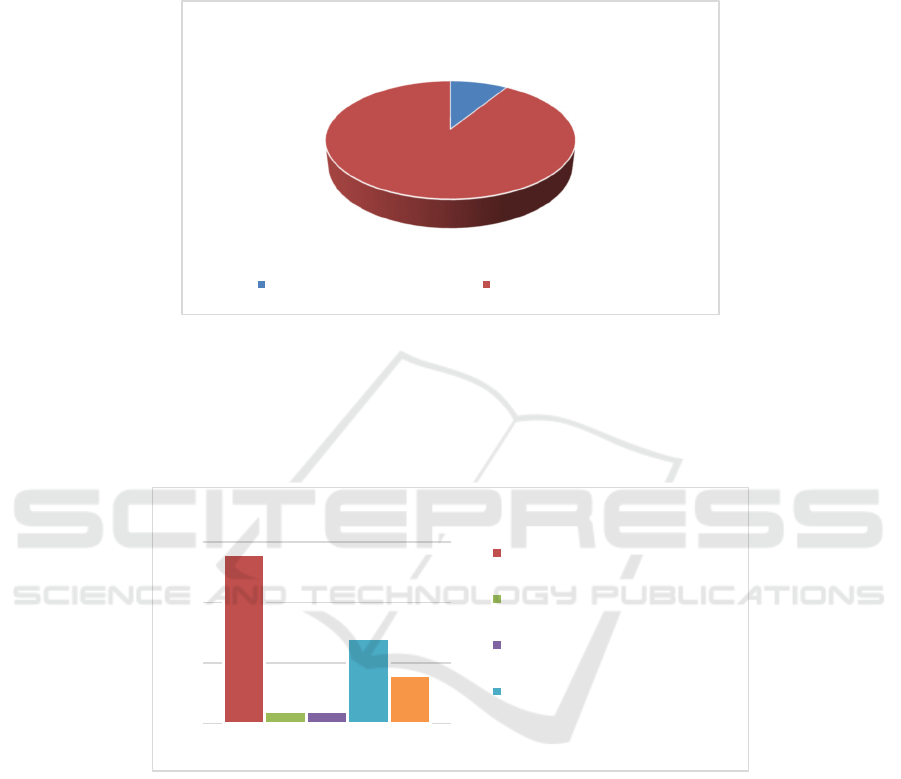
The results of the analysis of the safety status of
accident vehicles in Ningxia Autonomous Region are
shown in fig.7. There were 305 truck traffic accidents,
of which 278 accidents were in a legal state,
accounting for 91% of the total number of accidents.
There were 27 accidents in which vehicles were
illegal, accounting for 9% of the total number of
accidents.
Figure 7: Analysis of the legal status of vehicles.
Further analysis of the unsafe condition of the
vehicle, the unsafe condition of the vehicle is shown
in fig.8. Among the 27 accidents in which vehicles
were in unsafe conditions, one was due to leakage of
oil/liquid/gas from the vehicle, one was due to failure
of vehicle lighting and signaling devices, and 11 were
due to poor vehicle braking or failure.
Figure 8: Analysis of illegal conditions in vehicles.
2.4 Model Establishment
Using Python, using Jupyter lab as a tool, call the
XGBClassifier function of the xgboost package to
build the XGBOOST model. All parameters use
default values.
The accident type is used as the label, and the
value types are: property damage accident and
casualty accident. The legal status of the vehicle, the
safety status of the vehicle, the usage of turn signals,
lighting conditions and other factors are input into the
model as features.
It is concluded that the classification accuracy of
the model on the test set reaches 86%. The model has
excellent fitting effect and can be used to identify the
severity of traffic accidents
3 CONCLUSION
This article is to dig deeper into the traffic safety risks
of freight vehicles. Taking the freight vehicle data of
Ningxia Autonomous Region as an example, the
following conclusions can be drawn by analyzing the
9%
91%
The safety of the vehicle
Abnormal condition Normal condition
14
11
7
4
0
5
10
15
Unsafe conditions in the vehicle
Other reasons
Leaking oil/liquid/gas
Failure of lighting and
signaling devices
Poor braking
Research on Risk Assessment and Intervention Methods of Freight Vehicle Traffic Safety via Data Analysis
377

traffic behavior of drivers and the status of freight
vehicles:
(1) In the driver's analysis of traffic behavior, it is
more likely to cause more serious fatal accidents
when the driver misuses the turn signal and lighting.
(2) In the analysis of the vehicle status, the legal
status and safety status of trucks in Ningxia
Autonomous Region are not good, and there are
hidden safety hazards in the vehicles. The relevant
departments need to strengthen the disposal of
vehicles, unscheduled inspections, poor lighting, poor
braking, and signaling devices.
(3) The classification accuracy of the XGBOOST
model on the test set reaches 86%. The model has
excellent fitting effect and can be used to identify the
severity of traffic accidents
REFERENCES
McDonald N., Yuan Q., Naumann R. (2019). Urban freight
and road safety in the era of e-commerce. J. Traffic
injury prevention,20(7): 764-770.
Muratori M., Holden J., Lammert M., et al. (2017).
Potentials for platooning in US highway freight
transport. National Renewable Energy Lab, Golden,
CO (United States).
Park, J., Abdel-Aty, M., Wang, L., et al. (2019). Influence
of multiple freeway design features on freight traffic
safety. J. Journal of Advanced Transportation, 2019.
Ruesch M., Schmid T., Bohne S., et al. (2016). Freight
transport with vans: Developments and measures. J.
Transportation Research Procedia, 12: 79-92.
Taylor, S. G., Russo, B. J., James, E., (2018). A comparative
analysis of factors affecting the frequency and severity
of freight-involved and non-freight crashes on a major
freight corridor freeway. J. Transportation research
record, 2672(34): 49-62.
Wang B., Wang J., Zhu Y.,et al. (2021). Research on Short-
term Traffic Flow Prediction Model Based on ARMA-
SVR. J. Journal of Highway and Transportation
Research and Development,2021,38(11):126-133.
Wang B., Wang J., Wang B., et al. 2021. Research on
Quantitative Method of Traffic Safety Credit Score
Based on Ridge-Logistic Regressio. International
Conference on Man-Machine-Environment System
Engineering. Springer, Singapore: 746-752.
Wang B., Wang J., Zhang Z., et al. 2021. Traffic Flow
Prediction Model Based on Deep Learning.
International Conference on Man-Machine-
Environment System Engineering. Springer, Singapore:
739-745.
Wang, B., Wang, J., Zhu, Y., et al. ,Analysis of Driver
Causative Factor Tendency Based on K -means ++. J.
Science Technology and Engineering, 2021,21(36):
15695-15699.
PMBDA 2021 - International Conference on Public Management and Big Data Analysis
378
