
Research on Spatial Epidemic Dynamics Modelling of COVID-19
Outbreak: Take Nanjing as an Example
Peining Wang
1,*
, Yiyang Li
2
and Zihan Pan
3
1
Department of Mathematical, Physical and Computational Science, University of Reading,
Reading, Berkshire, RG6 6GH, U.K.
2
Department of Statistics, Mathematics and Statistics, University of Warwick,
Coventry, West Midlands, CV4 7AL, U.K.
3
Department of Mathematics, University of Texas at Arlington,
Arlington, U.S.A.
Keywords: Covid-19, Spatial Model, Spatial Analysis, Commute Rate.
Abstract: On 20 July 2021, Nanjing Lukou International Airport in JiangNing District, Nanjing, Jiangsu Province,
China, reported six positive test results samples taken by airport staff. By 25 August, there were 235 COVID-
19 cases confirmed in Nanjing and 596 cases in Yangzhou. Inspired by the models in Keeling and Rohani in
2002, we have built a model which introduced the commute parameters and commute sub-populations to
simulate the spatial spread of the virus, including analyzed Nanjing and Yangzhou separately and combined
the other two cities into consideration. We have discussed about two main situations about our spatial model,
one about the isolated two cities Nanjing and Yangzhou interplay with the same R
0
or separated R
0
, another
about several cities in consideration interaction with their respective different R
0
.
1 INTRODUCTION
It has been one and a half years since the COVID-19
pandemic outbreak began in Wuhan, Hubei Province,
China, in December 2019. The COVID-19 pandemic
main strain has evolved from the original SARS-
CoV-2 to more transmissible and resistant strains. On
20 July 2021, Nanjing Lukou International Airport in
JiangNing District, Nanjing, Jiangsu Province,
China, reported six positive rRT-PCR (hereafter
referred to PCR) test results in routine PCR test
samples taken by airport staff. 21 July 2021, the
government in Nanjing city (hereafter called
Nanjing) began centralized isolation and sampling of
airport-related personnel and areas. Also, the same
day at 8 am, the analysis of PCR test samples at the
airport was completed. Nanjing reported seven new
locally confirmed cases of novel coronavirus
infection and two new asymptomatic infections in
Nanjing.
Moreover, seven days later, on 28, July Yangzhou
city, Jiangsu Province, China (hereafter referred to
Yangzhou) reported two new locally confirmed cases
of COVID-19 linked to Nanjing this round outbreak.
By sequencing the strains genes of the current
outbreak in Nanjing, this round of epidemic situation
is confirmed to be caused by the Delta variant strain
(also known as lineage B.1.617.2), which was first
detected in India in October 2020. By 25 August,
there were 235 COVID-19 cases confirmed in
Nanjing and 596 cases in Yangzhou; this outbreak in
Yangzhou is 253.61% of the total in Nanjing.
In response to the latest outbreak caused by the
mutant Delta variant, Nanjing and Yangzhou both
have adopted district-level isolation and nucleic acid
testing for all members. This study investigated the
spatial epidemic dynamics of the COVID-19 virus
between Nanjing and Yangzhou so far. Also, the
spatial association of daily new cases in Nanjing and
Yangzhou was measured and compared. The
hypothesis of a spatial association of the epidemic
between the two cities was considered based on the
possibility of population movement between the two
cities and different transmission routes.
Wang, P., Li, Y. and Pan, Z.
Research on Spatial Epidemic Dynamics Modelling of COVID-19 Outbreak: Take Nanjing as an Example.
DOI: 10.5220/0011344100003437
In Proceedings of the 1st International Conference on Public Management and Big Data Analysis (PMBDA 2021), pages 335-341
ISBN: 978-989-758-589-0
Copyright
c
2022 by SCITEPRESS – Science and Technology Publications, Lda. All rights reserved
335

2 ANALYSIS
2.1 Data Sources
All the datasets of COVID-19 virus infection are
collected from the official website of the National
Health Commission of the People’s Republic of
China (National Health Commission of the People’s
of China, 2021). The website updates the latest
infection situation, epidemic analysis, and
prevention strategies. This study uses the data of 5
cities located in Jiangsu Province and 45 days of
epidemic infection situation, in which the specific
data source is obtained from the statistics bureau of
each corresponding city, including the demographic
data. All the real-time dynamic population
movement data as the parameters e
ij
and r
ij
mentioned below are analyzed and discussed on the
basis of the Baidu Qianxi data source (Baidu-qianxi,
2021).
2.2 Materials for Modelling
For how the virus spread from the population living
in Nanjing to the population living in Yangzhou, we
built a model to stimulate the epidemiological
situation, which helps us estimate the cases in reality.
In various examples, people calculated the commute
cases would ignore the permanent relocation from
one population to another because it may not
generate a considerable influence as a significant
epidemiological force, especially in a short-term
case. Instead, the virus which spread by the
commuters of two locations should be considered
seriously.
2.2.1 Isolated-Cites Related Model
We now consider that the commuters live in Nanjing
but occasionally travel to Yangzhou in this case.
Inspired by the models in (Keeling, 2002) and (Das,
2020), We set S
yn
, I
yn
, and N
yn
as the number of
susceptibles, infections, and total hosts in Nanjing
but currently located in Yangzhou.
Here we only use the standard SIR models as
basics and expand the demographic and spatial
parameters:
=ν
−β
S
−β
S
−e
S
+r
S
−
μ
S
(1)
=ν
−β
S
−β
S
+e
S
−r
S
−
μ
S
(2)
=ν
−β
S
−β
S
−e
S
+
r
S
−μ
S
(3)
=ν
−β
S
−β
S
+e
S
−
r
S
−μ
S
(4)
=ν
+β
S
+β
S
−γ
I
−e
I
+
r
I
−μ
I
(5)
=ν
+β
S
+β
S
−γ
I
+e
I
−
r
I
−μ
I
(6)
=ν
+β
S
+β
S
−γ
I
−e
I
+
r
I
−μ
I
(7)
=ν
+β
S
+β
S
−γ
I
+e
I
−
r
I
−μ
I
(8)
=ν
−e
N
+r
N
−μ
N
(9)
=ν
+e
N
−r
N
−μ
N
(10)
=ν
−e
N
+r
N
−μ
N
(11)
=ν
+e
N
−r
N
−μ
N
(12)
Where e
yn
represents the rate of commuters
located in Yangzhou currently but come from
Nanjing, and r
yn
represents the reverse commuters.
The demographic parameters
ν
yn
and μ
yn
measure
the natality of individuals in Yangzhou but born in
Nanjing and the mortality of the individuals who
travel to Yangzhou from Nanjing. Other epidemic
parameters were all depend on the people’s commute
directions.
We separated the population we would discuss
into four sub-populations, people currently live in
Yangzhou and also located in Yangzhou. People live
in Yangzhou but currently locate in Nanjing, people
live in Nanjing and currently located in Nanjing.
People live in Nanjing but are currently located in
Yangzhou (as the yy, yn, nn, ny in the equations,
respectively). Each sub-population group has its
susceptibles, infections, and recovered groups.
Among the four sub-populations, the two parts of the
population currently located in a different city from
their hometown represent the commute sections that
cause the direct transmission of the virus in these two
cities.
Also, we leave out the recovered groups and their
corresponding equations in the above differential
equations because this section has an independent
system that would not impact the final result. Instead,
we gave the region population equations as N
yy
, N
yn
,
N
nn
, and N
ny
to illustrate the changing rate of
population movement between Nanjing and
PMBDA 2021 - International Conference on Public Management and Big Data Analysis
336

Yangzhou these four sub-population, which help us
analyze such impacts in isolation.
2.2.2 Commuter Approximations
The differential equations we showed above provide
an integrated description of the disease behavior and
its spreading pattern. However, in some expanded
situations with multiple areas related to the central
city, a significant number of equations needed to be
considered (details in Section Multiple-cites related
model). Thus, we simplified the equations by
assuming that all commuters have a fast movement.
Under this assumption, the force of the infection of
population Nanjing can be written as:
λ
=β
[(1 − ρ)I
+ρI
] (13)
where the coupling parameter, ρ, can be defined as:
ρ=2q(1−q) (14)
where q represents the proportion of time which
individuals spend away from their home population,
q=
(
)
=
(
)
(15)
Among two main injected cities Nanjing and
Yangzhou, a pathogen transfer occurs when either the
susceptibles of one of these two populations or
infections of another move, which gives us the
equation of ρ from above. The maximum
transmission of infections emerges when individuals
spend equal amounts of time in both their home sub-
population and away sub-populations as q = 1/2.
2.2.3 Multiple-cites Related Model
In most realistic scenarios, we can not only consider
the influences between two areas, and there can be
several or dozens of cities impacted by the region
where the epidemic outbreak. As the example of the
outbreak of the COVID-19 virus in Nanjing,
Yangzhou is not the only city that suffered a
significant loss in economics and social
environment, so in our model, we add a multiple
regions equation pattern, which should give
complete consideration to the situation for both the
outbreak city and impacted cities. The index variable
i represents the sub-population of the outbreak city,
and j represents the sub-population in other impacted
cities:
=ν
−β
S
−β
S
−e
S
+r
S
−μ
S
(16)
=ν
−β
S
−β
S
+e
S
−r
S
−μ
S
(17)
=ν
−β
S
∑
∑
−β
S
−
∑
e
S
+
∑
r
S
−
μ
S
(18)
=ν
−β
S
−β
S
∑
∑
−β
S
+
e
S
−r
S
−μ
S
(19)
=ν
+β
S
+β
S
−γ
I
−e
I
+r
I
−
μ
I
(20)
=ν
+β
S
+β
S
−γ
I
+e
I
−r
I
−
μ
I
(21)
=ν
+β
S
∑
∑
+β
S
−γ
I
−
∑
e
I
+
∑
r
I
−μ
I
(22)
=ν
+β
S
+β
S
∑
∑
+β
S
−
γ
I
+e
I
−r
I
−μ
I
(23)
=ν
−e
N
+r
N
−μ
N
(24)
=ν
+e
N
−r
N
−μ
N
(25)
=ν
−
∑
e
N
+
∑
r
N
−μ
N
(26)
=ν
+e
N
−r
N
−μ
N
(27)
Where n = 1, 2, 3, …, x-1, x+1, …, n. and so j
n
=
j
1
, j
2
, j
3
, …, j
x
-1
, j
x
+1
, …, j
n
.
So we now obtain a new differential equation
corresponding a one-multiple areas epidemic
situations, where we have assumed the frequency of
dependent transmission, as it is standard for human
diseases. The pattern
∑
𝑿
𝒊𝒋𝒋
giving the number of
summation of the individuals in group X
(susceptibles, infected or total population) from
outbreak region population j but currently located in
spread region population i, and similarly,
∑
𝑿
𝒊𝒋
𝒏
𝒋
𝒏
represent the total number of individuals in
the group of X from original outbreak city but now
locate in surrounding cities j
n
which are exclusive of
the designated city j
x
.
The total equations have the same pattern as the
isolated cities related model mentioned above,
considering the multiple cities’ mutual influences. It
allows us to measure the situation with simulation in
a higher degree of accuracy as we can consider the
transmission of pathogen in the primary outbreak city
with all sub-population that come from different
cities blended.
3 DISCUSSION
In the early stage of this new outbreak of the COVID-
19 virus in Nanjing, Jiangsu Province, the first three
infected persons were diagnosed on 20 July in Lukou
International Airport station. Then, the pathogen
spread to the center area of Nanjing with extremely
Research on Spatial Epidemic Dynamics Modelling of COVID-19 Outbreak: Take Nanjing as an Example
337
high transmission speed, which caused more than a
hundred people to be infected in just a week.
Moreover, on the second day of the government of
Jiangsu Province announced that there were 100
persons had been infected by the new variant,
Yangzhou
’s public health authorities detected the
first infected individuals who were assuredly
traveled from Nanjing. Also, on the same day,
Yangzhou had diagnosed two infected people. After
that, the virus spread faster than expected. The
number of infections in Yangzhou surpassed the
counterpart in Nanjing in 6 days and exceeded 300
after another day.
Although the government of Yangzhou had token
emergency measures immediately after the first virus
carrier was discovered, the explosive growth of
infected people still caused severe damage to
Yangzhou. In these cases, we are going to stimulate
the spread situation without any artificial
intervention.
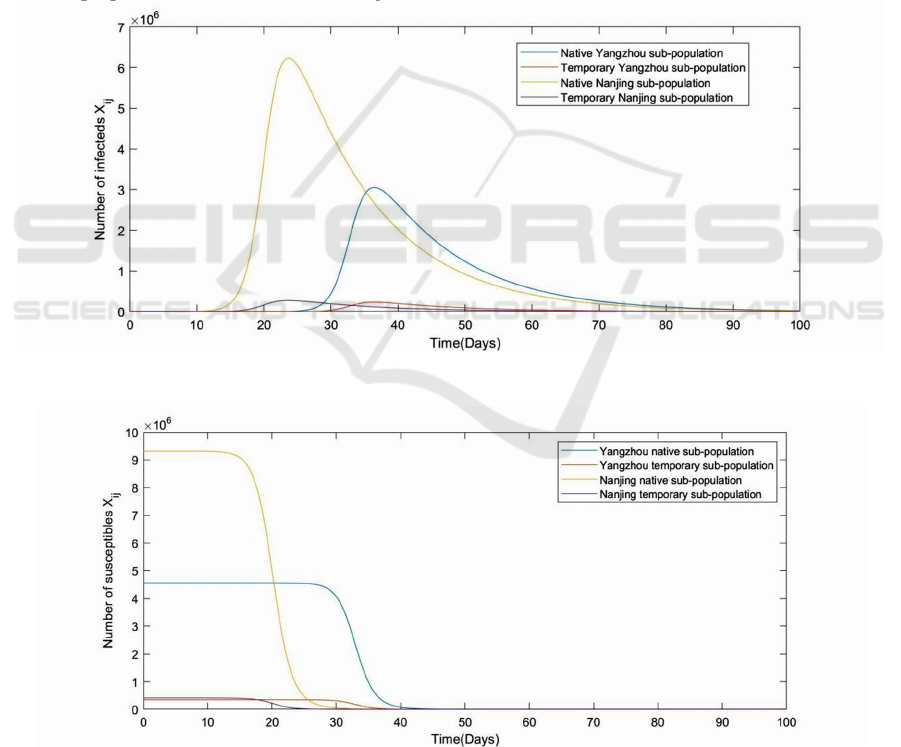
3.1 Isolated-cities Related Estimate
Figure 1 and Figure 2 show the number of infections
and susceptibles in the outbreak city Nanjing and the
impacted city Yangzhou within a hundred days, the
data of total population in Nanjing (Nanjing Bureau
of Statistics, 2021) and Yangzhou (Yangzhou
People’s Government, 2021) was collected from the
seventh national census of China in May 2020, and
the parameters related to the epidemic outbreak were
determined by setting the R
0
= 5 for all location and
sub-population.
Figure 1. The change of number of infections in Nanjing and Yangzhou with same R
0
.
Figure 2. The change of number of susceptibles in Nanjing and Yangzhou with same R
0
.
However, the primary reproduction number of the
COVID-19 virus in Jiangsu was not the same
anywhere. Cause it was associated with medical and
social resources like hospital in-patient condition,
PMBDA 2021 - International Conference on Public Management and Big Data Analysis
338
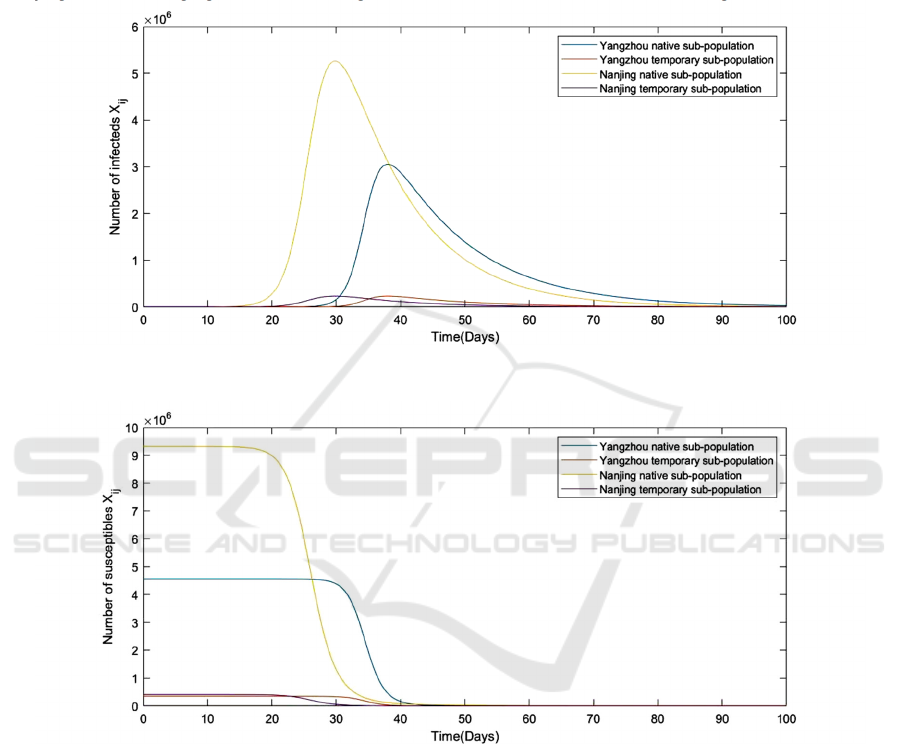
service facilities, medical equipment, population
base, and government executive ability. Nanjing is
the capital of the Jiangsu Province, so we have reason
to believe that all these living environments and
facilities in Nanjing are better than the counterpart in
Yangzhou, so we reduce the value of R
0
to 3.3 in
Nanjing without changing the value of Yangzhou’s.
As shown in Figure 3 and Figure 4, the number of
infected individuals decreased for all sub-population
after we changed R
0
, since the average R
0
for both
two regions decreased, the proportions of infections
for both Nanjing and Yangzhou were getting smaller,
and falling rates of the number of the susceptibles in
these two cities were becoming flat also.
Figure 3. The change of number of infections in Nanjing and Yangzhou with separated R
0
.
Figure 4. The change of number of susceptibles in Nanjing and Yangzhou with separated R
0
.
3.2 Multiple-cities Related Estimate
In the epidemic outbreak at Nanjing, Jiangsu, in July,
the virus not merely attack Yangzhou, it still spread
to other cities in Jiangsu Province, there are dozens
of cities like Suqian, Huaian, Suzhou, Xuzhou, Wuxi,
Changzhou, etc., were impacted by the pathogen that
first discovered in Nanjing. The spread of the new
variant type of COVID-19 virus is complicated and
changeable, especially in spatial spread modeling.
We need to be more careful in consideration of
several cities
’interaction effects.
Figure 5 and Figure 6 showed that the numbers of
infections and susceptibles in these four cities,
Nanjing, Yangzhou, Suqian, and Huaian, in 120 days
and 100 days, respectively. We added the other two
cities Suqian (Suqian Municipal Bureau of Statistics,
2021) and Huaian, into consideration based on
original unchanged conditions, with ten original
cases in the native Nanjing sub-population. All the
commuters from the other three cities were assumed
to have freedom of movement or actions in Nanjing.
Research on Spatial Epidemic Dynamics Modelling of COVID-19 Outbreak: Take Nanjing as an Example
339
Figure 5. The change of number of infections in four cities.
Figure 6. The change of number of susceptibles in four cities.
As we see in the Figures above, Nanjing was
going through a significant epidemic, which is the
source of initial infection from 10 cases in LuKou
International Airport. Its number of infections
peaked the headmost and experienced the most
severe epidemic due to its hosts having the most
significant population in Jiangsu. Moreover, for the
other objects in the graph: Yangzhou, which is the
second large city except for Nanjing in the chosen
four cities, has reached its peak just next to
Nanjing’s, the population size is similar to other
impacted cities. Since Yangzhou is the closest city to
the origin city, the commuting rates between Nanjing
and Yangzhou are higher, which might be caused that
Yangzhou is the earliest outbreak of the infection city
among the others. Suqian and Huaian have a similar
population and city size (Suqian Municipal Bureau
of Statistics, 2021), which causes a mirrored image
in the graph. Moreover, two sub-populations in the
same region have a similar trend or are said
differently. Their corresponding curves have the
same sign of their first differential coefficients.
4 CONCLUSION
We ensure now that this new variant virus of
COVID-19 is spread to China from other countries
and the Delta strain (B.1.617.2) has a transmission
rate 1.4 times that of the original SARS-COV-2
strain. The commutative number of infections in
Jiangsu Province has reached 500 in less than 20
days, and at peak in less than 30 days.
PMBDA 2021 - International Conference on Public Management and Big Data Analysis
340
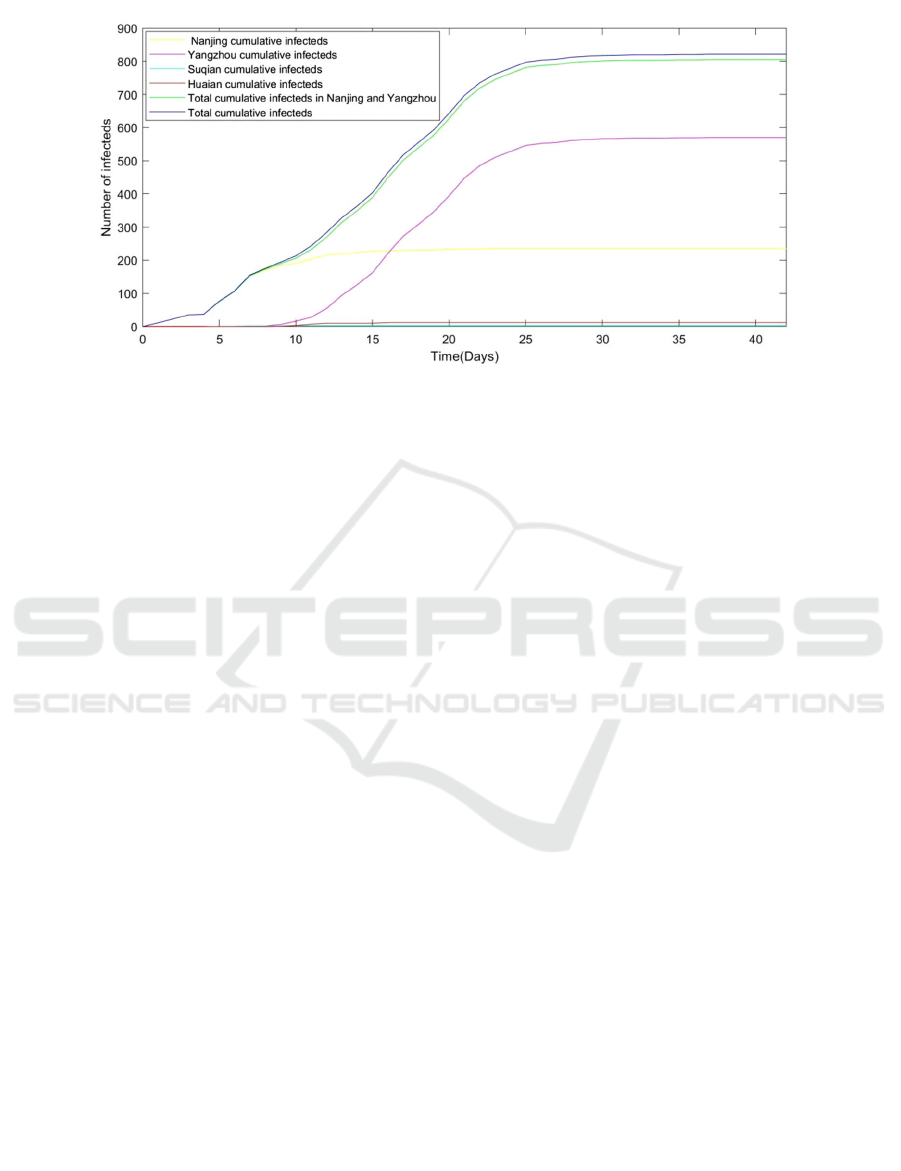
Figure 7. The change of cumulative number of infections in Jiangsu Province in 45 days.
This study shows the spatial spread of the
epidemic the public health policy's advantage in
controlling the predicting outbreak of the epidemic
in Nanjing, Yangzhou, and whole Jiangsu Province,
as we see in the model which gave the consequence
that the virus was spread without any precautionary
measure like quarantine policies and medical
treatment, millions of people would be infected.
However, the virus population would become extinct
in about 200 days in simulations, the damage it
would cause we can never imagine.
The primary defect of our modelling research is
that in an ideal modeling spread environment, our
model only considers the commute associativity
between the original outbreak city and surrounding
impacted cities but not the cross-infection among the
surrounding cities themselves. Such a situation may
result in a neglected extreme spread tendency,
happening among the urban agglomerations.
REFERENCES
Baidu-qianxi. Baidu-dituhuiyan [DB/OL]. [20210924].
https://qianxi.baidu.com/.
Bulletin of the seventh National census of Yangzhou.
Yangzhou People's Government. Retrieved July 19,
2021, from http://www.yangzhou.gov.cn/yzszxxgk/tjj
/202107/4c6d8f05c4a14a64a1b4038757e0dbcb.shtml.
Das Arghya et al. “Covid-19: an analysis of an extended
SEIR model and a comparison of different intervention
strategies.” arXiv: Populations and Evolution (2020):
n. pag.
Keeling M. J., & Rohani P. (2008). 7.2 Metapopulations.
In Modeling infectious diseases in humans and
animals (pp. 237-252). essay, Princeton University.
Nanjing 7th National census bulletin. Nanjing Bureau Of
Statistics. Retrieved May 24, 2021, from
http://tjj.nanjing.gov.cn/bmfw/njsj/202105/t20210524
_2945571.html.
Up-dates of the COVID-19 epidemic. National Health
Commission of the People's Republic of China. (n.d.).
Retrieved July 20, 2021, from http://en.nhc.gov.cn/.
Suqian 7th National census bulletin. Suqian Municipal
Bureau of Statistics. Retrieved May 25, 2021, from
http://tjj.suqian.gov.cn/.
Shang J., Wan Y., Luo C., Ye G., Geng Q., Auerbach A., &
Li F. (2020, May 26). Cell entry mechanisms of SARS-
COV-2. Proceedings of the National Academy of
Sciences of the United States of America. Retrieved
October 15, 2021, from
https://www.ncbi.nlm.nih.gov/pmc/articles/PMC7260
975/.
Research on Spatial Epidemic Dynamics Modelling of COVID-19 Outbreak: Take Nanjing as an Example
341
