
Research on the Influence of Industry Index on Individual Stock
Price in Neural Network Prediction Model
Yajiao Wang
1a
, Bo Zheng
2b
, Xiangqi Meng
3c
and Jizhe Cui
1d
1
College of Economics and Management, Yanbian University,Hun chun, Jilin, China
2
Institute of Finance, Jilin University of Finance and Economics,Changchun, Jilin, China
3
International Economics and Trade, Shanghai Lixin College of Accounting and Finance, Shanghai, Shanghai, China
Keywords: Neural Network, Stock Forecast, Industry Index, Kweichow Moutai.
Abstract: With the development of the economy and society, it is increasingly clear that stock price changes are running
ahead of economic changes, and there is no shortage of predictions. Based on the neural network prediction
model to screen and clean the actual stock price data and establish a model to predict the impact of industry
indicators on the single stock price, this paper predicts the stock price and its stock price trend of Kweichow
Moutai through BP neural network and explores whether the rise and fall index of the industry index added
to the wine, beverage and refined tea manufacturing industry has a positive effect on the model prediction.
When the price of a single stock is added to the daily rise and fall index of the industry to which the stock
belongs, it can greatly improve the predicted value of the model and effectively analyze the influence of the
valuation fluctuation of the single stock. This is shown by the operation of the prediction model compared
with the experimental data.
1 INTRODUCTION
The change of the price in the stock market not only
changes with the change of the market law, but also
indicates the change of the overall situation of the
market. The conclusion that the fluctuation of the
stock market price is ahead of the market fluctuation
is shown by the empirical research results (Chen
2012). Stock prices have begun to rise before the
macroeconomic situation has come out of the trough,
and this phenomenon is generally due to the
unanimous judgment of investors on the economic
cycle (Liu 2012). The stock market is generally
called the operation of the virtual economy. The real
economy is the corresponding real economic market,
and the relationship between the two is like a shadow.
Therefore, the prediction of the stock market is
particularly important.
a
https://orcid.org/0000-0003-2468-2766
b
https://orcid.org/0000-0002-9457-2266
c
https://orcid.org/0000-0003-1369-3187
d
https://orcid.org/0000-0002-5095-3091
There are numerous topics about stock analysis
and forecasting in recent years. For example, how do
people make expectations and judgments about stock
price fluctuations, what direction the economic cycle
will change and how to be closer to the stock market,
and so on. From the early development of the method
of technical analysis, such as the Dow theory, the
average line theory, and the analysis of the K line, bar
charts, points graph analysis method, etc. and then to
the result of the development of the network of
financial technology arises at the historic moment of
the theory and the analysis of many technical
indicators. These analysis methods are essentially the
initial epitome of stock simulation and prediction. In
essence, these analysis methods are the initial
epitome of stock simulation and prediction.
However, in a strict sense, the above methods can
only be used as a basis based on theoretical analysis,
and cannot directly predict the development trend of
the securities market. In addition, people also try to
Wang, Y., Zheng, B., Meng, X. and Cui, J.
Research on the Influence of Industry Index on Individual Stock Price in Neural Network Prediction Model.
DOI: 10.5220/0011344000003437
In Proceedings of the 1st International Conference on Public Management and Big Data Analysis (PMBDA 2021), pages 327-334
ISBN: 978-989-758-589-0
Copyright
c
2022 by SCITEPRESS – Science and Technology Publications, Lda. All rights reserved
327

use computational methods such as regression
analysis to predict the securities market (Zhao 2006).
However, the huge amount of information waiting to
be processed is the most basic problem existing in the
use of traditional forecasting technology. The stock
price trend is affected by political, macroeconomic,
social epidemic and other factors, and its content is
complicated, so it is more difficult to get a more
accurate forecast (Yang 2010, Wang 2006).
Therefore, it is necessary for valuable valuation
prediction information to be obtained with the help
of other models.
In order to effectively predict the impact of
industry indicators on single-branch valuation, this
paper introduces the BP neural network, which is
based on the traditional prediction model. In order to
predict the overall trend of its stock price in the
future, this paper attempts to model the stock price of
Kweichow Moutai. Try to explore whether it has a
positive effect on the model prediction, so on this
basis, the industry index of wine, beverage and
refined tea manufacturing is added.
2 OVERVIEW OF THE
CULTURAL BACKGROUND
The second (enlarged) meeting of the sixth Council
of China Wine Association was held in Beijing on
April 28, 2021. According to data from the National
Bureau of Statistics, 1,887 enterprises above
designated size in the national wine industry have
completed a total wine output of 5,407,400 kiloliters,
which is a year-on-year decrease of 2.21% in 2020.
The sales revenue of the completed products was
835.331 billion yuan, an increase of 1.36% over the
same period last year; the total profit realized was
179.2 billion yuan, an increase of 11.71% over the
same period last year. Among them, the output of the
liquor industry was 8 million kiloliters, which did not
increase by 8.0% compared with the 13th five-year
Plan, with an average annual increase of 1.6%; sales
revenue reached 950 billion yuan, an increase of
62.8% over the same period last year, with an average
annual increase of 10.2%; and realized profits of 270
billion yuan, an increase of 70.3% over the same
period last year, with an average annual increase of
11.2%. The completed profit was more than 2700
billion yuan, an increase of 70.3% over the same
period last year, with an average annual increase of
11.2%.
As one of the most popular sectors in the stock
market, investors in the liquor industry have
remained enthusiastic about several leading stocks in
recent years. Because of the nonlinearity, complexity,
and uncertainty of the test data, the course cannot use
the traditional ordinary least square method and time
series model to predict the stock trend. Therefore,
this paper will build a model based on BP neural
network, and take Kweichow Moutai as an example
to further predict the development trend of its stock
price.
3 BP NEURAL NETWORK
3.1 Theory and Application of Neural
Network
Artificial neural network (Artificial Neural
Networks, ANN) is an adaptive nonlinear dynamic
system, which is connected by many neurons with
adjustable connection weights. It has the
characteristics of large-scale parallel processing,
distributed information storage, good self-organizing
and self-learning ability, and so on. The processing
of massive data is becoming more and more efficient
through machine learning. Machine learning
methods can obtain some data features which are
easy to be ignored by traditional methods by mining
a large amount of data.
Based on the above neural network
characteristics, which can be applied to the
prediction research of stock systems. Among the
many factors that affect the accuracy of predicting
stock price trends, the choice of input variables is one
of the key factors, such as the essential characteristics
of price changes are not well reflected by the input
variables. it will inevitably lead to the deviation of
the forecast results (Lu 2019).
3.2 Neural Network Model and Its
Implementation
BP (Back Propagation) neural network is a kind of
multilayer forward neural network. In the training of
the network, the training algorithm of adjusting
weights and thresholds follows the propagation mode
of error reverse, so it is a mature and perfect part of
the neural network (Hong 2016). In general, BP
neural network is a kind of neural network with three
or more layers, which includes the input layer, hidden
layer, and output layer, with the full connection
between upper and lower layers, but no connection
between neurons in the same layer. The neural
network can extend the traditional linear method to
include some variables with nonlinear relationships.
PMBDA 2021 - International Conference on Public Management and Big Data Analysis
328
Every neuron in between layers is connected. To put
it simply, every neuron connected in the lower layer
and every neuron in the upper layer should be
realized. However, there is no right to connect
between neurons in the same layer (Huang 2016,
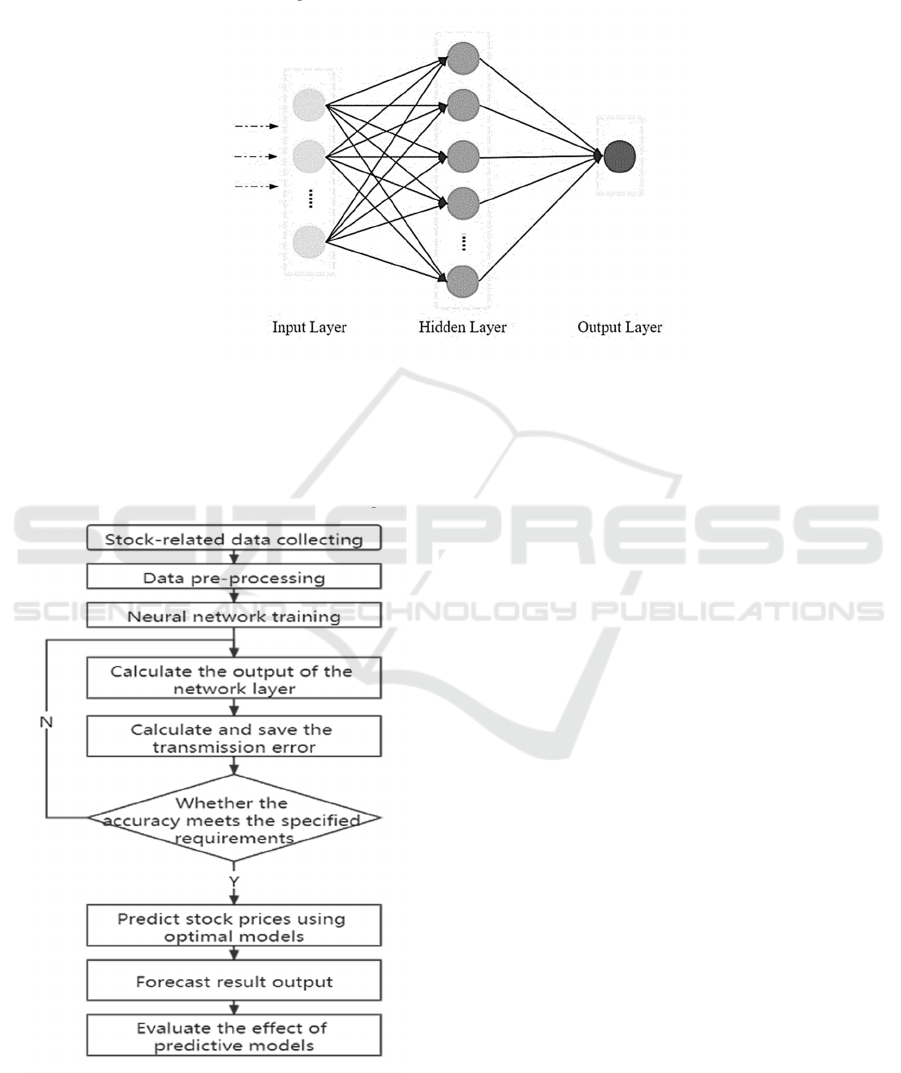
Huang 2016). The structure diagram of the BP neural
network is shown in figure 1.
Figure 1: Structure diagram of neural network.
The flow chart of this experiment is based on the
goal of this experiment and refers to the algorithm
structure of BP neural network, as shown in figure 2.
Figure 2: Flow chart of stock forecasting model based on
neural network
4 ESTABLISHMENT AND
SOLUTION OF MODEL
4.1 Selection of Research Objects and
Samples
The prediction of the stock price and price trend of
Kweichow Moutai is realized by BP neural network.
It also explores whether the daily rise or fall index of
the industry indicators including the wine, beverage,
and refined tea manufacturing industry has a positive
effect on the model prediction. Based on the
establishment of the conventional model, this paper
tries to explore the relevant indicators of the wine,
beverage, and refined tea manufacturing industry in
the process of prediction. By comparing the model
effects of the control group (not included in the
indicators of wine, beverage, and refined tea
manufacturing) and the experimental group
(included in the indicators of wine, beverage, and
refined tea manufacturing), to explore whether the
relevant industry data can effectively promote stock
prediction. This paper selects the relevant data of the
stock of Kweichow Moutai and the production
industry data of wine and beverage (daily ups and
downs) from August 1, 2011 to August 1, 2021.
Among them, there are 2432 valid data. The data
indicators include a total of 13 indicators related to
the stock of Kweichow Moutai and the wine,
beverage, and refined tea manufacturing.
Research on the Influence of Industry Index on Individual Stock Price in Neural Network Prediction Model
329
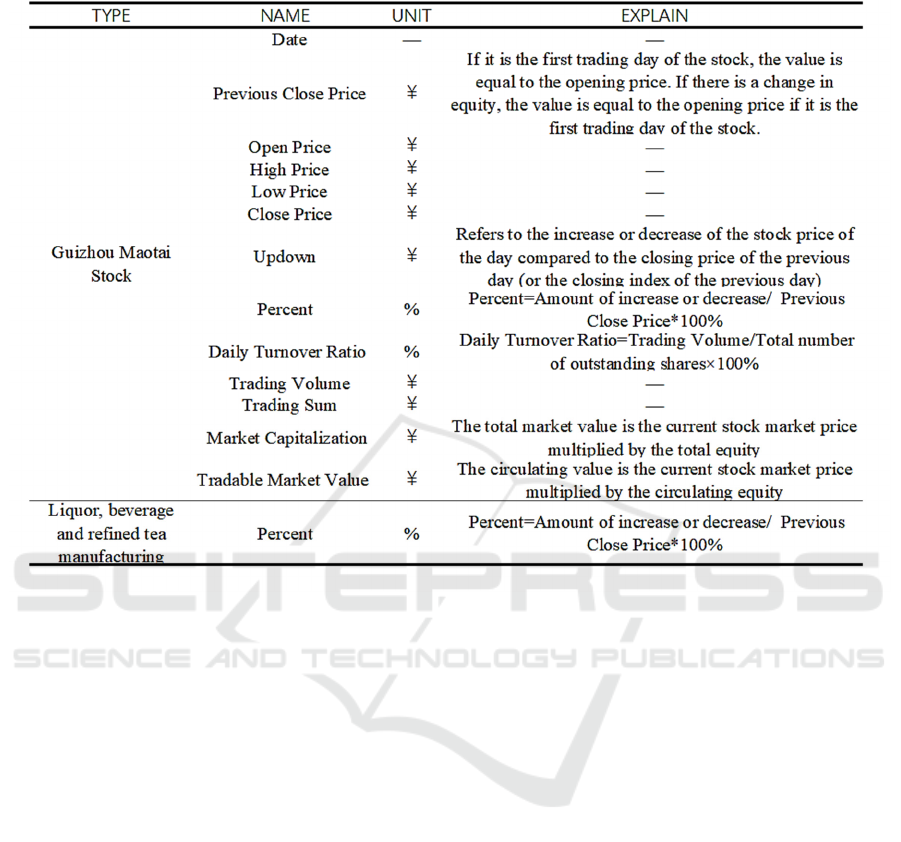
T
able 1: Data of the Research Sample.
Data source: CHOICE Database of East-money
4.2 Establishment of the Model
Input the 12 existing data of the previous day as
independent variables, and then use the closing price
of the stock the next day as the dependent variable to
output the predicted value, so that the good nonlinear
processing capabilities of the BP neural network can
be fully utilized. The specific process is as follows:
4.2.1 Data Preprocessing
Firstly, preprocess the data and optimize the data to
be preprocessed and the data of impact factors. Get
rid of the dimensional differences in the data. Divide
the processed data into the training set and detection
set. For data, the normalization of input values is
extremely important. The value processing of the
signal is normalized here into the interval [0, 1] (Chu
2019).
4.2.2 Parameter Setting of the Model
Based on MATLAB, the parameters set by this model
and the conditions for stopping the cycle are as
follows:
net.trainParam.show=20; %The display interval is set
to 20
net.trainParam.lr=0.1; %The rate of learning is set to
0.05
net.trainParam.mc=0.6; %The additional momentum
factor is set to 0.6
net.trainParam.epochs=1000; %The number of trainings is
set to 1000.
net.trainParam.goal=0.01; %The minimum error of the
training target is set to 0.01
4.2.3 Training of Models
The test of the fitting degree should correspond to the
feature dimension at each time in the model. This
article predicts the closing price of the stock on the
next day in the form of 13 indicators from the
previous day and uses the loss function to make the
output constantly approach the real data. In this
paper, the mean square error is used to measure the
performance of the model, which is used to predict
the overall deviation and whether the predicted trend
is consistent with the actual trend, which is defined
as follows:
PMBDA 2021 - International Conference on Public Management and Big Data Analysis
330
MSE
y,y
′
y
y
′
n
In the above formula, y
is the true value of the
ith data in the above formula, and y
is the predicted
value given by the neural network, and n is the
number of samples.
4.2.4 Output and Evaluation of Prediction
Results
Because the test set and training set of the model are
randomly generated, the results of any run of the
model may be different, but all meet the above setting
of the model parameters. Based on the data of the
control group and the experimental group, the
training results of any neural network model training
were analyzed:
The time range of the test set from August 1, 2011
to August 1, 2021 is the abscissa of the forecast
curve, and the closing price for the day is ordinate.
The red star shape is the real data, and the round blue
one is the prediction data, as shown in figure 3.
According to the chart, we can see that the overall
forecast trend is basically consistent with the real
stock closing price, so the prediction effect is better.
Figure 3: The predicted curve.
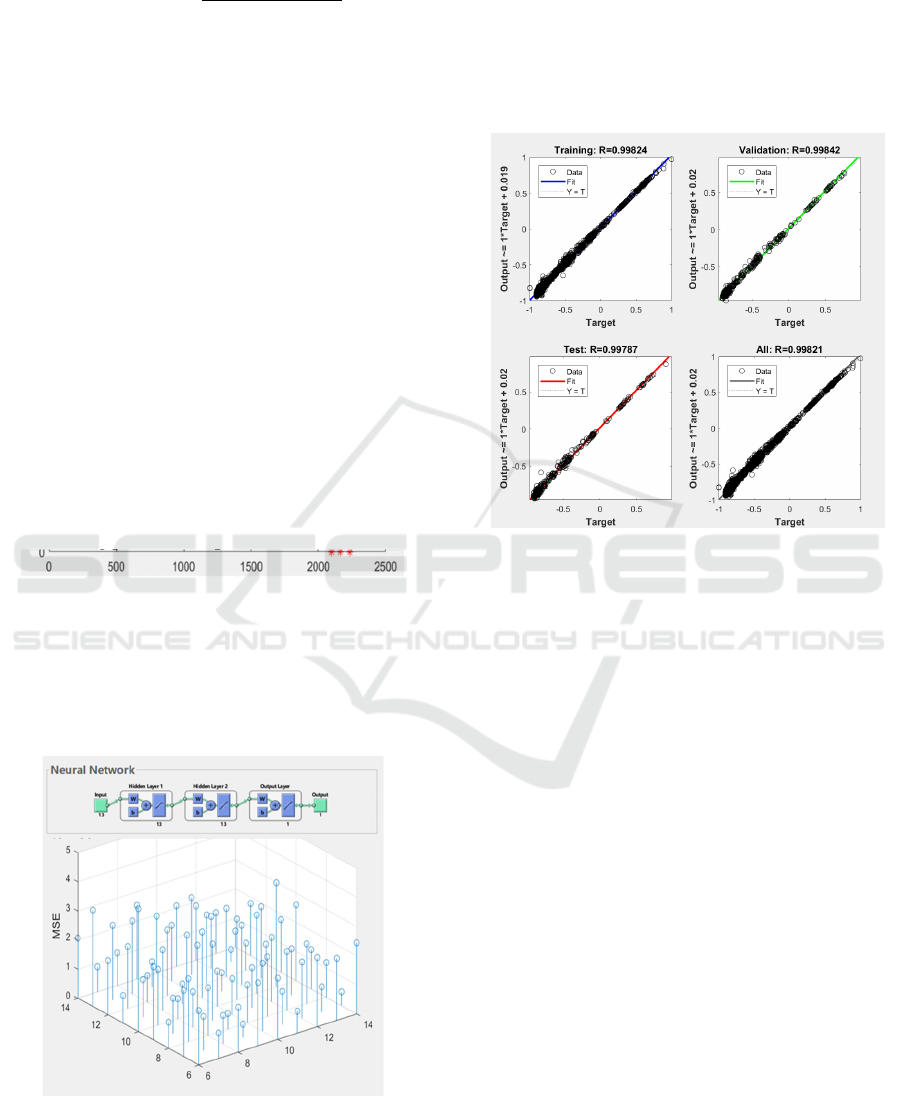
It can be concluded from the prediction process
graph that under the constraint of the minimum MSE,
the number of input layers in this training is 13, and
the number of hidden layers is 13 as the optimal
prediction model.
Figure 4: Process diagram of prediction.
The predictive regression map is a regression line
that is drawn to measure the fitting degree of the
corresponding data of the neural network to fit the
data. It can be seen that the target fitting curve Fit of
linear output on the regression map runs through the
lower left corner and the upper right corner, which
shows that the model has a good fitting effect to a
certain extent.
Figure 5: Diagram for predicting regression.
Combining the above models, the following
results are obtained: it is possible to accurately
predict the stock price with non-linearity and
randomness with the help of the stock price
prediction model of BP neural network. The
prediction data with a certain accuracy can be used
to make the model more ideal, make the error of the
predicted value reach the minimum, and effectively
achieve a better prediction effect.
4.3 Analysis of the Influence of
Industry Indexes on Individual
Stock Price
The ultimate purpose of the experiment is to predict
the stock price of Kweichow Moutai by BP neural
network, and to predict the trend of stock price and
explore whether the daily rise and fall index of wine,
beverage and refined tea manufacturing industry has
a positive effect on model prediction. Based on the
above model, this paper will explore whether the
addition of industry-related indicators will affect the
accuracy of the prediction results of the prediction
model of neural network. In this experiment, the
results of each run of the model may be different
because of the addition of random numbers in the
Research on the Influence of Industry Index on Individual Stock Price in Neural Network Prediction Model
331
process of test set selection. Therefore, this paper
carried out ten training runs for both the experimental
group and the control group. Through the record of
MSE, the average value of MSE in the experimental
group and the control group in the ten experiments
was calculated. As shown in the table below.
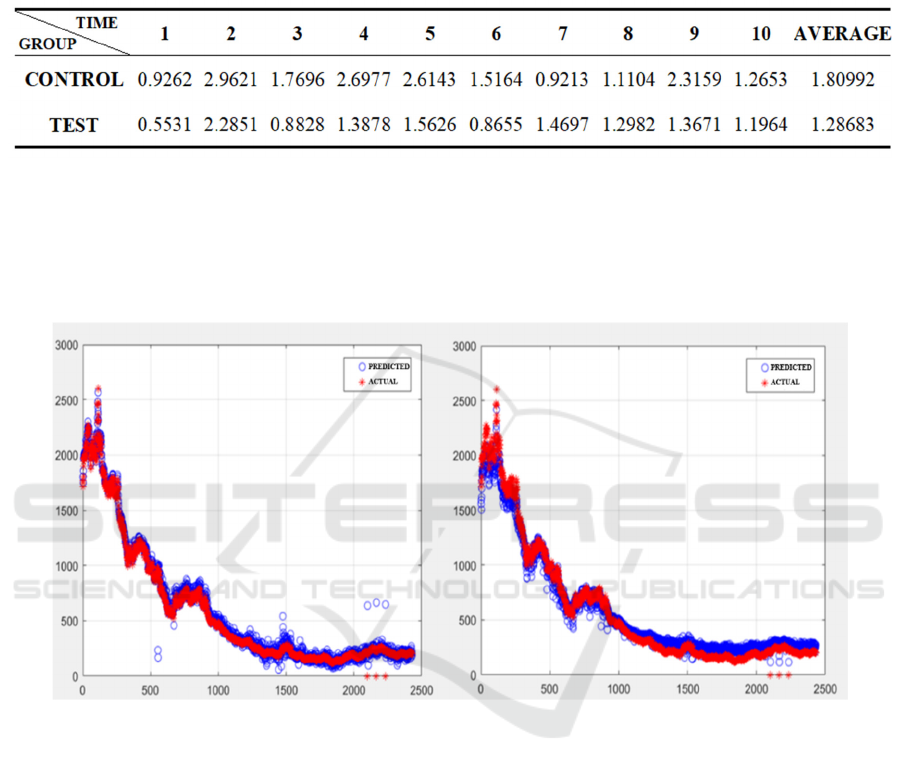
Table 2: MSE Summary Table of Experimental Group and Control Group.
By comparing this value, it can be found that the
MSE value of the experimental group is smaller than
that of the control group, which to a certain extent
means that the overall fitting degree is better and the
error is smaller, and a helpful way to predict stock
prices is to add indicators of wine, beverage, and
refined tea manufacturing. At the same time, the
relevant data taken in this paper were taken when the
control group and the experimental group had the
smallest MSE, respectively. As shown in the
following figure (control group on the left and
experimental group on the right):
Figure 6:
A Comparison of the Prediction Curves Between the Experimental Group and the Control Group.
By comparing the forecast graphs, the predicted
value of the left picture is basically the same as the
real value trend, but the error fluctuation situation is
relatively inferior to the overall level of the right
picture. Relatively speaking, the fitting situation of
the right figure is better and the predictive ability is
stronger.
According to the table (MSE) after the prediction
process chart, the number of input layers in the
control group is 14, the number of hidden layers is
0.9213, the number of hidden layers in the
experimental group is 13, the number of hidden
layers is 13, the MSE of hidden layers is 0.5531.
PMBDA 2021 - International Conference on Public Management and Big Data Analysis
332
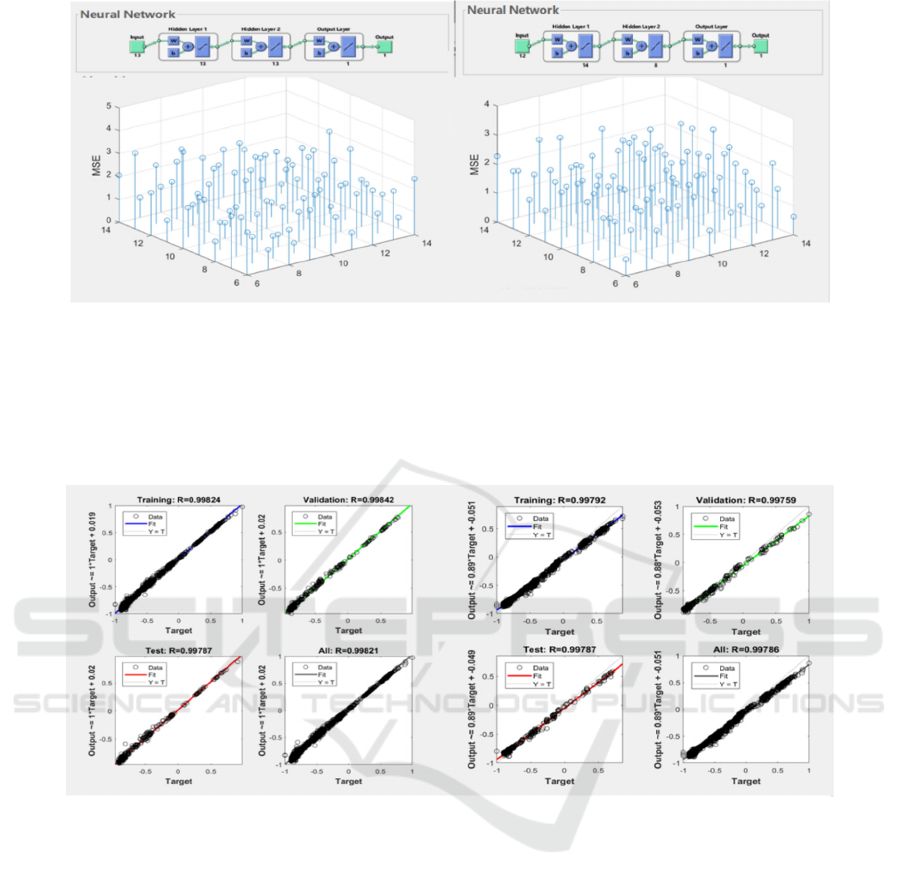
Figure 7. A Comparative Diagram of the Prediction Process Between the Experimental Group and the Control Group.
By comparing the predictive regression map, we
can see that the fitting degree of the control group
and the experimental group is better, and their target
fitting curves run through the lower-left corner and
the upper right corner. The R-value of the
experimental group is closer to 1 than that of the
control group, which indicates that the daily increase
index of the wine, beverage, and refined tea
manufacturing industry can make the model have a
better prediction effect from a certain Angle.
Figure 8: Comparativ
e Diagram of Predictive Regression Between the Experimental Group and the Control Group.
The advance goal of the experiment is proved to
a certain extent by the experiment and the above
analysis, that is, adding the relevant increase index of
the wine industry to the stock forecast can effectively
enhance the accuracy of the BP neural network for
stock prediction.
5 ANALYSIS OF
EXPERIMENTAL RESULTS
In this paper, the prediction model of the stock price
of the BP neural network is used to test and optimize
the artificial neural network model, and the problem
of feature extraction of related data is solved to a
certain extent. It also solves to some extent the
defects in the forecasting methods of some previous
stock trends in Reference 7 by reflecting the
influence of industry data on stock prices in
Reference 11.
In the research on the prediction of the stock
system, most of them measure the effectiveness of an
algorithm by whether it can accurately reflect the
changing trend of data in a period in the future. The
experimental results of using neural network to
predict stock price in this paper show that it is
effective. But at the same time, it is also found that
there are many problems to be solved in the use of
neural network for prediction. For example, the
training value of each time is different due to the
dynamic change of the neural network, and the
relationship between the input and output of the
predicted system cannot be expressed and analyzed,
Research on the Influence of Industry Index on Individual Stock Price in Neural Network Prediction Model
333

so the output of the system is difficult to explain. At
the same time, because the stock market is a complex
economic system, the result of using neural network
to deal with it may have errors due to the selection of
parameters or the training time is too short.
In order to eliminate the experimental error
caused by these problems, this article combines two
points to solve this problem, namely adding industry
indicators to the proposed forecasting model, and
reusing the BP neural network's forecasting model of
the stock price for forecasting. The experimental
results show that the MSE value of the brewing
industry index is generally smaller than the previous
MSE value, which shows that the prediction effect of
the BP neural network's forecasting model of the
stock price is better after adding the brewing industry
index. It also makes the prediction accuracy of this
model improved due to the addition of industry
indicators. In the prediction of this experiment, the
experimental data are based on the historical data of
Kweichow Moutai, a leader in the liquor industry. By
analogy, we can predict the future stock trend of other
brand data in the liquor industry. The model can be
extended to other industries and predict the future
stock prices of other brands. The effectiveness of the
scheme proposed in this paper has been proved in this
experiment, which makes the system optimized and
achieves higher stability. This provides a scientific
basis for the optimization of the model.
6 CONCLUSION
The BP neural network's forecasting model of stock
price can be obtained by analyzing the experimental
results of this paper by using the network structure
and initial conditions. It is effective to forecast the
stock price by using the selected historical data of
Kweichow Moutai and the brewing industry index in
Reference 6. At the same time, the forecasting model
in this paper can only be used as an auxiliary tool for
investment decision-making, and manual
intervention is still needed in actual investment
decision-making. Moreover, in the rapidly changing
environment of the securities market, the investment
model needs to be changed at any time according to
market changes and investment strategies, and the
same investment model cannot be used for a long
time. The model structure and algorithm should be
adjusted to a prediction system that is more suitable
for the law of market operation in Reference 6.
Through the analysis of this paper, we can do
more research on the BP neural network's forecasting
model of the stock price from the aspects of
increasing output variables and increasing or
changing input variables, to gradually improve the
prediction accuracy of this model and provide more
accurate prediction data for industry institutions and
the government.
REFERENCES
Chunhua Liu. (2012). Study on the influencing factors of
gold stock price [D]. Shandong University.
Feng Chen. (2012). Analysis of the influence of Stock
Index Futures on the volatility of China's A-share
Market [D]. Fudan University.
Fuyong Yang. (2010). Application of Neural Network
Model in Stock Investment [J]. Computing Technology
and Automation, 2010 Ji 29 (3): 108-112.
Hongyun Huang. (2016). Application of an improved
IPSO-BP Neural Network in Stock Index Forecast--
taking Shanghai Composite Index as an example [J].
Journal of Yanbian University: Science and
Technology, 42 (4): 6.
Hongyun Huang, Libin Wu, Shizheng Li. (2016).
Application of BP Neural Network in Stock Index
Forecast [J]. Journal of Tonghua Normal University,
37(10):32-34.
Jiancheng Long, Xiaoping Li. (2005). Study of the stock
market tendency based on the neural network [J].
Journal of Xidian University, 2005(03):460-463.
Wenhua Chu. (2019). Application of BP artificial Neural
Network in Stock Forecast [J]. Journal of Harbin
University of Commerce: Science and Technology, 35
(2): 4.
Xiyan Lu, Qingmei Liang. (2019). Prediction and Analysis
of Stock trend based on Neural Network [J]. Modern
Commerce, (9): 2.
Yun Hong, Libin Wu, Shipeng Li. (2016). Application of
BP Neural Network in Stock Index Forecast [J].
Journal of Tonghua Normal University, 37 (10): 32-34.
Ying Wang. (2006). Application and Research of BP
Neural Network in Stock Market Forecast [D].
University of Electronic Science and Technology of
China.
Yan Zhao. (2006). Analysis and Research of Stock Forecast
based on Neural Network [D]. Chang’an University.
PMBDA 2021 - International Conference on Public Management and Big Data Analysis
334
