
The First and Second Derivative Analysis of the Daily Cumulative
Coronavirus Disease 2019 Cases in Representative European
Countries
Liyan Lou
Ningbo Hanvos Kent School, Ningbo, Zhejiang, 315048, China
Keywords: Covid-19, First Derivative, Second Derivative Analysis, England, Ireland.
Abstract: Coronavirus disease 2019(Covid-19) had spread all around the world in 2020. For most countries, their
epidemic was still not stable. This study would analyze the epidemic of England and Ireland from different
aspects to find the reason for which their infection numbers are still increasing. Moreover, this study would
analyze them from three distinct geological strata, which are England, Ireland, and all countries in the Europe.
The author uses the first and second derivative graph of cumulative confirmed cases from June 1st 2021 to
August 3rd 2021. The data were collected from official websites that report daily confirmed cases. Moreover,
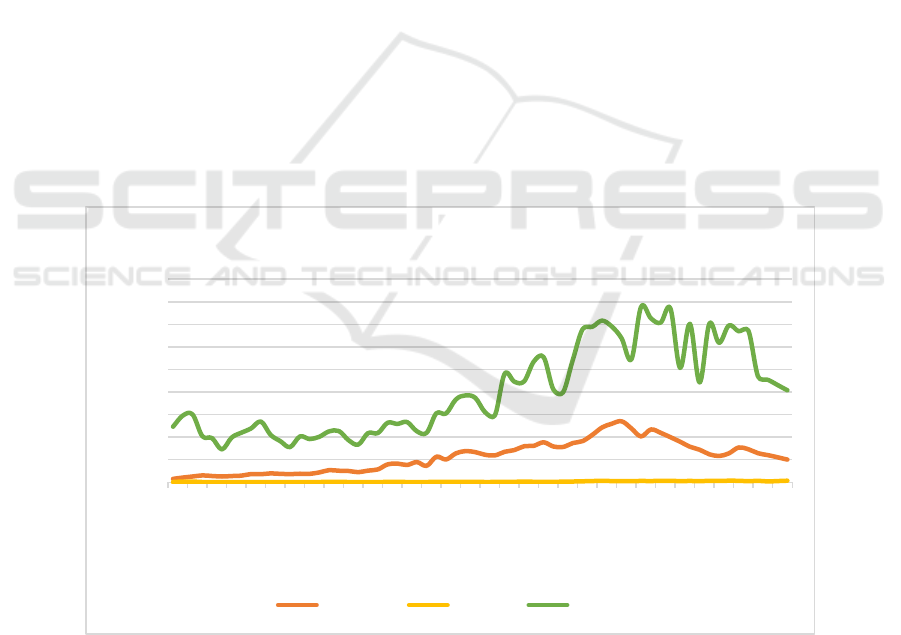
the author analyzes three different strata (England, Ireland, and all countries in the Europe). There are 5929786
cumulative cases in England, 305527 cases in Ireland and 51805897 cases in all European countries until
August 3rd, the change of F’’(x) in England and all European countries could be demonstrated in three periods:
Stable Period, Acceleration Period and Deceleration Period. Furthermore, the Ireland’s epidemic only
contained two Periods, which were Stable Period and Acceleration Period. The Acceleration Period could
reveal the relaxation of restriction, which increased the number of confirmed cases, in both Ireland and
England. Connecting to the local policy, the further vaccination that took place in England help them reduce
the Acceleration rate of confirmed cases.
1 INTRODUCTION
The coronavirus disease 2019(Covid-19), caused by
severe acute respiratory syndrome coronavirus
2(Sars-Cov-2, which had a genetic relationship with
the SARS disease happened in 2003 in China), took
place in China already for one year, and it spread
worldwide by mostly transportation, especially
international flights. Although the first and earliest
case happened on December 8th 2019, which was not
exact since it was the recall of the first patient of
Covid-19, the pandemic was carefully controlled by
start some anti-epidemic actions, quarantine. In
contrast, some other countries had more severe
epidemic situations than Chinese. For instance,
England was the country that had the 6th highest
number of diagnosed cases and 7th highest number of
deaths, These facts get attention globally. Until
August 30th, there were 6698486 diagnosed cases in
England alone, accounting for nearly 12.2 percent of
all cases in Europe. The total confirmed cases in all
European countries except England was
45876111(87.8%) cases. Moreover, Europe had total
number of 51805897 cases, accounting for 25.4% of
the world and ranking the 2nd of all continents.
Europe was the second most dangerous continent
since most European countries had high infection
density. The diagnosed rate was approximately
7.35%, implying that there would be over 70
thousand confirmed cases, second only to North
America (7.95%), where the majority of the cases
were amassed.
England has started several anti-epidemic policies
in order to control the pandemic like started
lockdown in the UK began on 16th March 2020 and
encouraged working from home on 15 April 2020.
Some of these actions definitely had effects, but some
anti-lockdown protests occurred, disturbing the
controlling process (Poppy 2021).
In this essay, the author aims to explain the
transmission of Covid-19 in England by explaining
the second derivative model from June 1st to August
3rd. In order to achieve a precise result, the writer
288
Lou, L.
The First and Second Derivative Analysis of the Daily Cumulative Coronavirus Disease 2019 Cases in Representative European Countries.
DOI: 10.5220/0011343400003437
In Proceedings of the 1st International Conference on Public Management and Big Data Analysis (PMBDA 2021), pages 288-293
ISBN: 978-989-758-589-0
Copyright
c
2022 by SCITEPRESS – Science and Technology Publications, Lda. All rights reserved

investigated the epidemic in different strata,
including England, Ireland, and Europe Countries.
The result of this study would give suggestions to
the England and Ireland in order to help them monitor
the epidemic better by providing the trend of
pandemic and predict the trend afterward. These
pieces of evidence could help decision-makers
control their countries' pandemics better. The
research also enriches the field of pandemic study in
European Countries.
2 METHOD
Database: The author gain the data of daily confirmed
cases from only one source: Data from June 1st to
August 3rd were derived from an official website that
contains daily reported and officially finalized cases
(Max 2021)(American Library Association 2021).
In order to gain the data for study, the author
derives the daily data: (1) for England only, (2) for
Ireland only and (3) for Europe Only. Details could
be seen in Figure 1:
Figure 1: The number of cumulative confirmed cases of
COVID-19 in England, Ireland, and all European Countries
from June 1st to August 3rd.
To find the second derivative model, the author
firstly derived the cumulative diagnosed cases table,
which was denoted as F(x)
F(x)=
=
t
a
ax
1
)(
(1)
where x(a) represent the daily confirmed cases in day
a(a=1,2,3...t)
According to this, the author gained the first
derivative F’(x). Since F’(x) means the velocity that
the growth of cumulative cases, everyday’s F’(x)s
were different. The author gain F’(x) from
F’(x)=
+
=
1
1
)(
t
a
ax
-
=
t
a
ax
1
)(
(2)
by subtracting the daily cumulative cases, the rate of
change of confirmed cases could be obtained. In
addition, since F’(x) is gained, the author found
F’’(x):
F’’(x)=F’(xa+1)-F’(x) (3)
where F’’(x) means the rate of change of the growth
rate, or the acceleration of confirmed cases.
The bigger F’(x), the faster daily cases increased,
whereas if F’(x) = 0, it means that the diagnosed cases
did not change during that day. In the cumulative
model, the rate of growth of confirmed cases would
always be non-negative since it grew almost every
day.
The First and Second Derivative Analysis of the Daily Cumulative Coronavirus Disease 2019 Cases in Representative European Countries
289
When F’’(x) is bigger than 0, it means that the
speed of increasing the number of diagnosed cases is
accelerating, whereas the negative F’’(x) value means
the rate of change in daily new cases is decelerating.
If the F’’(x) = 0, it means the F’(x) does not change
during that time, and it further means the number of
cumulative confirmed cases is evenly increasing,
decreasing or stop growing. F’’(x) always be
represented as a straight line on the F(x) graph.
3 ANALYSIS
3.1 First Derivative Analysis
The first derivative graph of cumulative cases of three
different strata is presented in figure 2. From June 1st
to June 30th, the infection rate in England did not
fluctuate very much, which illustrates very slow
growth of epidemic. However, in July, the rate of
change of reported cases increased to its peak in these
three months. The highest F’(x) value reached 54130
cases per day on July 17th. This may be a result from
the new policy posted by the prime minister on June
14th, which delayed England’s lockdown easing by
four weeks. Moreover, on July 5th, the prime minister
set out a plan to ease Covid-19 restrictions in England
(Sarah 2021. Because of these policies, the infection
rate grew rapidly. After the peak, the infection rate
declined on July 27th, and after a few days increasing,
it went down again at the end of July
Unlike England, the F’(x) lines of Ireland showed
another picture, For the Ireland graph, since Ireland
is isolated from most countries and its lockdown
policy, the number of infections did not grow very
much during this time. It only experienced its peak on
June 28th because Ireland reach its highest rate of
vaccination throughout the whole epidemic. The rate
of vaccination reached 110673 new vaccinations per
day. Because of this, the number of contact among
people increased, which caused a short period of
increase in confirmed cases.
The first derivative graph for the whole of Europe
has an extremely different epidemic pattern from the
other two. It fluctuates numerous times during these
two months. After June 26th, it started to grow
rapidly, and it reached its peak on July 19th and
another people on July 22nd which is a little later than
England. Contrasting to all European countries, the
England and Ireland showed a much flatter pattern,
telling the researchers and decision makers that other
countries in the Europe show strengthen their
countries' anti-epidemic policies.
Figure 2: Epidemic curve of the first derivative of cumulative COVID-19 cases from June 1st to August 3rd in England,
Ireland and Europe.
3.2 Second Derivative Analysis
Figure 3 illustrates the second derivative graph for
different strata.
From the second derivative graph of England,
presented in figure 3, the author concludes that during
these two months, England epidemic experienced
three different period, which is categorized by the rise
or fall of F’’(x).
0
20000
40000
60000
80000
100000
120000
140000
160000
180000
01/06/2021
03/06/2021
05/06/2021
07/06/2021
09/06/2021
11/06/2021
13/06/2021
15/06/2021
17/06/2021
19/06/2021
21/06/2021
23/06/2021
25/06/2021
27/06/2021
29/06/2021
01/07/2021
03/07/2021
05/07/2021
07/07/2021
09/07/2021
11/07/2021
13/07/2021
15/07/2021
17/07/2021
19/07/2021
21/07/2021
23/07/2021
25/07/2021
27/07/2021
29/07/2021
31/07/2021
02/08/2021
First Derivative analysis
England ireland Europe
PMBDA 2021 - International Conference on Public Management and Big Data Analysis
290
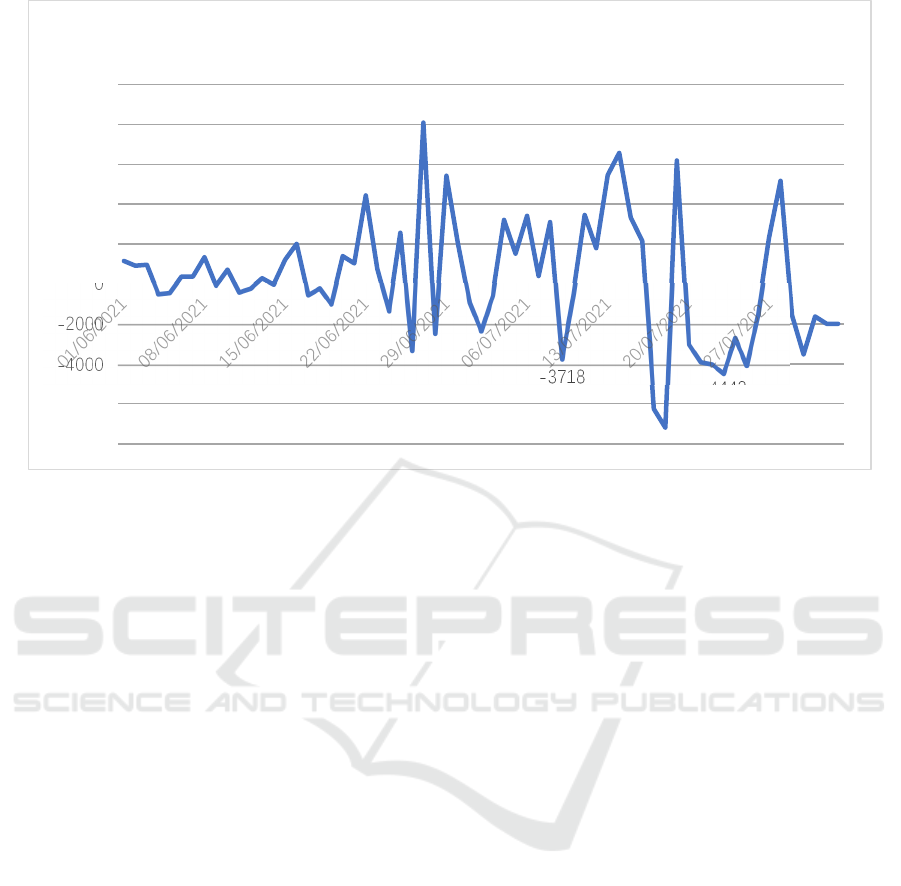
Figure 3:
Second Derivative Curve of cumulative COVID-19 cases from June 1st to August 3rd in England.
The first period was called Stable Period (From
June 1st 2021 to June 22nd 2021). During this time,
the variation of F’’(x) did not exceed 2000
cases/day2. The situation was seemingly good to
England, until the lockdown was delayed by the
Prime Minister on June 14th. After that day, the
average change of infection rate became extreme and
intense.
The second period was called Acceleration Period
(From June 23rd 2021 to July 15th 2021). F’’(x)
became much less stable than Stable Period. After 4
days, F’’(x) began to fluctuate, reached its peak on
June 27th. The graph shows the relatively increasing
tendency from June 23rd to July 15th. This result tells
researchers and those decision makers in the UK that
delaying the lockdown time definitely negatively
influenced the England pandemic.
The Last period was called Deceleration Period
(From July 16th 2021 to August 3rd 2021), which
shows a decreasing trend of F’’(x). Some anti-
epidemic actions occurred during the period. Further
vaccination started in this period. Until July 16th,
there was already 35745635 people who had taken
the second vaccination (UK Health Security Agency
2021)(Johns Hopkins University 2021). This event
definitely decrease the growth of infection rate.
Furthermore, from these data, the author knew three
important information: first, the future tendency of
F’’(x) would be more stable and stay between ±2000
if England continues to maintain the same situation,
or more people be vaccinated. Second, if more people
be quarantined, or England continues lockdown,
another decline wave would occur after an incubation
period, which would last for 14 days. Third, the
actions that took place in England after Acceleration
Period led to the decline of F’’(x). Though less
evidence could support this fact, a longer time of
observation is needed to confirm this information.
The tendency of F’’(x) of Ireland was showed in
figure 3. Even though Ireland was the nearest country
to the England, the graph of F’’(x) of Ireland is very
distinct from England’s. It only had two periods:
Stable Period and Acceleration Period. There was no
Deceleration Period during these two months.
Additionally, the lengths of these periods were far
different from England’s. In Ireland, the Stable Period
only lasted for 18 days (From June 1st 2021 to June
17th 2021). After that, later days were considered as
Acceleration Period (From June 18th 2021 to August
3rd 2021). The main reason for which Ireland’s
epidemic during these two months did not have
Deceleration Period was because of the relaxation of
restriction around the end of July and the beginning of
August. According to Tully, the co-chairman of the
Behavior Change Group at Northern Ireland’s Public
Health Agency, he said: “We’ve also seen an increase
in the number of contacts between people here as well,
slightly higher than the rest of the UK.” (Chris 2021).
This fact had negatively affect Ireland’s epidemic.
Moreover, since there were more serious control and
anti-epidemic actions in Ireland than there were in
England, so less fluctuation as shown in the graph.
1160
378
289
4441
2573
3212
-3718
8090
3460
1795
6569
-7191
6188
-4442
5173
-8000
-6000
-4000
-2000
0
2000
4000
6000
8000
10000
England
The First and Second Derivative Analysis of the Daily Cumulative Coronavirus Disease 2019 Cases in Representative European Countries
291
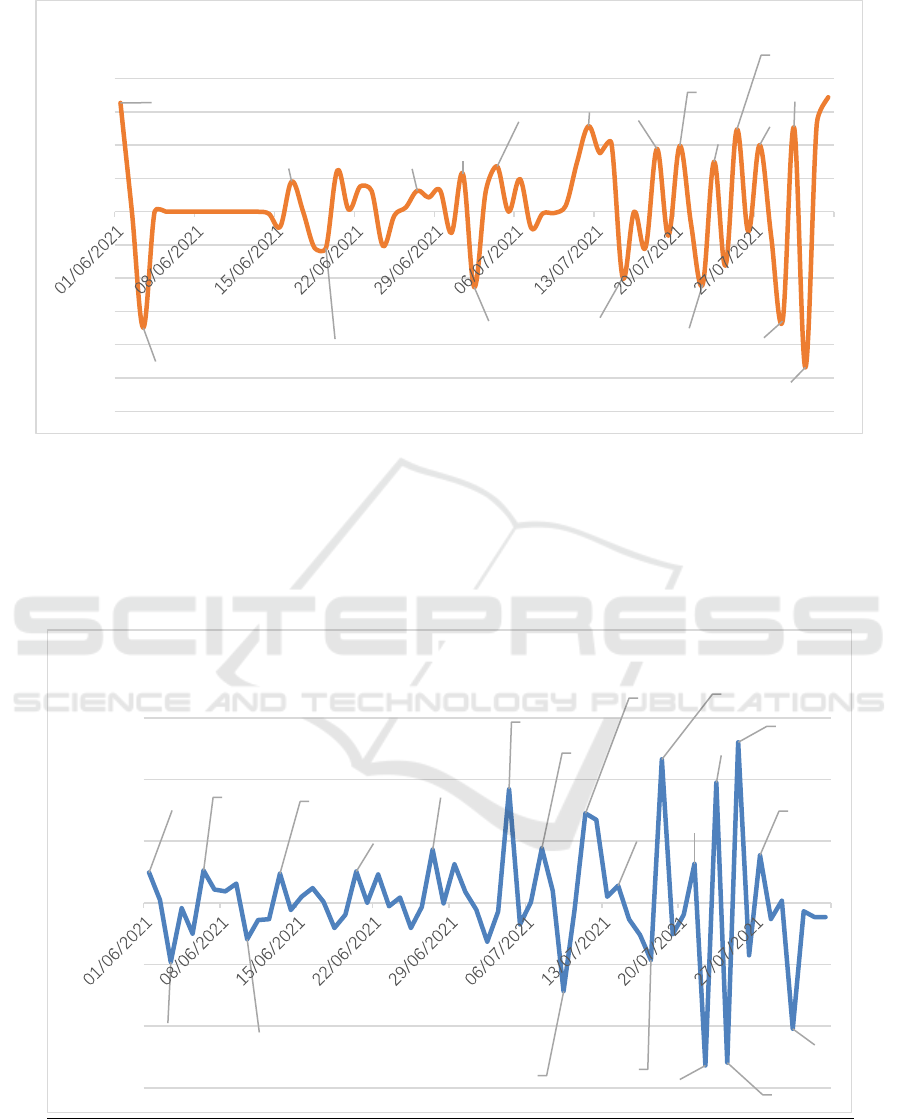
Figure 4. Second Derivative Curve of cumulative COVID-19 cases from June 1st to August 3rd in Ireland.
The trend of F’’(x) of all European countries was
showed in Figure 4. Unlike Ireland, the tendency of
all European countries is more similar to England’s.
Because England had the most infections at the time,
any change in England's infection would affect the
tendency of all European countries more than others.
It has three comparable periods to England: the Stable
Period (June 1st to July 3rd), the Acceleration Period
(July 4th to July 21st), and the Deceleration Period
(July 22nd to August 3rd).Its Stable Period was 11
days longer, and it had 5 days shorter Acceleration
Period and 6 days shorter Deceleration Period.
Figure 5. Second Derivative Curve of cumulative COVID-19 cases from June 1st to August 3rd in Europe.
327
-349
91
-110
124
63
114
-227
136
257
-198
189
198
-219
150
247
200
-74
-329
254
-468
344
-600
-500
-400
-300
-200
-100
0
100
200
300
400
Ireland
9819
-19215
10491
-11832
9467
10176
17277
36868
17698
-28694
29044
5536
-18536
46542
12687
-52754
39012
-51847
52105
15425
-40873
-60000
-40000
-20000
0
20000
40000
60000
Europe
PMBDA 2021 - International Conference on Public Management and Big Data Analysis
292

4 CONCLUSION
This first and second derivative analysis illustrates
that the main reason for the increase in the number of
infections was the relaxation of restriction, and that
caused the rise of contact among people. The fact that
all European countries’ F’’(x) tendency had the
unequal length of different periods from England
infer that other countries in Europe had more stable
epidemics than England. Furthermore, the result of
this study could help those decision makers make
more reasonable policies to control the pandemic.
This study, of course, has several limitations.
First, the main study region is England and Ireland,
which means that the author did not pay too much
attention to other countries. As the Covid-19 had
spread to other countries, more studies are needed to
help scientists and medical staff to monitor the
pandemic. Second, fluctuations Ireland’s epidemic
was too small that is hard to compare with other
countries, so it may be more effective to use other
countries' information, such as Russia, to compare
with England. Finally, the study period is relatively
shorter than the whole epidemic, and since the
derivative graph is very sensitive to the change, two
monthly analyses may not elaborate the big picture
comprehensively. Therefore, longer time research is
needed in order to confirm the tendency for each
country.
ACKNOWLEDGEMENTS
This study was conducted by the program “Dynamics
of Disease, taking covid-19 as an example”. The
author sincerely thanks to all people who strove on
study for the Covid-19 and who struggled in
overcoming the epidemic all around the world.
REFERENCES
American Library Association. (2021). Covid-19 statistics
of Ireland
https://www.worldometers.info/coronavirus/country/ir
eland/#graph-cases-daily. Accessed on August 29th
2021.
Chris Baraniuk. (2021). Covid-19: Why is Northern
Ireland’s death rate so high?
https://www.bmj.com/content/374/bmj.n2129.
Accessed on August 29th 2021.
Johns Hopkins University. (2021). Novel coronavirus
pneumonia epidemic analysis platform
https://www.arcgis.com/apps/dashboards/bda7594740f
d40299423467b48e9ecf6 Accessed on August 29th
2021.
Max Roser. (2021).
https://ourworldindata.org/coronavirus#growth-of-
cases-how-long-did-it-take-for-the-number-of-
confirmed-cases-to-double Accessed on October
30th 2021.
Poppy Bilderbeck. (2021). Police Break Up One-Man Anti-
Lockdown Protest
https://www.unilad.co.uk/news/police-break-up-one-
man-anti-lockdown-protest/. Accessed on August 29th
2021.
Sarah Priddy. (2021). The coronavirus timeline: Measures
taken by the House of Commons
https://commonslibrary.parliament.uk/house-of-
commons-coronavirus-timeline/#july2021. Accessed
on August 29th 2021.
UK Health Security Agency. (2021). Vaccinations in United
Kingdom
https://coronavirus.data.gov.uk/details/vaccinations.
Accessed on October 30th 2021.
The First and Second Derivative Analysis of the Daily Cumulative Coronavirus Disease 2019 Cases in Representative European Countries
293
