
Research of Food Supply Chain Safety Evaluation based on Fuzzy
Analytic Hierarchy Process
Yu Huang
a
International Business School Suzhou at XJTLU, Xi’an Jiaotong-liverpool University, Suzhou, China
Keywords: Food Supply Chain, Fuzzy Analytic Hierarchy Process, Safety Evaluation.
Abstract: Aiming at the food supply chain safety evaluation, this paper adopts a fuzzy hierarchy analysis method to
build a risk identification model of the food supply chain from strengthening five aspects: quality and safety
risk control, logistics safety risk control, cooperative safety risk control, market safety risk control and
environmental safety risk control. According to the calculation results of the model, the specific risk factors
affecting the safety of the food supply chain are analyzed. It is of specific reference value to study food quality
risk management based on the food supply chain level, take scientific measures to reduce food quality and
safety risks caused by various factors, and strengthen food safety risk prevention and control ability.
1 INTRODUCTION
Food safety risks always exist judging from the
emerging food safety problems, which will gradually
become the focus of social attention (Shaw and
Shaw,2019). With improving people's living
standards in modern times, the requirements and
standards for healthier food are also increasing. Food
raw materials feature variety, different places of
origin, seasonality, perishability, and there are many
factors such as physical, chemical, and biological
factors that may threaten food safety (Beulens et al.
2005). Thus, it is challenging to guarantee food safety
only by controlling one link in food operation. As an
essential part of food safety research, researchers at
home and abroad have studied the food safety
evaluation system from the perspective of food safety
management technology, consumer behaviour, and
overall food safety evaluation and other aspects (Dani
and Deep, 2010; Spink, 2019).
For the safety risk management of the food supply
chain, Fares and Rouviere (2010) adopted the
corresponding mechanism of food safety system as
the research object. From the food safety system and
mechanism perspective, identify and classify food
safety risk factors. Government departments play a
role in food safety research and management. This
management method reduces the possibility of
a
https://orcid.org/0000-0002-1402-1975
security risks in the supply chain. Wolfe and Lee
(2003) pointed out that it is necessary to find the
primary person responsible for food safety when
conducting food safety management. Finding out the
person responsible for the accident is of great
significance to the effective development of the
research. By finding the person in charge, we can deal
with safety accidents in a targeted way. Secondly, he
believes that a traceable food safety supervision and
management system should be established so that the
root cause of the problem can be found when the
problem occurs. The supply chain can reduce the
possibility of food safety events and establish an
excellent company's external image. Ahi and Searcy
(2013) established a supply chain network model,
focusing on the three central subjects of the food
supply chain, food retailers and food distributors. The
food safety risk management decision is divided into
multi-level, and the food safety risk is reduced
through multi-level decision-making. If the model
shows convergence when calculating the data, the
model is in equilibrium, and the safety risk is low.
When Hallikas and four other researchers (2004)
conducted supply chain management, he focused on
key supply chain network management and non-basic
supply chain network management methods. This
research method is more in-depth and practical. Carry
out in-depth supply chain management. It is found
that the more members in the supply chain, the more
Huang, Y.
Research of Food Supply Chain Safety Evaluation based on Fuzzy Analytic Hierarchy Process.
DOI: 10.5220/0011304400003437
In Proceedings of the 1st International Conference on Public Management and Big Data Analysis (PMBDA 2021), pages 113-118
ISBN: 978-989-758-589-0
Copyright
c
2022 by SCITEPRESS – Science and Technology Publications, Lda. All rights reserved
113

risk-prone the supply chain is, and the non-primary
supply chain network management method can
manage the supply chain more effectively. Ray (2021)
took the perishable goods supply chain as the research
object and established the optimization model of the
perishable goods supply chain. The model improves
the expected profit of decision-makers under the
uncertainty of demand and price and manages the
supply chain to achieve the expected effect of risk
management. A case study is carried out to compare
the operation effects of the basic single strategic
scheme and the multi decision combination scheme.
A single approach is not enough to provide
solutions in all risk scenarios. Combining various
methods is the most effective and best goal of risk
management. Dharmalingam and the other four
experts (2021) the effective operation of the supply
chain depends not only on the solid competitiveness
of each node enterprise but also on the harmonious,
cooperative relationship and coordinated
development with other cooperative enterprises in the
supply chain. Therefore, facing the risks arising from
the supply chain, it is necessary for each enterprise to
carry out sufficient supervision and management and
need to manage together with other enterprises.
Therefore, supply chain risk needs to be managed in
the whole supply chain. In many traditional risk
management models, few people pay attention to the
importance of internal risk management culture. The
author believes that the risk of the whole supply chain
should be managed by introducing a revolutionary
supply chain risk management process and
emphasizes the importance of the company's risk
management strategy - the embedded risk
management culture. Shi (2020) believes that we
must build a new logistics and emergency supply
chain system to strengthen supply chain management.
The supply chain is quickly interrupted or inefficient
without a sound logistics system. The emergence and
use of intelligent logistics will avoid various
problems in traditional logistics, and intelligent
logistics will be more efficient, intelligent, fast,
border and flexible. The emergency supply chain
shows more agile characteristics, collaboration,
accuracy and green, which align with the current
supply chain demand (Liang and Yang, 2020). The
popularity of COVID-19 has strengthened the
requirements of food supply chain management. In
this environment, the food supply chain management
must first establish an information network platform
to facilitate all enterprises in the food supply chain.
Be able to timely understand the information of the
whole supply chain and make timely adjustments to
yourself. Understand the real-time unsalable products
of the enterprise in the production process, integrate
the source of products according to the real-time
demand of the market, and allocate products among
various markets. Secondly, build an intelligent supply
chain connecting buyers, sellers and logistics, and
build a three-dimensional distribution system to
ensure the smooth transportation and supply balance
of products in all markets.
In comparison, there is still no comprehensive and
unified evaluation of regional food safety. This study
seriously studies the management of food quality risk
and carries out a scientific evaluation from the food
supply chain and food safety perspective. The fuzzy
analytic hierarchy process is adopted to research the
food supply chain safety evaluation to provide a
scientific reference for further food safety research.
2 INTRODUCTION OF THE
FUZZY ANALYTICAL
HIERARCHY PROCESS
The fuzzy analytic hierarchy process is a systematic
analysis method that combines qualitative and
quantitative analysis and analyzes based on the fuzzy
number or fuzzy judgment matrix
(Nehme,2019). The
traditional analytic hierarchy process has certain
limitations on testing the judgment matrix, while the
fuzzy analytic hierarchy process overcomes this
defect. It is a more effective comprehensive
evaluation method of which the specific analysis
steps are as follows.
2.1 Fuzzy Hierarchical Structure
Model
First, all factors are divided into three layers and
arranged into the target layer, criterion layer, and
index layer from high to low, respectively, to establish
the fuzzy hierarchy model of this study, as shown in
Fig. 1 (Bakhtari et al. 2021).
PMBDA 2021 - International Conference on Public Management and Big Data Analysis
114
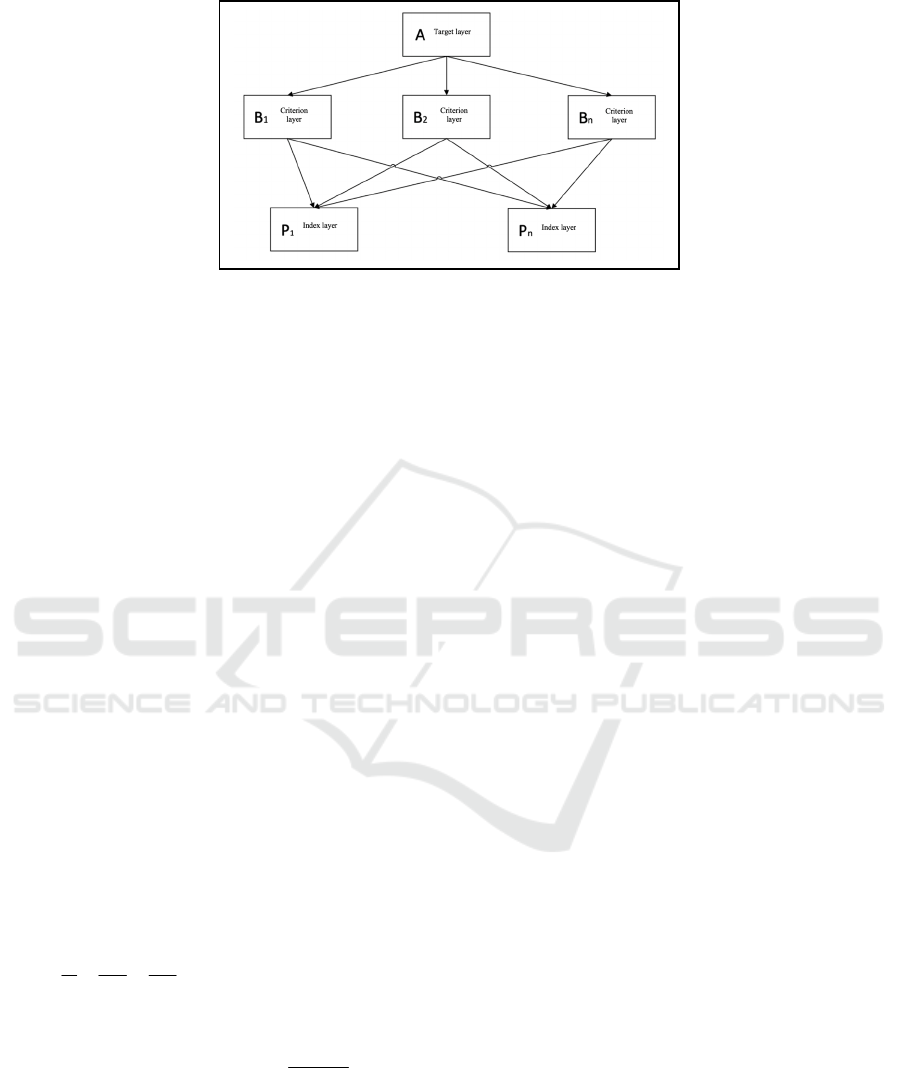
Figure 1: Fuzzy hierarchical structure model.
2.2 Fuzzy Complementary Matrix
Compare the relative importance of relevant elements
between the upper layer element B and the current
layer element C to create a fuzzy complementary
matrix R, which is:
11 12 13 1
21 22 23 2
31 32 33 3
123
n
n
BC n
nn n nn
rrr r
rrr r
Rrrr r
rrr r
−
=
where
0.5, ( 1, 2, , )
ii
ri n==
;
1,(,1,2,,)
ji ij
rrij n=− =
.
2.3 Hierarchical Single Sorting
The importance of the factors on the current layer is
sorted, and the weight is determined according to the
calculation of the fuzzy complementarity matrix
(Li
and Xu,2021)
. That is, the single hierarchical sorting is
formed. The weight formula is:
1
11 1
,( , 1,2, , )
2
n
ikik
wrikn
nana
=
=− + =
where n is the order of R, and
(1)
2
n
a
−
=
.
2.4 Hierarchical Total Sorting
The hierarchical total sorting can be obtained by
calculating the weighted sum of the results of
hierarchical single sorting from top to bottom. The
importance vector of the element
n
k
on layer K to
the elements on layer k-1 is:
12 1
1
(, ,, )
k
kT
kknknkn
www w
−
−
−− −
=
.The synthetic
importance vector of the elements on the k-th layer to
the total target is:
11
1
kk-
kk-k
w=w w×
. The weight
matrix of index factor layer of the n-layer low-order
structure is:
1112332
12 21
2
in
nn n
kinnn
wwwwwww
=
−− −
−−
==
∏
.
2.5 Determine the Index Factor Set
Assign initial values to each index ≤ factor in the
above evaluation index system, and the index factor
set after dimensionless treatment is:
123
(, , )
T
n
XXXXX=
.
2.6 Calculation of the Evaluation Set
If the evaluation set of the target layer to be
determined is Y, then:
1
1
()
n
T
nii
i
Yw X wx
=
=×=
.
3 FUZZY ANALYTIC
HIERARCHY PROCESS
RESULTS
By reading a large number of relevant literature on
supply chain risk, based on the expert survey method,
and through detailed index sorting and screening, the
following 20 secondary risk elements are finally
determined: (1) five secondary indexes of quality
risk: the use of pesticides, hormones, food additives,
Research of Food Supply Chain Safety Evaluation based on Fuzzy Analytic Hierarchy Process
115

and other chemicals; poor hygienic environment in
food production, processing, and sales; improper food
storage; imperfect food safety supervision
mechanism; imperfect enterprise food quality
management system (Fung, Guo and Wang,2021); (2)
three secondary indexes of logistics risk: damage in
the process of food circulation; mixed transportation
of food and other commodities; delayed arrival of
food; (3) five secondary indexes of cooperation risk:
information asymmetry; unreasonable distribution of
interests; distrust among enterprises; inconsistent
strategic objectives; corporate culture differences; (4)
five secondary indexes of market risk: market
demand uncertainty; insufficient product supply; food
price fluctuation; industry competition risk; changes
in economic policies; (5) two secondary indexes of
environmental risk: natural environment risk;
economic environment risk.
To determine ratios to construct a relevant
judgment matrix of indexes on each layer,
comparisons between each factor on the same layer
and a particular factor on the higher layer are carried
out by referring to a large number of relevant research
literature and using the expert assignment scaling
method. MATLAB software is used to calculate the
judgment matrices (Regattieri, Gamberi and Manzini,
2007). Results are shown in Table I below.
Table 1: Criterion Layer F Judgment Matrix.
F F1 F2 F3 F4 F5 W
F1
a
1.00 3.00 2.00 1.00 .50 0.2255
F2
b
0.33 1.00 1.00 0.33 0.33 0.0936
F3
c
0.50 1.00 1.00 0.50 0.50 0.1194
F4
d
1.00 3.00 2.00 1.00 3.00 0.3227
F5
e
2.00 3.00 2.00 0.33 1.00 0.2388
a. F1 is for quality risk; b. F2 logistics risk; c. F3 cooperation risk;
d. F4 market risk; e. F5 environmental risk.
Table 2: Supply Chain Quality Risk F1 Judgment Matrix.
F1 F11 F12 F13 F14 F15 W
F11
a
1.00 0.50 2.00 2.00 0.50 0.1815
F12
b
2.00 1.00 3.00 2.00 1.00 0.2984
F13
c
0.50 0.33 1.00 1.00 0.33 0.1018
F14
d
0.50 0.50 1.00 1.00 0.50 0.1198
F15
e
2.00 1.00 3.00 2.00 1.00 0.2984
a. F11 is for the use of pesticides, hormones, food additives, and other chemicals;
b. F12 poor hygienic environment in food production, processing, and sales;
c. F13 refers to improper food storage; d. F14 imperfect food safety supervision
mechanism;
e. F15 imperfect food quality management system.
Table 3: Supply Chain Logistics Risk F2 Judgment Matrix.
F2 F21 F22 F23 W
F21
a
1.00 1.00 2.00 0.416
F22
b
1.00 1.00 1.00 0.3275
F23
c
0.50 1.00 1.00 0.2599
a. F21 is for the damage during food circulation;
b. F22 mixed transportation of food and other commodities;
c. F23 delayed arrival of food.
Table 4: Supply Chain Cooperation Risk F3 Judgment
Matrix.
F3 F31 F32 F33 F34 F35 W
F31
a
1.00 0.33 0.50 0.50 0.50 0.0943
F32
b
3.00 1.00 2.00 2.00 2.00 0.3368
F33
c
2.00 0.50 1.00 3.00 1.00 0.2222
F34
d
2.00 0.50 0.33 1.00 0.50 0.1244
F35
e
3.00 0.50 1.00 2.00 1.00 0.2222
a. F31 refers to information asymmetry; b. F32 unreasonable benefit distribution;
c. F33 distrust among enterprises; d. F34 inconsistent strategic objectives;
e.F35 corporate cultural differences.
Table 5: Supply Chain Market Risk F4 Judgment Matrix.
F4 F41 F42 F43 F44 F45 W
F41
a
1.00 1.00 1.00 0.50 1.00 0.1626
F42
b
1.00 1.00 0.33 0.50 0.50 0.1134
F43
c
1.00 3.00 1.00 3.00 2.00 0.3070
F44
d
2.00 2.00 0.50 1.00 3.00 0.2673
F45
e
1.00 2.00 0.50 0.33 1.00 0.1476
a. F41 refers to market demand uncertainty; b. F42 insufficient product supply;
c. F43 food price fluctuation; d. F44 industrial competition risk; e. F45 changes in
economic policies.
Table 6: Environmental Risk F5 Judgment Matrix.
F5 F51 F52 W
F51
a
1.00 0.50 0.3333
F52
b
2.00 1.00 0.6667
a. F51 is the natural environment risk; b. F52 is the economic environment risk.
Through the above judgment matrices, the index
weight set vectors of the target layer and the criterion
layer are obtained respectively, which are:
PMBDA 2021 - International Conference on Public Management and Big Data Analysis
116

W
F
=(0.2255,0.0936,0.1194,0.3227,0.2388);
W
F1
=(0.1815,0.2984,0.1018,0.1198,0.2984);
W
F2
=(0.4126,0.3275,0.2599);
W
F3
=(0.0943,0.3368,0.2222,0.1244,0.2222);
W
F4
=(0.1626,0.1134,0.3070,0.2673,0.1496);
W
F5
=(0.3333,0.6667).
According to the index, weight set vectors of the
target and criterion layers are combined with the
evaluation matrices of the five criterion layers of
quality risk, logistics risk, cooperation risk, market
risk, and environmental risk
(Wei and Song,2018). The
fuzzy comprehensive evaluation can bring the data
into the fuzzy analytic hierarchy process for fuzzy
operation.Then, it can be obtained that W1= (0.1519,
0.1743, 0.2592, 0.2140, 0.2006); W2= (0.1804,
0.1840, 0.1740, 0.2493, 0.2124); W3= (0.1598,
0.1925, 0.2266, 0.2269, 0.2078); W4= (0.1616,
0.1770, 0.2728, 0.2019, 0.1865); W5= (0.1300,
0.2567, 0.2533, 0.1867, 0.1733). By recombining the
W1, W2, W3, W4, and W5 as a criterion layer to
evaluate the matrix R, the final fuzzy evaluation of
this supply chain is:
𝑊=𝑊
×𝑅
= (0.2255,0.0936,0.1194,0.3227,0.2388)
×
⎣
⎢
⎢
⎢
⎡
0.1519 0.1743 0.2592 0.2140 0.2006
0.1804 0.1840 0.1740 0.2493 0.2124
0.1598 0.1925 0.2266 0.2269 0.2078
0.1616 0.1770 0.2728 0.2019 0.1865
0.1300 0.2567 0.2533 0.1867 0.1733
⎦
⎥
⎥
⎥
⎤
= (0.1534,0.1979,0.2503,0.2084,0.1915)
Combine the final fuzzy evaluation results with
the Likert five-level scale for further matrix
multiplication. The final evaluation score of food
supply chain risk is 2.5179, which shows that the
overall quality safety of the food supply chain is at the
medium level.
4 CONCLUSIONS
Food is a necessity of our life, and from the most
primitive state of food to the subsequent transmission
to consumers, any mistake in any link may cause
quality and safety risks, which will directly affect
people's life and health, so society has paid great
attention to it for a long time. In order to better ensure
food safety and make consumers feel at ease and
enterprises operate comfortably, unilateral
investigation of the reasons of enterprises or
consumers often does not play a key role. Exploring
and evaluating comprehensive factors has become an
important issue. Scholars have less research on the
safety risk of the food supply chain, and only analyze
it from the internal and external or subjective and
objective single level of the food supply chain, lack
the combination of qualitative and quantitative
analysis, and do not comprehensively analyze the
deep-seated reasons affecting the safety risk of food
supply chain from multiple angles. Aiming at this
problem, this paper first comprehensively analyzes
the safety risk from the perspective of the food supply
chain, combined with the internal, external,
subjective and objective aspects of food supply chain
enterprises, and finds out the factors that affect the
safety risk of food supply chain in essence.
To sum up, from the perspective of food supply
chain supervision, this paper establishes a
quantitative evaluation model based on a fuzzy
analytic hierarchy process. It provides a quantitative
evaluation tool for food supply chain safety
supervision, which realizes the overall safety and
practical evaluation of the food supply chain and
provides decision support for refining the food supply
chain safety evaluation
(Yeung and Morris,2013).
Although this paper accurately, scientifically, and
timely reflects the food safety situation from the
fundamental problems of food source and food
consumption from the aspects of quality risk, logistics
risk, cooperation risk, market risk, and environmental
risk of the food supply chain, improvement is still
needed for specific research.
REFERENCES
Ahi, P. and Searcy, C., 2013. A comparative literature
analysis of definitions for green and sustainable supply
chain management. Journal of Cleaner Production, 52,
329-341.
Bakhtari, A. R., Waris, M. M., Sanin, C. and Szczerbicki,
E., 2021. Evaluating Industry 4.0 Implementation
Challenges Using Interpretive Structural Modeling and
Fuzzy Analytic Hierarchy Process. Cybernetics and
Systems, 52(5), 350-378.
Beulens, A. J., Broens, D., Folstar, P. and Hofstede, G. J.,
2005. Food safety and transparency in food chains and
networks Relationships and challenges. Food Control,
16(6), 481-486.
Dani, S. and Deep, A., 2010. Fragile food supply chains:
reacting to risks. International Journal of Logistics
Research and Applications, 13(5), 395-410.
Dharmalingam, B., Giri Nandagopal, M., Thulasiraman, V.,
Kothakota, A. and Rajkumar, 2021. Short food supply
chains to resolve food scarcity during COVID 19
Research of Food Supply Chain Safety Evaluation based on Fuzzy Analytic Hierarchy Process
117

pandemic—An Indian model. Advances in Food
Security and Sustainability, [online] 6, 35-63. Available
at:
<https://www.sciencedirect.com/science/article/pii/S24
52263521000070> [Accessed 21 December 2021].
Fang, K., Guo, J. and Wang, Q., 2021. Evaluation of Air
Material Support Capability Based on Fuzzy Analytic
Hierarchy Process. Logistics Sci-Tech, (11), 139-141.
Fares, M. and Rouviere, E., 2010. The implementation
mechanisms of voluntary food safety systems. Food
Policy, 35(5), 412-418.
Hallikas, J., Karvonen, I., Pulkkinen, U., Virolainen, V. and
Tuominen, M., 2004. Risk management processes in
supplier networks. International Journal of Production
Economics, 90(1), 47-58.
Li, P. and Xu, G., 2021. Safety Condition Assessment of
Bridge Crane Based on Improved Fuzzy Analytic
Hierarchy Process. Machine Design and Research,
37(5), 219-223.
Liang, P. and Yang, P., 2020. Discussion on
countermeasures of promoting circulation of
agricultural products in response to the epidemic
situation. Commercial Economics Research, 18, 132-
134.
Nehme, S., 2019. Governmentally Controlled Supply
Chains in Areas Facing Food Security Challenges: The
Case of Baladi Bread Supply Chain in Egypt and the
Policy Transition After the 2011 Uprising. Springer
International Publishing,2019.11.
Ray, P., 2021. Agricultural Supply Chain Risk
Management Under Price and Demand Uncertainty.
International Journal of System Dynamics
Applications, 10(2), 17-32.
Regattieri, A., Gamberi, M. and Manzini, R., 2007.
Traceability of food products: General framework and
experimental evidence. Journal of Food Engineering,
81(2), 347-356.
Shaw, H. J. and Shaw, J. J. A., 2019. Corporate Social
Responsibility and the Global Food Supply Chain.
Taylor and Francis, 2019.05.
Shi, X., 2020. Impact of COVID-19 on China's logistics and
global supply chain and countermeasures. Logistics
Research, 01, 11-16.
Spink, J. W., 2019. Supply Chain Management (Part 2 of
2): Application Applied to Food Fraud Prevention.
Springer. New York,2019.10.
Wei, X. and Song, Y., 2018. Comprehensive benefit
evaluation for of PV building based on fuzzy analytic
hierarchy process. Acta energiae solaris sinica, 39(2),
544-549.
Wolfe, M. and Lee, H., 2003. Supply Chain Security
Without Tears. Supply Chain Management Review,
7(3), 12-20.
Yeung, R. W. W. and Morris, J., 2013. Food safety risk.
British Food Journal, 103(3), 170-186.
PMBDA 2021 - International Conference on Public Management and Big Data Analysis
118
