
Analysis of Mianshan Network Attention based on Big Data
Mengyao Zhang
a
Guilin University of Technology, College of tourism and landscape architecture, Guilin, Guangxi, China
Keywords: Big Data, Mianshan, Network Attention, Temporal and Spatial Characteristics.
Abstract: Network attention is a precursor phenomenon of tourists' tourism behavior. The analysis of network attention
is conducive to the targeted marketing and publicity of the scenic spot and attract more tourists. This study
takes Mianshan scenic spot in Jiexiu , Shanxi Province as an example, crawls the network attention
information through python, analyzes the temporal and spatial characteristics of Mianshan network attention
by using the coefficient of variation, seasonal concentration index and geographical concentration index, and
finds that due to historical and cultural factors, the network attention of Mianshan scenic spot shows a peak
before and after the Qing Dynasty. It also puts forward the measures to realize the sustainable development
of tourism in Mianshan scenic spot.
1 INTRODUCTION
With the rapid development of economy and the
popularization of network technology, people are
more and more used to using search engines to obtain
the information of tourist attractions. According to
the 45th statistical report on China's Internet
development, by March 2020, China had 904 million
Internet users, and the Internet penetration rate was
64.5%; the number of mobile Internet users is 897
million. When making travel decisions, tourists
usually use Internet big data to obtain destination
information to help them make correct decisions and
prepare for travel in advance. Baidu is a typical
representative of big data. As the world's largest
Chinese search engine, baidu is a common tool for
people to obtain tourism information and make
tourism decisions. Based on big data search, Baidu
Index summarizes the search times of Baidu netizens
for a keyword every day to measure users' network
attention to specific objects.
As one of the applications of big data, Baidu
Index's application in tourism mainly focuses on
three aspects. First, research on the temporal and
spatial characteristics of network attention of tourism
destinations or scenic spots(Ruan 2019,Du 2020).
Second, predict the number of tourists to tourist
destinations or scenic spots through network attention
(Huang 2013, Qin 2019). Third, other studies such as
a
https://orcid.org/0000-0002-0315-4289
income prediction using Baidu Index (Zhang 2015,
Zou 2015).
Mianshan scenic spot (hereinafter referred to as
Mianshan), located in Jiexiu, Jinzhong, Shanxi
Province, with the highest altitude of 2561 meters, is
a branch of Taiyue Mountain. Mianshan is the
birthplace of China's Qingming Festival (cold food
festival). In 2013, it was rated as a national AAAAA
tourist attraction. Mianshan is famous for Jie Zitui's
seclusion with his mother in the spring and Autumn
period.
2 MATERIALS AND METHODS
The following formulas are used in this study: (1)
calculate the coefficient of variation(CV), (2)
calculate the seasonal concentration index(S), and (3)
calculate the geographical concentration index(G).
CV=
x
n
xx
n
i
i
=
−
1
2
)(
(1)
226
Zhang, M.
Analysis of Mianshan Network Attention based on Big Data.
DOI: 10.5220/0011304000003437
In Proceedings of the 1st International Conference on Public Management and Big Data Analysis (PMBDA 2021), pages 226-231
ISBN: 978-989-758-589-0
Copyright
c
2022 by SCITEPRESS – Science and Technology Publications, Lda. All rights reserved

S=
12)33.8(
12
1
2
=
−
i
i
x
(2)
G=
=
n
j
j
PP
1
2
)(100 (3)
The data used in this study are from big data
search platform, covering 31 provinces, autonomous
regions and municipalities directly under the central
government. When obtaining data, this study selects
"Mianshan" as the search keyword, and the earliest
year of data is 2011. However, due to the lack of data
in some months in a few western regions, such as
Xinjiang and Tibet, and the fact that Mianshan scenic
spot was rated as a national 5A scenic spot in 2013,
this event has improved its popularity and network
attention. Therefore, this time point in 2013 is
selected as the starting year; At the same time, due to
the impact of COVID-19 on Tourism in 2020, data is
not universally referenced, so the data are closed to
2019. In order to further clarify the changes in the
scenic spot's network attention, python was used to
crawl the network attention in 2013, 2016 and 2019.
3 RESULTS & DISCUSSION
3.1 Annual Variation Characteristics of
Network Attention in Mianshan
Scenic Spot
The annual total amount of Mianshan network
attention in 2013, 2016 and 2019 was obtained on the
big data search platform, and the growth rate,
coefficient of variation and seasonal concentration
index were calculated. The specific results are shown
in Table 1.
Table 1: Annual change of Mianshan network attention.
year
Total
attention
growth
rate
Coefficient of
variation
Seasonal concentration
index
2013 704247 — 0.55 4.59
2016 889768 26.34% 0.30 2.53
2019 753132 15.36% 0.28 2.32
As can be seen from table 1, the annual change of
Mianshan network attention has the following
characteristics:
From 2013 to 2016, Mianshan's network attention
was in an increasing trend, rising from 704247 in
2013 to 889768 in 2016. The growth of attention was
inseparable from the fact that the scenic spot was
awarded 5A scenic spot; From 2016 to 2019, the
attention of Mianshan network was in a downward
trend, with a negative growth rate.
The coefficient of variation shows a downward
trend as a whole, indicating that from the perspective
of time, the degree of time concentration gradually
weakens and the difference becomes smaller and
smaller from 2013 to 2019.
The characteristics are roughly consistent with the
coefficient of variation, and have been showing a
downward trend. The annual seasonal concentration
index is greater than 1, indicating that the off-season
and peak season of Mianshan network attention are
more obvious, which is particularly prominent in
2013.
Combining the coefficient of variation, seasonal
concentration index and the annual total amount of
network attention, it can be found that the annual total
amount of network attention in Mianshan increased
from 2013 to 2016, the coefficient of variation and
seasonal concentration index showed a downward
trend, and the popularity aggregation in Mianshan
gradually appeared in off-season and peak
season.From 2016 to 2019, the annual total amount
Analysis of Mianshan Network Attention based on Big Data
227
of online attention decreased, and the coefficient of
variation and seasonal concentration index also
decreased, indicating that with the improvement of
Mianshan's popularity, the attention in the whole year
gradually became average.
3.2 Monthly Variation Characteristics
of Network Attention in Mianshan
Scenic Spot
Obtain the network attention of Mianshan in 2013,
2016 and 2019 on the big data retrieval platform, and
draw a broken line statistical chart (Figure 1).
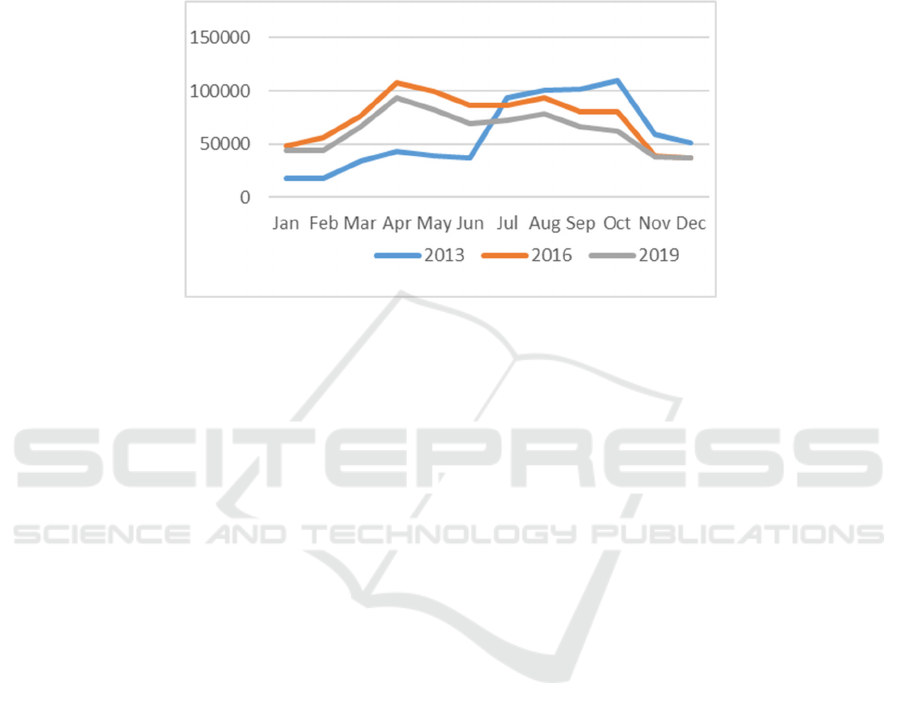
Figure 1: Monthly change of network attention in Mianshan.
As can be seen from Figure 1, the monthly change
of network attention in Mianshan has the following
characteristics: a) in 2013, the monthly network
attention in Mianshan basically increased month by
month from January to October, and decreased in
November and December; In 2013, the three peaks of
network attention appeared in April, July and
October, which were affected by Qingming Festival,
summer vacation and golden week respectively. b)
The growth trend of online attention is roughly the
same in each month of 2016 and 2019. The broken
line chart shows the characteristics of three peaks.
The three peaks appear in April, August and October
respectively. On the one hand, they are basically
consistent with the time of "Qingming", summer
vacation and golden week, indicating that a large
number of tourists choose to pay attention to
Mianshan during these three holidays; On the other
hand, it shows that the climate of Mianshan is suitable
in spring, summer and autumn, tourists' willingness
to travel is relatively strong, and they pay strong
attention to Mianshan. c) At the end of the year and
the beginning of the year, tourists pay less attention
to the network of Mianshan, which is related to the
type of scenic spot of Mianshan scenic spot.
Mianshan is a natural and cultural scenic spot. At the
end of the year and the beginning of the year, affected
by the climate, Mianshan scenic spot belongs to
temperate monsoon climate. It is cold and dry in
winter, with fallen vegetation leaves and heavy snow
coverage, which affects the viewing effect.
Therefore, from November to February of the next
year, there are few tourists and less network attention.
3.3 Distribution Characteristics of
Mianshan Network Attention
among Provincial Administrative
Regions
Obtain the annual total amount of attention of
Mianshan network in provincial administrative
regions in 2013, 2016 and 2019 on the big data
retrieval platform. It can be seen from table 2: a) from
2013 to 2019, the network attention of Mianshan in
provincial administrative regions increased first and
then decreased, but overall, the attention to Mianshan
scenic spot increased greatly; b) There are great
differences in the network attention of Mianshan in
various regions. Although the network attention of
most regions has increased, the network attention of
some regions such as Xinjiang, Qinghai, Tibet and
Hainan in 2019 is still lower than that of Mianshan in
2013.The figures in brackets indicate the ranking of
Mianshan's network attention and total annual
attention in this year. Although there are individual
jumps in the attention of Mianshan network in
various regions, on the whole, the exponential order
shows a light microwave dynamic potential.
PMBDA 2021 - International Conference on Public Management and Big Data Analysis
228

Table 2: Annual total amount of network attention of each province.
2013 2016 2019
Shanghai 26240(12) 33653(11) 30073(11)
Yunnan
9955(25) 7538(25) 9120(25)
Inner Mongolia 29346(9) 40871(7) 34249(10)
Beijing
45209(2) 59023(3) 51530(2)
Jilin 16164(19) 13396(21) 10716(20)
Sichuan 24046(13) 31270(12) 29204(12)
Tianjin
35670(5) 43504(6) 34944(8)
Ningxia
14087(21) 18254(16) 15533(16)
Anhui 16759(17) 15048(19) 15440(17)
Shandong
29960(8) 37028(9) 35994(6)
Shanxi
93683(1) 186551(1) 126452(1)
Guangdong
30792(7) 40281(8) 35380(7)
Guangxi
12566(23) 6465(26) 7444(26)
Xinjiang
7393(28) 4877(27) 4766(28)
Jiangsu 28089(10) 35526(10) 34588(9)
Jiangxi 12654(22) 10357(23) 9769(24)
Hebei 42142(3) 59198(2) 48094(3)
Henan 35225(6) 45450(5) 39264(5)
Zhejiang
27061(11) 28630(13) 27249(13)
Hainan
4486(29) 2466(30) 2293(29)
Hubei 20989(15) 21267(15) 18641(15)
Hunan 16590(18) 15816(18) 14697(18)
Gansu 8646(27) 8900(24) 10220(23)
Fujian 19599(16) 16654(17) 13276(19)
Tibet
685(31) 456(31) 285(31)
Guizhou 8917(26) 3666(29) 5187(27)
Liaoning
21879(14) 24973(14) 23758(14)
Chongqing
12193(24) 11427(22) 10667(21)
Shaanxi 36855(4) 49941(4) 42327(4)
Qinghai 1831(30) 3860(28) 1610(30)
Heilongjiang
14536(20) 13422(20) 10362(22)
Analysis of Mianshan Network Attention based on Big Data
229

3.4 Change Characteristics of Network
Attention in Mianshan Scenic Spot
On the big data retrieval platform, obtain the daily
average of Mianshan network attention in each
provincial administrative region in 2013, 2016 and
2019, and calculate the geographic concentration
index of each year (Table 3)
Table 3: Geographic concentration index of Mianshan
network attention.
year 2013 2016 2019
Geographic
concentration index
22.58 27.55 25.00
It can be seen from table 3 that from 2013 to 2016,
the geographical concentration index increased, the
concentration of network attention in various regions
increased, the spatial imbalance increased, and the
bipolar phenomenon of attention in various provinces
was obvious; From 2016 to 2019, the geographical
concentration index decreased, the concentration of
regional network attention weakened, and the spatial
attention gradually developed towards a balanced
trend.
4 CONCLUSIONS
Through the above analysis, we can draw the
following conclusions:
a)From the perspective of interannual changes,
Mianshan's network attention increased from 2013 to
2016, and decreased from 2016 to 2019;
b)Mianshan's network attention is divided into
off-season and peak season, which is the most
obvious in 2013;from the perspective of inter month
changes, the year's attention level presents the
characteristics of three peaks, which appear around
April, July, October and October respectively, which
is basically consistent with the time of Qingming
Festival, summer vacation and the golden week;
c)From a regional perspective, the network
attention of 31 provincial administrative regions to
Mianshan increased first and then decreased; the
geographic concentration index of Mianshan network
attention first increases and then decreases, the
distribution of regional attention is becoming more
and more balanced, and the geographic concentration
degree decreases.
In order to promote the sustainable development
of Mianshan tourism, we can start from the following
aspects:
a)Balance the passenger flow in off-season and
peak season. In view of the low passenger flow of
Mianshan scenic spot in the off-season (November to
February of the next year), the scenic spot can focus
on different ice and snow features of the scenic spot
in winter, which can be used as a highlight of winter
publicity and marketing.
b)Deepen the integration of culture and tourism,
promote tourism with culture and highlight culture
with tourism. The scenic spot should integrate the
internal culture of "loyalty, righteousness and filial
piety" with the scenic spot tourism resources, deeply
explore its own cultural connotation, create a unique
cultural IP and cultural tourism integration, and
attract tourists and attention with unique scenic spot
characteristics.
c)Improve the quality of employees and
standardize service management. The staff of
Mianshan scenic spot mainly includes tourism
management personnel and tourism service
personnel. Different recruitment and training
measures should be taken for different personnel to
effectively improve the comprehensive quality of
employees and improve the service level of
employees in the scenic spot.
d)Carry out marketing plan according to local
conditions. The number of tourists in Mianshan is
affected by geographical distance. Therefore, in the
marketing process, the characteristics of the scenic
spot should be highlighted for the provinces with
close geographical distance.
e)Broaden the access road to the mountain and
standardize the supporting facilities. In order to make
the entrance and exit of tourists more unobstructed,
Mianshan scenic spot should further broaden the road
into the mountain and improve the connectivity and
road conditions from the scenic spot to the trunk road;
At the same time, feasible measures shall be taken to
alleviate the contradiction between coal and tourism
on the transportation trunk line, and realize the
effective consideration of tourism passenger
transport while ensuring coal transportation.
f)Enrich tourism products and diversify tourism
commodities. Mianshan scenic spot should, in
accordance with the principles of resource
classification, product classification, market
stratification and service classification, and in
combination with the change of market demand, give
full play to its regional advantages and climate
characteristics, accelerate the development of
emerging products such as eco-tourism, leisure and
PMBDA 2021 - International Conference on Public Management and Big Data Analysis
230

health tourism, and build a compound tourism
destination.
REFERENCES
Du M T & Yang X X &Chen P. (2020). On Spatial and
Temporal Characteristics of Online Scenic Spot Based
on Baidu Index -- Taking Hongyadong of Chongqing as
a Case.Journal of Southwest Normal University
(NATURAL SCIENCE EDITION), 45 (06): 72-79.
Huang X K & Zhang L F & Ding Y S. (2013). Study on the
relationship and prediction between Baidu Index and
the number of tourists in scenic spots -- Taking the
Forbidden City in Beijing as an example.Journal of
tourism, 28 (11): 93-100.
Qin M & Liu H. (2019). Baidu Index, mixing model and
tourism demand in Sanya.Journal of tourism,34 (10):
116-126.
Ruan W Q & Zhang S & Li Y Q & Zheng X M. (2019).
Temporal and spatial differentiation of China's tourism
demand to Thailand and its influencing factors. Journal
of tourism, 34 (05): 76-89.
Zhang B R & Huang X K & Liu S L. (2015). Tourism
revenue forecast based on network search data -- a case
study of Hainan Province. Exploration on economic
issues, (08): 154-160.
Zou Y G & Lin W L & Zheng X M. (2015). Temporal and
spatial characteristics and influencing factors of
tourism security network attention. Journal of
tourism,30 (02): 101-109.
Analysis of Mianshan Network Attention based on Big Data
231
