
Risk of CAPM Model Apply in Chinese Concept Stocks based on
Python
Hechen Wang
Management and Marketing, Durham University, Durham, DH1 1NY, U.K.
Keywords: Capm, Chinese Concept, Stock, Finance, Investment.
Abstract: Sharpe developed the Capital Asset Pricing Model, which was completed by Lintner and Mossing based on
portfolio theory and capital market theory. The Chinses Concept stocks have a particular situation in the US
stock market because of enterprises’ backgrounds. The paper will apply CAPM model in two Chinese Concept
Stocks NIO and LKNCY by using python to analyse data. The risks are analysed by unsystematic and
systematic risks and the special situation of Chinese Concept Stock will be also discussed as factors. The data
analysis through python will be more accurate and less lab or cost. The purpose of this research is to provide
more objective investment suggestions to Chinese concept stocks investors.
1 INTRODUCTION
Sharpe (1964) developed the Capital Asset Pricing
Model, which was completed by Lintner (1965) and
Mossin (1966) based on portfolio theory and capital
market theory, with a focus on the relationship
between the expected return of assets and risk assets
in the securities market, as well as the formation of
equilibrium price. The Capital Asset Pricing Model is
the foundation of modern financial market pricing
theory, and it is applied in the fields of investment and
corporate finance. The Capital Asset Pricing Model
The theoretical and practical value of the CAPM
model has been proved under ideal circumstances.
CAPM model classifies risk into two types:
systematic risk and unsystematic risk. Furthermore,
since the US stock market permits enterprises
globally to IPO and the Chinese stock market has
restricted regulations.
As a result, many Chinese companies are listed on
the US stock market, such as NIO and Alibaba. On
the other hand, Chinese concept stocks are a group of
Chinese stocks listed outside of China and include
companies that are registered in mainland China and
listed abroad, as well as enterprises that are registered
in mainland China but have their primary business
and relations in mainland China. Those stocks are
heavily influenced by the expected trend of overseas
investors on mainland China's economy, and they are
limited by foreign investors' lack of understanding of
China.
Thus, this article will apply the close prices
between 2019-2020 in python and analyze the risk of
the CAPM model in Chinese concept stocks by
calculating expected returns and actual returns for
two Chinese concept stocks: NIO and LKNCY. More
importantly, the research will provide a more
productive analysis for Chinese concept stock
investors.
2 LITERATURE OVERVIEW
CAPM theory has been widely adopted in the modern
finance theory, and numerous researchers have
studied it. Under ideal circumstances and
assumptions that the investors are rational and
diversified invest strictly in a portfolio from
somewhere along the efficient frontier according to
the rules of the Markowitz model (Markowitz, 1967),
as well as the capital markets, are fully efficient
markets with no frictions hindering investment,
CPAM model confirms the linear relationship
between risk and returns under the CAPM model
showing that greater exposure to risk provides higher
returns.
In addition, Black (1972) claimed that the line
connecting the anticipated return on an efficient
portfolio to its beta is made up of two straight line
208
Wang, H.
Risk of CAPM Model Apply in Chinese Concept Stocks based on Python.
DOI: 10.5220/0011161700003437
In Proceedings of the 1st International Conference on Public Management and Big Data Analysis (PMBDA 2021), pages 208-213
ISBN: 978-989-758-589-0
Copyright
c
2022 by SCITEPRESS – Science and Technology Publications, Lda. All rights reserved
segments, with the lower-risk section having a
steeper slope than the higher-risk one. However,
Dempsey (2012) argued that the facts of the
experiments don't support the CAPM model.
Contrary, Gençay et al. (2005) suggested that the
CAPM's predictions are more meaningful in the
medium to long term range. Thus, in the portfolio
selection issue, CAPM may be significant decision-
making challenge for most companies.
3 METHODOLOGY
First of all, expected returns and real returns will be
calculated. The study CAPM model is a line equation
that determines the capital return on assets. The
equation of the CAPM model is:
E(Ri) = Rf + β(Rm – Rf). (1)
E(Ri): capital asset expected return
β: sensitivity E(Rm): expected return of the
market
Rf: risk-free rate of interest
The beta coefficient is the sensitivity of individual
stock returns relative to the overall market, and it is
determined by the connection between market swings
and the price variations of individual stocks or
groups, implying that the model use market risk to
explain the risk of individual stocks:
β = COV(i, m)/ σ² (2)
When β= 1, the price of the security correlated to
the market.
When β< 1, the price of the security less violate
than the market.
When β> 1, the price of the security fluctuates
more than the market.
The study uses NIO Inc. (NYSE: NIO) and
Luckin Coffee Inc (OTCMKTS: LKNCY) as sample
data to analyze and uses python to compute Expected
returns and plot regression lines between individual
security and the market portfolio. Secondly, since a
risk-free asset should have zero deviation, so the U.S
government ten years treasury bill is utilized as a risk-
free asset.
Therefore, the Rf is calculated as 0. Thirdly, S&P
500 is applied as a market portfolio because it is the
market-capitalization-weighted index of the top 500
companies in the U.S. stock market.
In addition, in order that the two stocks used as
examples can be compared relatively fairly, the
variables is reduced so that 'Close' data from June 1,
2019 to June 1, 2020 and data from June 1, 2020 to
June 1, 2021 are chosen since Luckin Coffee Inc. has
been listed on May 24, 2019.
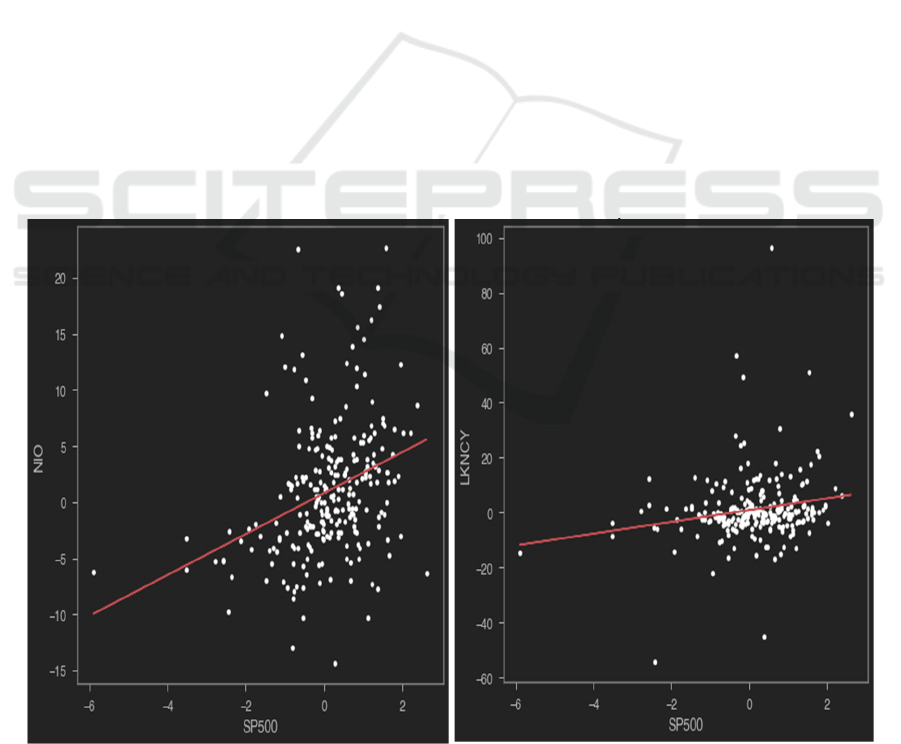
Figure 1: CAPM model applied in NIO (Left) and LKNCY(Right) in 2019-2020.
Risk of CAPM Model Apply in Chinese Concept Stocks based on Python
209
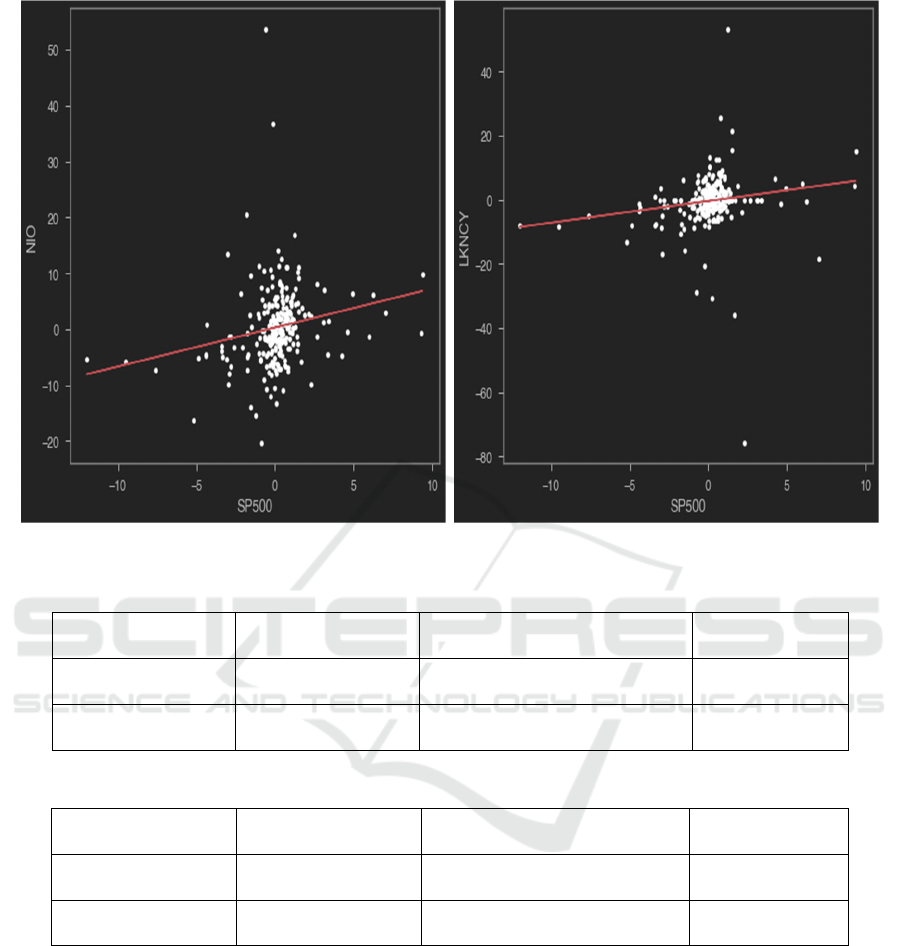
Figure 2: CAPM model applied in NIO (Left) and LKNCY(Right) in 2020-2021.
Table 1: Beta coefficient, expected return and real return of NIO and LKNCY in 2019-2020.
2019-2020 Beta expected return real return (ROR)
NIO 0.697 11.01% 34%
LKNCY 0.674 10.65% -90%
Table 2: Beta coefficient, expected return and real return of NIO and LKNCY in 2020-2021
2020-2021 Beta expected return real return (ROR)
NIO 1.824 60.92% 807%
LKNCY 2.140 71.49% 260%
According to Figure 1 and Table 1, the Beta value
of two stocks from 2019-2020 are both less than 1,
which means the price of the security less violate than
the market.
However, from Figure 2 and Table 2, the Beta
value of the two stocks are greater than 1, which
means they are more sensitive than the market.
Additionally, LKNCY is more sensitive than NIO.
The expected return of NIO for two ranges are
11.01% and 60.92% and the expect return of LKNCY
for two ranges are 10.65% and 71.49% respectively.
Besides, comparing the four sets of expected return
and real return data, the results indicate that all of
them have the varied extent of differences. The
results will be discussed in the discussion section.
4 EFFECTS OF RISK ON
COMPANY VALUE
As the model mentioned above, total risk =
systematic risk + unsystematic risk. Firstly, risks will
be categorized as market and unsystematic risks.
PMBDA 2021 - International Conference on Public Management and Big Data Analysis
210

Market risk refers to market risks that cannot be
eliminated through diversification, such as interest
rates, recession, and war. For example, in mid-March
2020, the U.S. stock market triggered a trading curb
mechanism four times separately.
As a result, the Dow Jones Industrial Average
reduced about 35%, which was the worst level in 100
years. The trading curb mechanism has been
triggered five times in the history of the U.S. stock
market and four times in 2020 alone, so this market
has performed very poorly in all such cases. Delta Air
Lines has dropped over 40% on March 19. Therefore,
when the systematic risk is relatively difficult to
avoid, when the systematic risk is high, choosing
individual stocks with a beta coefficient less than one
will be relatively less risky.
On the other hand, unsystematic risk, also known
as unique risk, is the risk associated with a particular
stock that can be eliminated by rebalancing the stock
portfolio. Take Luckin Coffee Inc as an example,
2020 April, the company admitted to a fraudulent
financial statement. There were indeed several cases
of material misstatement of financial statements
before that, however, Luckin Coffee Inc. had a
tendency to ignore the material misstatements and
Chinese companies listed in the U.S. were reportedly
not required to comply with SEC audit and disclosure
procedures because the Chinese government made
some patronizing moves (Kukreja, 2021).
Thus, Luckin Coffee Inc. has been delisted from
The Nasdaq Stock Market in 2021 June. Hence, this
demonstrates that non-systematic risk is less market
correlated, so it can be hedged by selecting several
individual stocks in different sectors in a portfolio.
5 DISCUSSIONS
The discussion part will be separated in three parts:
First, the expected return differs from the real
return in the following aspects; Second, the
assumptions with CPAM model; Third, special
situation of Chinese Concept stock.
5.1 Results from Expected and Real
Return
The results from data of 2019-2020 indicate that
when the beta coefficient is less than one, stocks are
less sensitive compare to market volatility. Therefore,
the expected return and real return of NIO in 2019-
2020 the difference is not particularly unexpected.
Moreover, LKNCY's underperformance is due to the
company's financial fraud scandal. Furthermore,
according to the results from 2020-2021 group, the
beta coefficients of both stocks are greater than one,
indicating that both stocks are significantly sensitive
to market volatility.
Also, because the U.S. stock market has
performed well since the four crashes in 2020, so both
stocks have exceeded expectations by a remarkable
amount especially for the NIO.
However, what can't be ignored is that NIO has
risen more than eight times also because the entire EV
sector stocks are hot stocks in 2020-2021. Therefore,
in the process of applying CAPM model, in order to
reduce the difference between expected and real
returns, it is also necessary to consider individual
stocks, such as the performance of its sector in the
market.
5.2 The Assumptions with CPAM
Model
Firstly, the effectiveness of CAPM models is based
on a number of rigorous assumptions. In the real
world, these assumptions are not so easily satisfied.
In principle, there is no dynamic short-selling profit
behavior since the CAPM is a single period model. In
fact, because the CAPM assumes that all investors
have the same information and risk preferences, they
all assign the same equilibrium price to assets, and
because investors can expect a negative return if they
deviate from the equilibrium price (due to the
possibility of short selling), any rational investor will
take action to avoid this behaviour.
Secondly, the model assumes that all investors are
rational, but in 2020 there are many irrational
investors in the market. In the particular case of
covid-19, with the U.S. government giving bailouts
to people and more young people losing their jobs due
to the epidemic, these young risk-takers enter the
stock market with their money like entering a casino.
They would ignore the stock's fundamentals and
enjoy more the sense of achievement of getting rich
overnight. A suitable case is Gamestop (NYSE:
GME), a company that financial performance was
almost bankrupt, the stock has been skyrocketed
because of these young irrational investors.
Thirdly, an asset's market exposure or beta,
completely explains the return on an asset in the
CAPM calculation, the market portfolio may not
explain all of ROA in the CAPM formula. In reality,
ROA may be influenced by more than just market
conditions. Their contribution to ROA will be
disregarded if we examine all other variables in the
firm's diversified risk. As a consequence, if the
Risk of CAPM Model Apply in Chinese Concept Stocks based on Python
211

ignored variables have a substantial impact on the
ROA at certain points in time, the CAPM model's
findings will be skewed.
Fourthly, under various market circumstances,
market capitalization weighting may provide
different outcomes. For example, if a significant
quantity of money flows into high-cap companies
causes the index to increase under present market
circumstances, market capitalization weighting will
be useful in positioning positions. Otherwise, if the
majority of money flows into small and mid-cap
companies, the cap-weighted strategy may miss the
rise or even lose money as a result of a downturn in
high-cap stocks.
5.3 Special Situation of Chinese
Concept Stock
The unique characteristics of Chinese stocks also
increase the risk. First, most U.S.-listed Chinese
companies have accurate and credible financial
statements, but earnings fraud is also a possible risk.
In addition to Luckin Coffee's fraudulent financial
data, 2021 Guangzhou EHang Intelligent Technology
Co. Ltd (NASDAQ: EH) was also found to have
falsified sales data after Wolfpack's investigation.
The second point is that since most Chinese
companies are based in China, there may be a lag in
information about the company's operations.
Moreover, investors who do not have an
understanding of the Chinese culture may find it
challenging to understand the company's operations,
such as the reasons for Bilibili's (NASDAQ: BILI)
large number of young users, in addition to the public
information about the company. Therefore, this
information inequality increases unsystematic risk.
6 SUGGESTIONS
The CAPM methodology's disadvantage is that the
analytical model is overly subjective, and the data is
dependent mainly on analysts' projections for future
growth.
As a result, a sensitivity analysis will be an
essential component of the CAPM model study. In
addition, in the application of the CAPM model to
Chinese stocks, apart from using historical data to
calculate expected returns, more consideration should
be given to non-systematic risk factors such as the
truthfulness of financial statements.
So, investors may want to hedge risk by choosing
multiple different types of stocks or by buying
Chinese concept stocks that have been established for
a long time and have a large user base in China.
7 CONCLUSIONS
In conclusion, the study uses data from two Chinese
Concept stocks compare with S&P 500 by applying
the CAPM model formula and contrasts expect the
return and real return to analyse the risk of the CAPM
model in two types. Despite the CAPM model's
numerous flaws in fitting actual data, the CAPM
model's correct derivation procedure and essence as
an equilibrium model define its place in the area of
financial economics. In applying this model to
Chinese Concept stocks, more consideration needs to
be given to the non-systematic risks associated with
unique attributes. The limitation of this study is the
inadequacy of the sample data and the fact that the
politics of China and the U.S. are not considered at
risk. More researches need to be done in the future.
ACKNOWLEDGMENT
I would like to thank Associate Prof. Colleen
Honigsberg for her insightful academic support.
Finally, I would like to provide profound gratitude
to my parents for providing me with unfailing
support.
REFERENCES
Black, F. (1972). Capital Market Equilibrium with
Restricted Borrowing. The Journal of Business, 45(3),
444–454. https://doi.org/10.1086/295472
Dempsey, M. (2012). The Capital Asset Pricing Model
(CAPM): The History of a Failed Revolutionary Idea in
Finance? Abacus, 49(S1), 7–23.
https://doi.org/10.1111/j.1467-6281.2012.00379.x
Gençay, R., Selçuk, F., & Whitcher, B. (2005). Multiscale
systematic risk. Journal of International Money and
Finance, 24(1), 55–70.
https://doi.org/10.1016/j.jimonfin.2004.10.003
Lintner, J. (1965). The Valuation of Risk Assets and the
Selection of Risky Investments in Stock Portfolios and
Capital Budgets. The Review of Economics and
Statistics, 47(1), 13–47.
https://doi.org/10.2307/1924119
Markowitz, H. (1967). Portfolio selection: efficient
diversification of investments. New York: J. Wiley.
Mossin, J. (1966). Equilibrium in a Capital Asset Market.
Econometrica, 34(4), 768–783.
https://doi.org/10.2307/1910098
PMBDA 2021 - International Conference on Public Management and Big Data Analysis
212

Sharpe, W. F. (1964). CAPITAL ASSET PRICES: A
THEORY OF MARKET EQUILIBRIUM UNDER
CONDITIONS OF RISK*. The Journal of Finance,
19(3), 425–442. https://doi.org/10.1111/j.1540-
6261.1964.tb02865.x
Risk of CAPM Model Apply in Chinese Concept Stocks based on Python
213
