
Analysis of Airport Taxi Problem based
on M/Ek/1 Queuing Model
Jie Huan
1
, MengQing Xiao
2
and YuQian Zhao
3
1
Institute of Collaborative Innovation, University of Macau, Macau, China
2
Institute of Accounting, Tianjin University of Finance and Economics, Tian Jin, China
3
Institute of mathematics and statistics Hebei University of Economics and Business,Shi Jiazhuang, China
Keywords: Taxi Queuing Theory M/Ek/1 Model, Lingo.
Abstract: The abstract should summarize the contents of the paper and should contain at least 70 and at most 200 words.
It should be set in 9-point font size, justified and should have a hanging indent of 2-centimenter. There should
be a space before of 12-point and after of 30-point. Nowadays, with the growth of the number of private cars
and the number of taxis, the problem of taxi queuing in the airport transportation system needs to be solved
urgently. This paper combines the M/Ek/1 service model in queuing theory (Qie, Wang 2007), effectively
proposed to establish a decision model for the taxi waiting for passengers or no-load return journey, and the
actual airport information verification model is more reasonable.
Scheme A and Scheme B decisions were made by comparing the time costs. Under Scheme A, because the
taxi arrival time follows the parameter of 𝜆 Poisson distribution and the ride service time follows the Erlang
distribution of 𝑘 order, the M/Ek/1 queuing model can be established to list the system equation of state
through the relationship between the total exponential service steps j in the system and the probability
distribution of k customers in the system. Then the parent function is introduced, and finally the average
waiting time of the passenger is 𝑊
=
()
()
, set the time cost of no-load backhaul in scheme B is Q, when
Wq <Q, scheme A, and when Wq> Q, scheme B.
Shanghai Pudong Airport and Shanghai taxi data were selected for model test until reasonable. The results
were calculated using Lingo to compare the time hours required for schemes A and B. The length of Scheme
B can be calculated from the speed of taxi driving on the Shanghai viaduct and the urban speed of Scheme B
is 1.1917 hours. When the time required of Scheme A is less than 1.1917 hours, Scheme A is selected,
otherwise Scheme B.
The M/Ek/1 queuing model established in this paper avoids the limitations of negative exponential distribution
and can be more applicable to multiple serial processes, or if no memory assumption is not significant;
queuing theory can not only solve the taxi queuing problem, but also has broad applications in medical and
communication fields.
1 INTRODUCTION
A large number of tangible or invisible queuing or
crowded phenomenon as a common life problem,
such as restaurant dining queuing problems, banking
business queuing problems and so on. AS the
economic growth increases and the number of private
cars increases, the road traffic queuing phenomenon
is particularly common. Queuing theory has been
widely used in communication systems, storage
systems, etc.
Production management and other aspects play an
important role, queuing theory for the transportation,
especially the taxi queuing problem research.
Through the statistical study of the arrival time
and the arrival time of taxi drivers, the statistical law
of the waiting time of taxi drivers and passengers and
the peak of taxi passengers are obtained. Then,
according to these laws, we can improve the taxi
queuing problem at the airport terminal or make
decisions for taxi drivers, so that not only taxis can
carry passengers efficiently, but also solve the
problem of passenger retention at the airport.
Huan, J., Xiao, M. and Zhao, Y.
Analysis of Airport Taxi Problem based on M/Ek/1 Queuing Model.
DOI: 10.5220/0011154500003437
In Proceedings of the 1st International Conference on Public Management and Big Data Analysis (PMBDA 2021), pages 191-196
ISBN: 978-989-758-589-0
Copyright
c
2022 by SCITEPRESS – Science and Technology Publications, Lda. All rights reserved
191
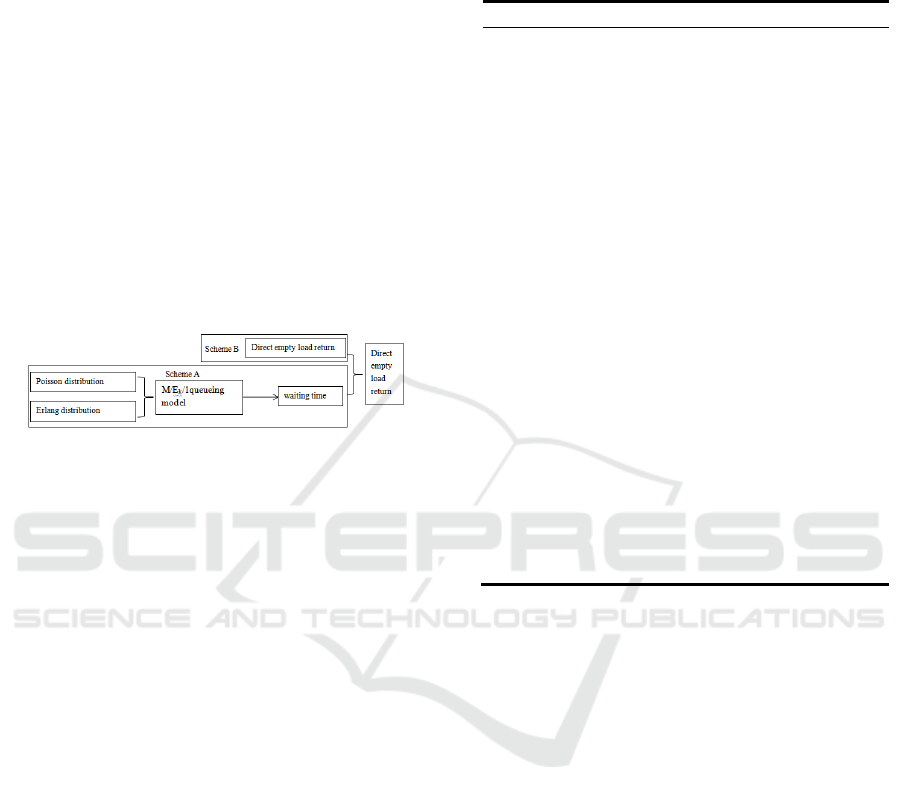
In the problem of queuing in the airport terminal,
the taxi said that the drivers have two schemes: A and
B, to choose. The two schemes compare the waiting
time, and the short time, the time cost is low, which is
selected as the final decision plan. In the case of
scheme A, the taxi is relatively free, can approximate
the Poisson distribution, the time of the taxi is
independent (Wang, Shi, Wang 2015) so
approximately obey the Erlang distribution, from the
traditional M/M/1 waiting system queuing model can
be optimized to the M/Ek/1 queuing model system,
introduce the parent function, using the L'Hopital law
to remove the waiting time. In scenario B, the taxi
driver will immediately return with an empty load,
and the time cost is the return time (or plus the empty
load in the urban area Between). Comparing the two-
time costs gives the selection strategy. As shown in
Figure1:
Figure 1: Scheme selection flow chart.
This question selects Shanghai Pudong airport
taxi data and airport traffic data, using LINGO and
MATLAB software simulation calculation, intercept
a day (with peak and stationary period) for the
research period, bring data into the problem of the
decision results, and analyze the accuracy and
rationality of the results, and discuss the correlation.
2 MODEL ESTABLISHMENT
2.1 Model Hypotheses
1. Suppose that taxis and passengers are generally
unlimited.
2. Suppose that the passenger arrival is
independent of each other (Xue 2004).
3. Taxi and passengers wait (queue without
leaving).
4. Suppose that the number of passengers arriving
is subject to the Poisson distribution (Tang 2017) (the
passengers waiting for the taxi are stable and
ineffective, Ordinary), the service time follows the
Erlang distribution (can represent the time interval of
independent events, good fitting effect).
5. Suppose the driver drives freely, not affected by
the weather, and the traffic flow is smooth.
2.2 Representation of Symbol
Table 1: representation of symbol.
symbol meanings
s
L
Team length: the total number
of taxis in the car storage pool
q
L
Length: Number of taxis in the
storage pool
s
W
Stay time: the time that the taxi
stays in the storage pool
q
W
Line up time: the time the taxi
waits in the storage pool
λ
Taxi reach rate per unit of time
μ
Number of taxis completing the
service per unit of time
ρ
Average service time per unit of
service desk time
Q
Access capacity of taxi point
(vehicle / hour)
h
Average taxi stop time
(boarding time and getting in
and out the sum of points)
b
N
Number of valid berths
R
To offset the reduction
coefficient of the docking time
fluctuations, it is usually taken
R = 0.833
2.3 Establishment of Model
The arrival time of the taxi camera follows the
Poisson distribution with the parameter, the number
of stations of the passenger boarding point is 1 (Geng,
Song, Zhao 2013), and the service time is abstract as
the time interval of independent random events, so it
follows the Erlang distribution of order k; the
passenger arrival time can be abstracted as random,
thus approximating the Poisson distribution. Using
the Poisson distribution and the Erlang distribution,
the M/Ek/1 queuing model can also be established to
form the queuing system of the airport and make a
state transfer diagram to list the probability
distribution of the exponential service steps j in the
system and the probability distribution of k customers
in the system. According to the dynamic transfer
diagram, we can list the system transfer equation. It is
then solved by introducing the parent function (Baidu
Encyclopedia 2019).
PMBDA 2021 - International Conference on Public Management and Big Data Analysis
192
3 MODEL SOLUTION
3.1 Model Solution Process
The copyright form is located on the authors’ reserved
area.
The form should be completed and signed by one
author on behalf of all the other authors.
Taxi arrival time is assumed to obey the Poisson
distribution of the parameters, and the probability
distribution function is:
()
() ,( 0)
!
n
t
t
Pt t
n
λ
λ
λ
−
=≥
Taxi service time follows the Erlang distribution
of k, and its probability distribution function is:
1
()
() ,( 0)
(1)!
k
kt
kkt
ft e t
k
μ
μμ
−
−
=≥
−
Each taxi in the system leaves the system after the
k-step index service and is set in the time t system
The number of car rental is n, and the number of
service steps at the time t index is j.
Record P
j
= P {The total number of exponential
service steps in the system is j} ; P
k
=P {There are
k cars out of the system}, The relation
for these two
quantities is:
(1)1
,( 1,2,3, )
nk
kj
jn k
PPk
=− +
==Λ
The following system equations of state are listed
by the state transfer diagram:
01
1
,( 1,2,3, )
()
jjk j
PkP
j
kP P kP
λμ
λμ λ μ
−+
=
=Λ
+=+
Because the variables in this model are all non-
negative integers, the concept of the probability
mother function is introduced, let's consider:
0
()
j
j
j
Pz Pz
∞
=
=
Type (1) is available thus:
𝑃(𝑧) =
()
()
(1)
Definition is given by the probabilistic mother
function P (z)= 1,we can get(2):
(2)
then
:
0
11 1P
λ
ρ
μ
==− =−
Cut off(1-z)and
k
μ
Type (3) is available by the partial split method
𝑃(𝑧) =
(
Λ
)
=
(
)(
)Λ(
)
=(1−𝜌)
∑
𝐴
/(1 −
) (3)
Among
12
,,,
k
zz zΛ
are the root of the denominator
polynomial, and have:
1
1,
1/(1 )
k
nni
n
z
Ai
z
=≠
=−
∏
Expand Type (3) and compare the coefficient to
get that the taxi reaches the car storage pool and find
the car storage pool. The probability of j cars already
inside:
1
(1 ) ( ) , ( 1, 2, 3, )
k
j
jii
i
PAzj
ρ
−
=
=− = Λ
The average service time of a taxi is the average
pickup time is 1/k
μ
The average taxi pickup time for
j taxis is j/k.
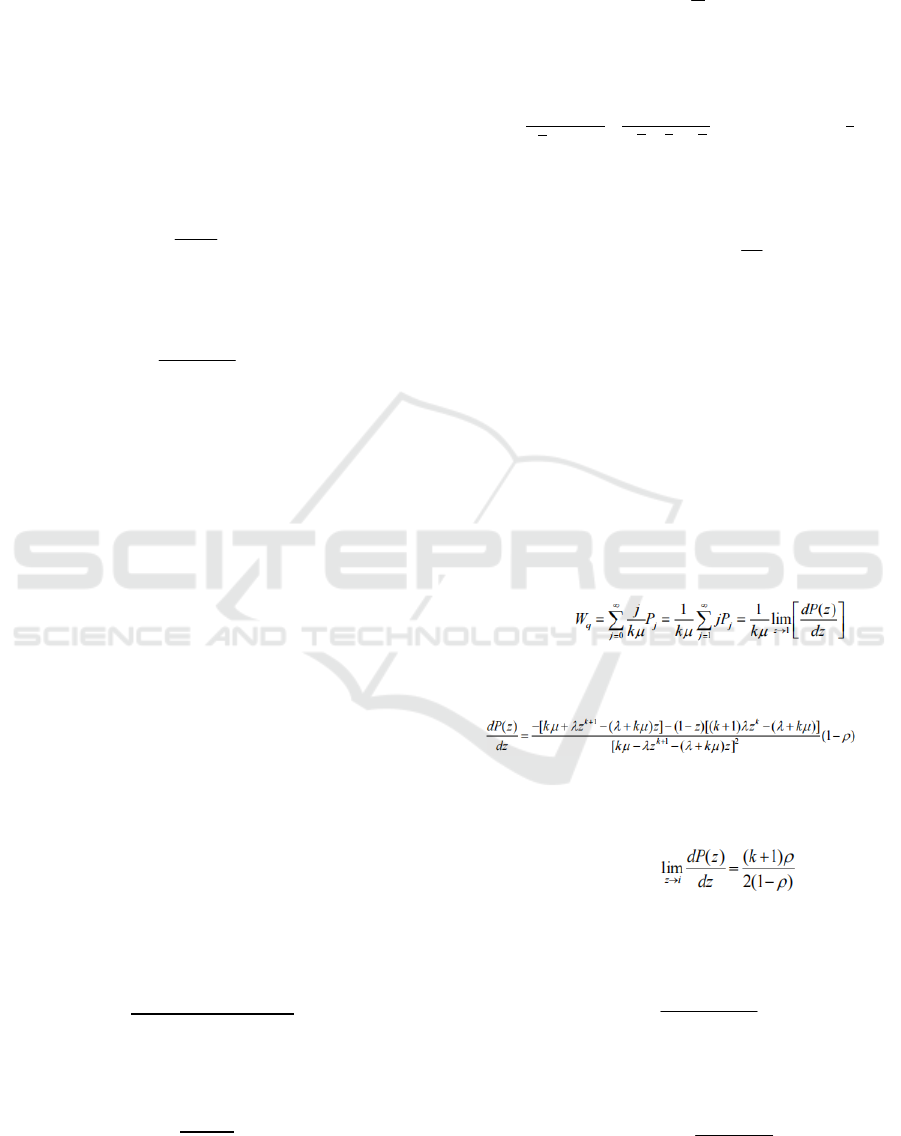
Therefore, the average waiting time required for a
new taxi to receive guests is type (4):
(4)
For z to derive formula (5):
(5)
When z →i ,we can use the Lobida rule to get
the (6) formula:
(6)
From types (4) and (6): the average queuing time
of the taxi in the storage pool
q
W
2
(1)
2(1 )
q
k
W
k
ρ
μρ
+
=
−
The average number of taxis queuing in the
storage pool Lq:
2
(1)
2(1 )
qq
k
LW
k
ρ
λ
ρ
+
==
−
Analysis of Airport Taxi Problem based on M/Ek/1 Queuing Model
193
Therefore, the waiting time for Scheme A is W
s
, if
the wasted time cost of the taxi going directly empty
to the city in Scheme B is Q.
3.2 Results Discussion
Let the waiting time of the taxi in the storage pool be
t
1
,t
1
=Ws;In Scheme B, the taxi to return directly to
the city is t
2
,the cost of no-load loss is D(D < 0).
When t
1
< t
2
,that is, the taxi waiting time in the
storage pool is shorter than the return to the city
directly empty load, at this time, in the min (t
1
, t
2
)
period, the income of Scheme A is 0, while Scheme B
income D. At this time, the taxi driver chooses
Scheme A, that is, the taxi queue to the designated car
storage pool and queue into the passengers according
to "come first to arrive".
When t
1
> t
2
,that is, the taxi waits longer in the storage
pool than to the city directly on empty load During
the max (t
1
, t
2
) time period, the return of Scheme A is
0, while the return of Scheme B is unknown and
requires further discussion:
let t
3
=t
2
-t
1
1.In t
3
period, if the taxi cannot receive the guest,
scheme B proceeds to D (D < 0) ,At this time,
scheme A income is 0, so scheme A is selected.
2.In t
3
period, if the taxi receives the customer,
set the taxi manned income is Q, then the scheme B
income is (D+Q). When D+Q > 0, we select Scheme
B, and vice versa, Scheme A.
4 MODELLING VERIFICATION
Select Shanghai Pudong Airport and collect the
relevant data of Shanghai taxi as shown in Table 1.
According to the official website of Shanghai Pudong
Airport, the taxi charging standard is as follows:
Table 2: Taxi Charging Standard in Shanghai.
daytime(05:00-
23:00)
nighttime(
23:00-05:00)
0-3
kilometers
14 CNY 18 CNY
3-10
kilometers
2.5 CNY / km 3.1 CNY / km
More
than15
kilometers
3.6 CNY/ km 4.7 CNY / km
Referring to the data of the "Third Comprehensive
Traffic Survey Report of Shanghai", we learned that
the empty driving rate of Shanghai district in 2004
was 39%, the total daily mileage was 9.5 million
kilometers, and the service number was 1.493 million
/ day.
It is calculated that the average daily mileage per
taxi is 6.36 kilometers, and the average daily mileage
per hour is 0.265 kilometers, and about 14 CNY and
18 CNY per hour between day and night. Shanghai
Pudong Airport is about 55 kilometers away from the
city center (Wu, Zheng, Deng 2009). Taxi vehicles
use no. 93 gasoline, consuming an average of 8 liters
per 100 km and 7.55 CNY per liter. Therefore, the
one-way oil cost from downtown to the airport is
33.22CNY. It can accommodate 10 taxis at the same
time.
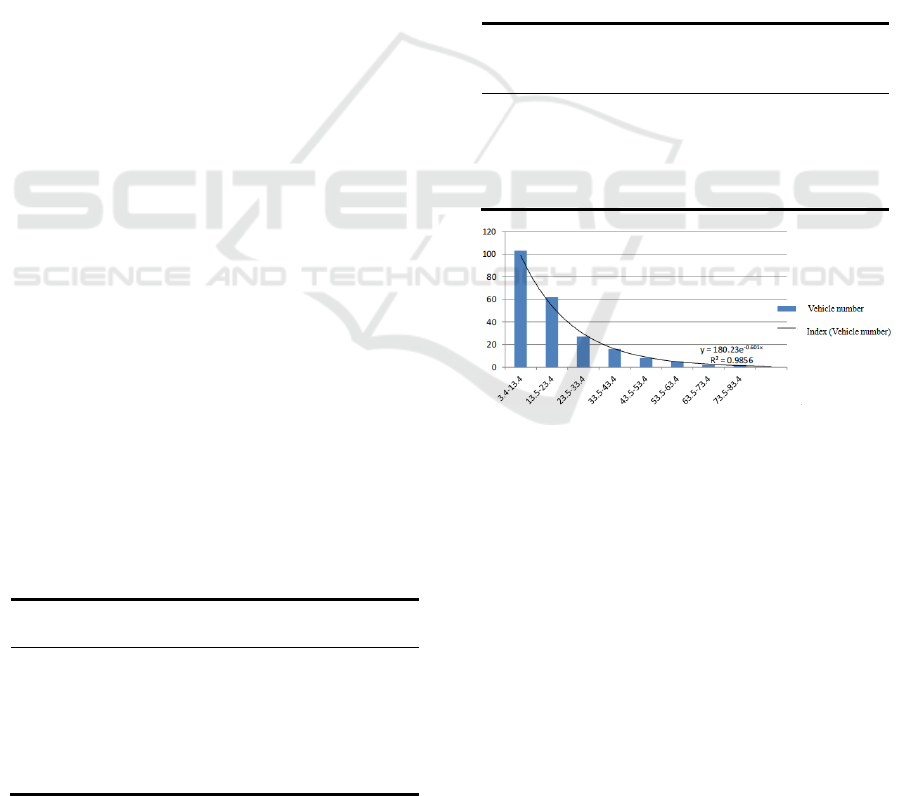
Table 3: Passenger boarding time and frequency table.
Time
interval
(s)
Number of
Vehicles
(Units)
Time
interval
(s)
Number of
Vehicles
(Units)
3.4-13.4 103 43.5-53.4 8
13.5-23.4 62 53.5-63.4 5
23.5-33.4 27 63.5-73.4 2
33.5-43.4 16 73.5-83.4 2
Figure 2: Time and frequency distribution diagram of
passengers' boarding time (Sun, Ding, Chen 2017).
The time frequency distribution of passenger
boarding is shown in Table 2, the data are analyzed
by Excel to approximate the exponential distribution,
and the variance of the above 225 random variables is
0.876, and the passenger boarding time
approximately follows the exponential distribution of
the mean 15, the passenger boarding time frequency
distribution diagram is shown in Figure 2.
PMBDA 2021 - International Conference on Public Management and Big Data Analysis
194
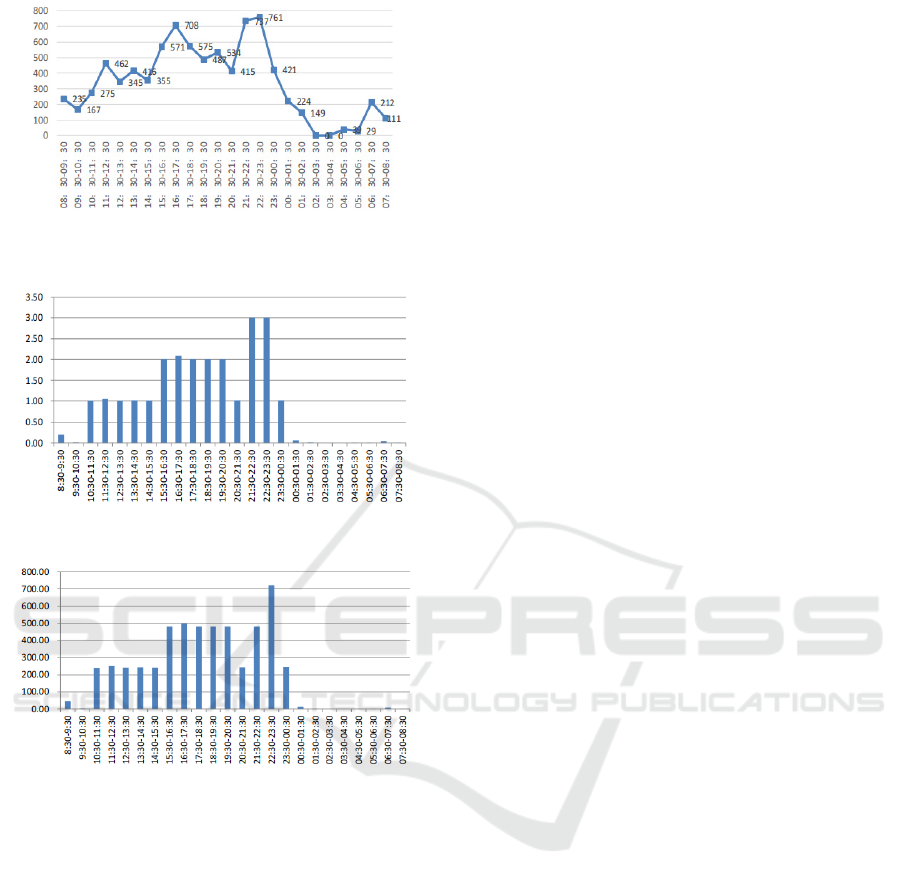
Figure 3: Taxi flow distribution map of Shanghai Pudong
International Airport within one day (Yan 2015).
Figure 4: Taxi waiting time in the car storage pool(h).
Figure 5: Number of vehicles in the vehicle storage pool.
The actual data of Shanghai Pudong Airport will
be brought in Fig. 3, Fig.4 and Figure 5 into the
model, with two schemes A and B. The time-
consuming scheme of 1.1917 is the priority decision
model, and according to the Lingo calculation results,
scheme A is the following period:
14:30-15:30, 9:30-10:30, 10:30-11:30, 11:30-12:30,
12:30-13:30, 13:30-14:30, 8:30-9:30, 20:30-21:30,
23:30-00:30, 00:30-01:30, 01:30-02:30, 02:30-03:30,
03:30-04:30, 05:30-06:30, 04:30-05:30, 06:30-07:30,
07:30-08:30.
Select Scheme B for the rest of the period.
5 CONCLUSIONS
The simple negative exponential distribution is
broken through in the model establishment, so that the
service time of the passengers is basically subordinate
to the Erlang Distribution, with a better fit (Lin 2018),
reduces the model error. Select the queuing theory in
operation research, the statistical rules can be
analyzed with the calculated statistical indicators, and
then improve the service system structure according
to these rules, or reorganize the served object, so that
the service system can not only meet the needs of the
service object, but also achieve the optimization of
some indicators of the organization. The M/E
k
/1
model of queuing theory can not only compute the
statistics, but also optimize the subsequent results (Li
2014), and optimize the overall service level of the
model with the marginal analysis method, dynamic
planning and other methods.
The longitudinal generalization of the model is
extended through the M/E
k
/1 waiting queuing model,
to the queuing model of multi-service desk, M/M/S/
∞ model (Wu, Li, Liang 2012), with multiple service
desks, and customers can receive service immediately
with free service desk. To continue to improve the
model complexity, we can build the M/M/S/K hybrid
model, which can solve the queuing problem of the
loss system, which is more in line with the actual
situation.
Horizontal promotion: queuing theory can be
widely used in the medical field, banking service
system, airport security check system, campus
express peak service system, college students'
canteen dining problems and so on. For example,
through considering the problem of dining in the
college students' canteen, deduce the peak period of
students during the class, count the number and
location of the canteen Windows, and get the
rationalization suggestions for the canteen service
after the queuing model.
REFERENCES
Baidu Encyclopedia. Pudong Airport Terminal 2 Shanghai
taxi charging standard [OL]. (2019-0913).
https://www.shanghaiairport.com/cn/jcjt/index_53191.
html.
Geng Zhongbo, Song Guohua, Zhao Qi, et al. Capital
Airport taxi passenger scheme based on VISSIM study
[J]. Journal of Civil Aviation University of China,
2013,31 (6): 55-59.
Analysis of Airport Taxi Problem based on M/Ek/1 Queuing Model
195

Lin Sirui. Research on Demand Forecdiction of Airport
Taxi [D]. Chengdu: University of Electronic Science
and Technology, 2018.
Li Xiangming. Urban congestion control countermeasures:
Study on closed community traffic opening [D]. Hunan:
Changsha Li Polytechnic University, 2014.
Qie Jiuxia, Wang Qirong. The M / Ek / 1 Queueing Model
and its Application in Traffic Design [J]. Sichuan
building. 2007, 27(1):15-16.
Sun Jian, Ding Rijia, Chen Yanyan. Modeling and
simulation of single-lane taxi passenger system based
on queuing theory [J]. System Simulation Journal.
2017,29(5):996-1004.
Tang Quan. Application analysis of MATLAB software in
mathematical modeling [D]. Hubei: Hubei traffic
professional technology College of Surgery. 2017.
Wu Qizong, Zheng Zhiyong, Deng Wei. Operations
Research and Optimal MATLAB [M]. Beijing:
Machinery industry publishing organized body,2009.
Wang Yuying, Shi Jiarong, Wang Jianguo, et al.
Mathematical modeling and its software
implementation [M]. Beijing: Tsinghua University is
out edition Press Publishing, 2015.
Wu Jiarong, Li Ming, Liang Lijuan. Comprehensive
management mode and efficiency analysis of passenger
taxi in passenger transport hub [J]. Traffic information
and safety. 2012,30(4):18-23.
Xue Yi. Mathematical modeling basis [M]. Beijing: Beijing
University of Technology Press, 2004.
Yan Chao. Takes Pudong International Airport as an
example [D]. Shanghai: East China Normal University:
2015.
PMBDA 2021 - International Conference on Public Management and Big Data Analysis
196
