
An Analysis of the Relevance between the Transition of Japan's
Population Structure and Economic Growth:
Based on Grey Relational Model
Chunwei Mu
1a
and Fenggang Du
2b
1
School of Marxism, Dalian University of Technology, Dalian, China
2
School of Foreign Languages, Dalian University of Technology, Dalian, China
Keywords: Population Structure Transformation; Economic Growth; Grey Correlation Degree.
Abstract: Through the grey correlation analysis of the relevant index data of Japan's population structure and economic
growth from 1998 to 2018, it is found that the population age structure, gender structure and population
industrial structure are related to the comprehensive economic system. According to the research results, on
the basis of summarizing the experience of Japan's economic development, this paper puts forward some
countermeasures and suggestions for the coordinated development of China's population and economy.
1 INTRODUCTION
In recent years, some scholars have studied the
relationship between Japan's population structure and
economic growth. Min Lu, Fang Cai (Lu 2014)
believed that the impact of demographic changes on
the potential growth rate. After the 1990s, Japan's
demographic dividend disappeared, the absolute
number of its working age population decreased, and
the population dependency ratio increased. Through
direct and indirect ways, the transformation of
demographic structure led to the rapid decline of
Japan's potential growth rate after the 1990s.
Xiaofeng Wang, Xueli Ma (Wang 2015) based on the
data of economic growth and population age structure
changes since Japan entered the aging society, by
decomposing the contributing factors of economic
growth, pointed out that the improvement of labor
productivity is the main driving force of Japan's long-
term economic growth, and the reduction of working
age population will become an important structural
factor that has plagued Japan's economic growth for a
long time. Dangchen Sui etc (Sui 2020) research
found that Japan’s demographic transition has
undergone the first demographic dividend and the
second demographic dividend development stage,
and the declining birthrate and aging population have
a
https://orcid.org/0000-0003-1817-7480
b
https://orcid.org/0000-0001-6136-2425
become more and more serious. This change in the
demographic structure has had a greater impact on
Japan’s labor supply, savings, consumption and social
security system, and has hindered Japan’s economic
growth to a certain extent. Judging from the current
research, the impact of Japan's population structure
on economic growth is mainly concentrated on the
adverse effects of the population age structure,
especially the disappearance of the demographic
dividend and the increasing aging of the economy.
Changes in population structure not only refer to
changes in age structure, but also include sex ratio
structure, population industry structure, etc. These
elements are relatively lacking in previous literature
studies.
Based on the current research status, this paper
takes Japan as the research object, Study
demographic changes The relationship between (age
structure, sex ratio structure, industrial structure etc)
and economic growth is analyzed by using the grey
correlation analysis method. In view of the similarity
between China's population structure transformation
and economic growth model and Japan, at the end of
this paper, based on the experience and training of
Japan, this paper puts forward some countermeasures
and suggestions for the coordinated development of
China's population and economy.
Mu, C. and Du, F.
An Analysis of the Relevance between the Transition of Japan’s Population Structure and Economic Growth: Based on Grey Relational Model.
DOI: 10.5220/0011153800003437
In Proceedings of the 1st International Conference on Public Management and Big Data Analysis (PMBDA 2021), pages 181-186
ISBN: 978-989-758-589-0
Copyright
c
2022 by SCITEPRESS – Science and Technology Publications, Lda. All rights reserved
181
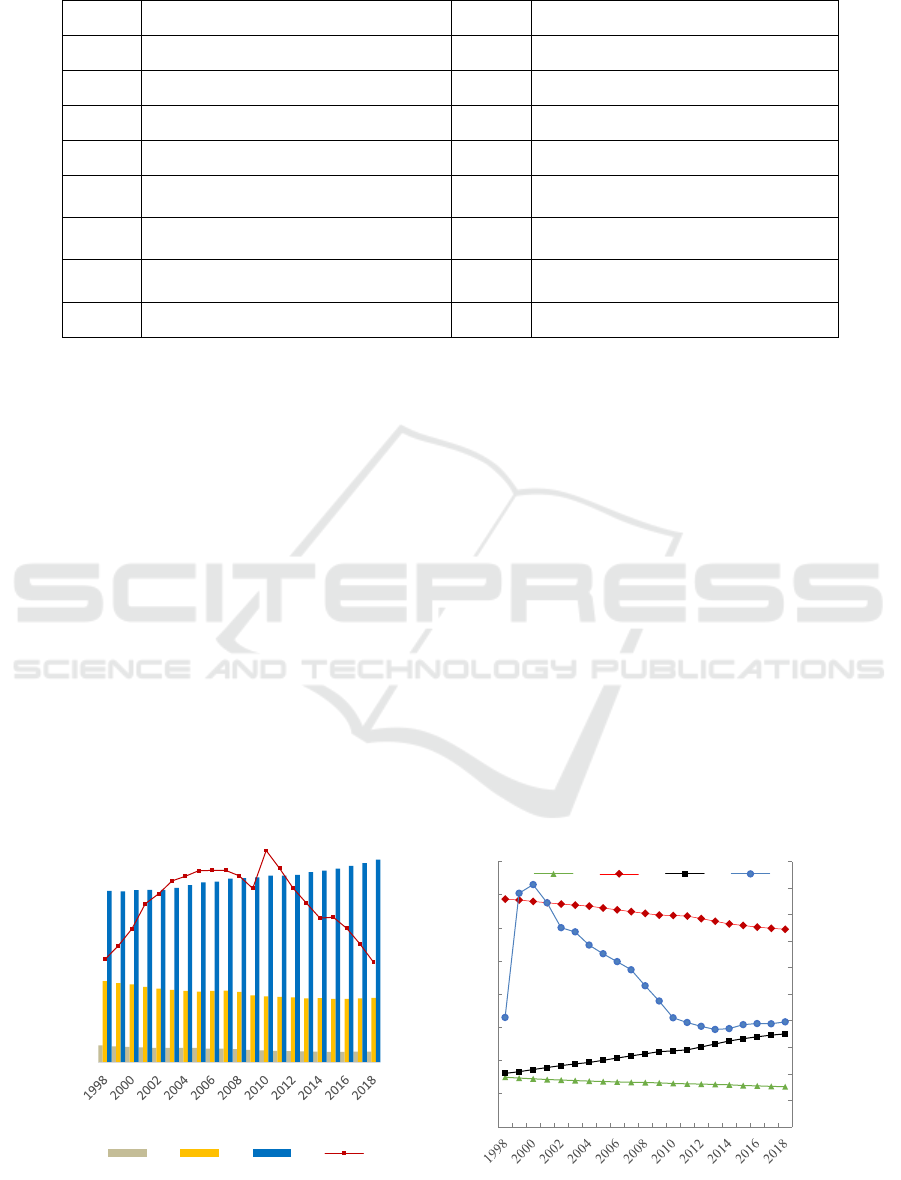
Table 1: Indicators and codes.
index index
X1
Proportion of population under 14
Y1 GDP
X2 Proportion of population aged 15-64 Y2 Output value of primary industry
X3 Proportion of population over 65 Y3 Output value of secondary industry
X4 Sex ratio Y4 Output value of tertiary industry
X5
Number of employees in the primary
industr
y
Y5 Average household income
X6
Number of employees in the secondary
industry
Y6
Per capita income of families with
children
X7
Number of employees in the tertiary
industry
Y7 Per capita income of elderly families
X8 Total population
2 DATA SOURCES & RESEARCH
METHODS
2.1 Selection of Indicators and Data
Description
This paper takes the relevant data of Japan's
population and economy from 1998 to 2018 as a
sample to analyze the impact of population structure
changes on Japan's economic growth. The selected
indicators and codes are shown in Table 1.
Among them, the units of X1-X4 are %, the units
of X5-X8 are 10000 person, the units of Y1-Y4 are 1
billion yen, and the units of Y5-Y7 are 10000 yen.
The data selected in this paper comes from the
Japanese government statistics portal e-stat.
2.2 Establishment of Model
This study uses the grey correlation analysis method
to analyze the correlation between population
structure and economic growth. According to the grey
system theory, the grey correlation analysis method
mainly calculates the closeness of different data
sequences in a certain period, and then analyzes the
main and secondary factors affecting the system
change. Grey correlation analysis has the unique
advantages of requiring less sample data and low
requirements for data distribution characteristics,
which other mathematical statistics methods do not
have (Yuan 1991).
The specific steps are as follows:
1) Dimensionless processing of variable data. Due
to
different indicator units and different data
Figure 1: Population structure data of Japan from 1998 to 2018.
12500
12530
12560
12590
12620
12650
12680
12710
12740
12770
12800
12830
0
1000
2000
3000
4000
5000
6000
X5 X6 X7 X8
0,94
0,942
0,944
0,946
0,948
0,95
0,952
0,954
0,956
0,958
0,96
0
10
20
30
40
50
60
70
80
X1 X2 X3 X4
PMBDA 2021 - International Conference on Public Management and Big Data Analysis
182
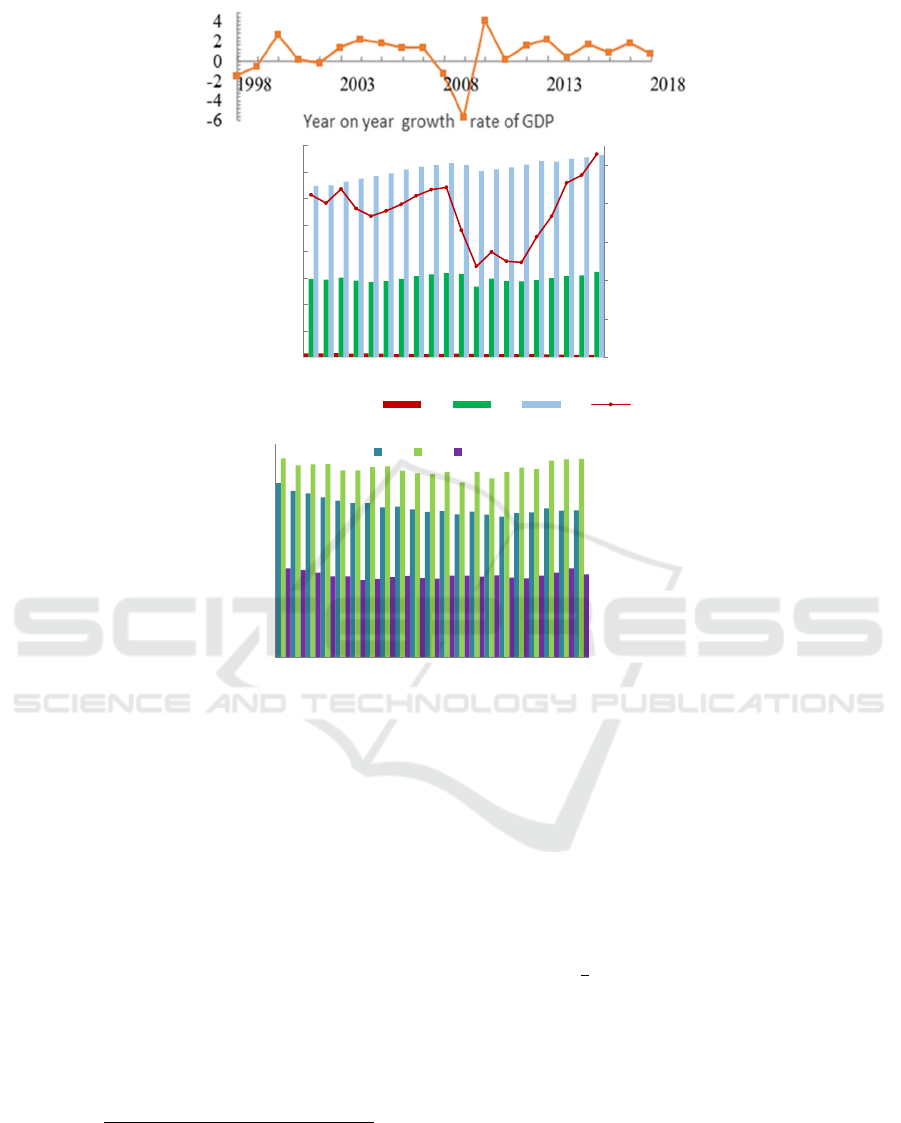
Figure 2: Data of Japan's economic structure from 1998 to 2018.
dimensions, dimensionless data processing is
required before correlation analysis. The common
dimensionless processing methods mainly include
extremum, standardization, mean and standard
deviation. Standardized treatment is adopted in this
paper:
𝐹
𝑋
𝑋
𝑚𝑎𝑥𝑋
𝑚𝑖𝑛𝑋
(1)
2) The coupling correlation degree model of
population structure and economic system is used to
measure the relationship between population
structure and economic growth. The calculation
formula of correlation coefficient is as follows:
𝜉
𝑠
|
|
|
|
|
|
|
|
(2)
Note: 𝜉 is the correlation coefficient between the
p-th population structure and the q-th regional
economic index in Japan at time s; 𝑋
𝑠、𝑌
𝑠 are
the standardized values of Japan's population
structure at time s and the economic indicators of the
q-th region; 𝜌 is the resolution coefficient, generally
0.5. After averaging the correlation coefficient
according to the sample number k, the correlation
degree matrix can be obtained, which reflects the
correlation between population structure and
economic growth. The expression of correlation
degree is:
𝛾
∑
,,⋯⋯,
,
(3)
3 RESULTS & DISCUSSIONS
This study selects 2018 cross-sectional data, and
through the comparative analysis of the correlation
degree, the correlation degree between the relevant
factors in the population structure and the economic
system relationship is obtained (the value is between
0 and 1); when the correlation degree takes the
maximum value of 1, it is explained A certain
450000
470000
490000
510000
530000
550000
0
50000
100000
150000
200000
250000
300000
350000
400000
1998 2000 2002 2004 2006 2008 2010 2012 2014 2016
Y2 Y3 Y4 Y1
0
100
200
300
400
500
600
700
800
1998 2000 2002 2004 2006 2008 2010 2012 2014 2016 2018
Y5 Y6 Y7
An Analysis of the Relevance between the Transition of Japan’s Population Structure and Economic Growth: Based on Grey Relational
Model
183

indicator of the population structure system has
exactly the same change law between a certain
indicator of the regional economic system; when the
value of the correlation degree is between 0 and 1, it
indicates that there is a correlation, and the correlation
increases with the increase of the value. The reverse
is also true; when the correlation degree is between 0-
0.35, the two systems are low correlation; when the
correlation value is between 0.35-0.65, the two
systems are medium correlation; when the correlation
degree is between 0.65-0.85 Sometimes, the two
systems are highly correlated; when the correlation
degree is between 0.85-1, the two systems are highly
correlated.
Table 2: Correlation coefficient matrix between population structure system and economic indicators.
ξ Y1 Y2 Y3 Y4 Y5 Y6 Y7 Average
X1 0.3764 0.8988 0.3814 0.3958 0.6455 0.4026 0.5188 0.5170
X2 0.3573 1.0000 0.3618 0.3748 0.5915 0.3809 0.4833 0.5071 0.5847
X3 0.9991 0.3572 0.9655 0.8839 0.4742 0.8518 0.5779 0.7299
X4 0.4217 0.7152 0.4279 0.4462 0.7914 0.4549 0.6090 0.5523 0.5523
X5 0.4011 0.7835 0.4068 0.4232 0.7218 0.4310 0.5670 0.5335
X6 0.4180 0.7260 0.4242 0.4421 0.7786 0.4506 0.6015 0.5487 0.5769
X7 0.8636 0.3382 0.8384 0.7761 0.4413 0.7513 0.5298 0.6484
X8 0.3546 0.9787 0.3590 0.3718 0.5839 0.3777 0.4783 0.5006 0.5006
Average 0.5240 0.7247 0.5206 0.5142 0.6285 0.5126 0.5457 0.5672 0.5536
Table 2 shows the correlation coefficient matrix of
Japan's population structure system and economic
system calculated by formulas. It can be seen from the
correlation coefficients between the indicators of the
two systems that they all belong to a medium or above
medium correlation, which shows that there is a close
relationship between the two systems:
First, the correlation coefficients between the
various indicators of the population age structure and
the comprehensive economic system are all around
0.5. Among them, the proportion of children aged 0-
14 (X1) and the proportion of youth aged 15-64 (X2)
are related to the comprehensive economic system.
The correlation coefficient of X3 is relatively small,
but the correlation coefficient between the proportion
of the elderly over 65 years old (X3) and the
comprehensive economic system is relatively large,
that is, it has the greatest economic effect. It can be
seen from Table Ⅱ that the proportion of elderly
people over 65 years old (X3) and the comprehensive
correlation coefficient of the economy have reached
0.7299, which has reached a relatively high degree of
correlation. The impact of the proportion of the
elderly over 65 (X3) on the economy is mainly
reflected in the GDP (Y1) and the secondary industry
(Y3), of which the correlation coefficient between it
and the GDP (Y1) has reached 0.9991, indicating that
the proportion of the elderly over 65 (X3) and the
GDP The variation law between (Y1) is basically the
same.
Second, the correlation coefficient between the
population sex ratio (X4) and the comprehensive
economic system is 0.5523, which has reached a
medium degree of correlation. The correlation
coefficient between population sex ratio (X4) and per
capita household income (Y5) is up to 0.7914.
Third, from the correlation coefficient matrix of
population structure system and economic system, it
can be seen that the average coefficient of population
industrial structure index and economic
comprehensive system index is 0.5763. Among them,
the average correlation coefficient between the
tertiary industry population (X7) and economic
system indicators has reached 0.6484, indicating that
there is a medium correlation between the tertiary
industry population (X7) and the economic system,
and it reflects the development of the tertiary industry
population It has a greater impact on the economy,
that is, the tertiary industry plays an important role in
the entire economy.
Finally, it can be seen from the correlation
coefficient matrix of population structure system and
economic system, the average correlation coefficient
between the total population (X8) and the indicators
PMBDA 2021 - International Conference on Public Management and Big Data Analysis
184

of the comprehensive economic system has reached
0.5006, and the total population (X8) is related to the
indicators in the economic system. The correlation
coefficients all exceed 0.35, and the correlation
between the total population (X8) and the primary
industry (Y2) exceeds 0.9, indicating that the total
population (X8) and the primary industry (Y2) are
highly correlated.
4 CONCLUSIONS
After World War II, Japan's economic development
experienced four stages: recovery, high-speed
growth, slowdown and stagnation. According to the
statistics of the comprehensive institute of social
economy of the Cabinet Office of Japan, the Japanese
economy has experienced 16 business cycles since
1951, when the post-war reform came to an end. From
the beginning of the bubble collapse in the early
1990s, the Japanese economy entered the long
stagnation period known as the "lost twenty years"
(more than 20 years now). It has experienced five
business cycles, of which, in 1998 and 1999, 2008
and 2009, the economic growth rate has been negative
for two consecutive years. According to the
prediction of the Japan Federation of economic
organizations and PwC, the Japanese economy will
remain in a depressed state in the next few decades.
The reasons for the long-term economic downturn in
Japan are manifold. From the results of the study,
besides the retaliatory influence of the bubble
economy, the change of population structure and the
adjustment of industrial structure are also important
factors. After entering the 21st century, Japan's
population growth rate has decreased significantly,
and there was a state of zero growth from 2007 to
2010. Since 2011, Japan's population has entered an
era of population reduction. In the process of slowing
down and even negative growth of the total
population, the most important feature of Japan's
population change is "young children aging" (Cui
2016). Japan has lost its "demographic dividend" due
to population reduction and rapid aging. Japan's
persistently low fertility rate has led to fewer children
and a reduction in the working population. In addition
to the low fertility rate, the aging of Japan's
population is also due to the extension of average life
expectancy. The characteristics of Japan's population
structure will comprehensively affect the economic
growth factors such as consumption demand,
investment demand, labor supply, capital formation
and technological progress. Due to the reduction of
demand in the short and medium term and the decline
of supply capacity in the medium and long term,
economic growth is bound to stagnate or show a
negative growth trend (Li 2016).
From the change of industrial structure, after the
1990s, the proportion of employment in Japan's
primary industry and secondary industry continued to
show a downward trend, especially in 2009, the
proportion of labor force in Japan's primary industry
was at a low level in the world. On the contrary, the
employment of all sectors of the tertiary industry is
relatively prosperous, and the labor force begins to
transfer not only from the primary industry, but also
from the secondary industry to the tertiary industry.
The output value of the tertiary industry and the
proportion of the employed population occupy a
dominant position, which plays a certain role in
maintaining stability of the Japanese economy.
Under the background of the continuous
weakness of the global economy and the slowdown
of productivity growth, the demographic factor, as a
structural factor affecting the economy, has attracted
more and more attention of policy makers all over the
world. Taking Japan as an example, China needs to
take positive population countermeasures to promote
economic development: Taking Japan as an example,
China needs to take positive population
countermeasures to promote economic development:
On the one hand, moderate population growth and
vigorous labor supply are important factors for
economic development. In recent years, China's birth
rate has continued to decline, even below the level of
population replacement. Therefore, China needs to
optimize its fertility policy, promote long-term
balanced population development, and improve
supporting measures by reducing the cost of fertility,
parenting and education. By formulating laws and
regulations, we will increase the population fertility
rate, slow down the aging of the population, delay the
negative growth of the population and improve the
population structure.
On the other hand, there is a close relationship
between the development of tertiary industry and
GDP growth. In order to effectively play the role of
the tertiary industry in promoting the economy, China
needs to continue to optimize the industrial structure
and promote the upgrading of the population
industrial structure. As an important part of modern
industry, the development of tertiary industry has an
important impact on employment, improving people's
life and optimizing economic structure. Since the
reform and opening up, with the evolution of China's
industry, the proportion of the tertiary industry in the
economy has shown an upward trend and developed
rapidly, becoming the main force to promote
An Analysis of the Relevance between the Transition of Japan’s Population Structure and Economic Growth: Based on Grey Relational
Model
185

economic growth. However, the employment
structure of China's tertiary industry is unreasonable
and needs to be optimized. In the future, it is
necessary to promote the coordination of industrial
structure optimization and employment
transformation to achieve sustainable economic
development. Scientifically promote supply side
reform, expand the contribution of consumption to
economic growth, and maintain long-term sustainable
economic growth under the condition of population
structure change.We hope you find the information in
this template useful in the preparation of your
submission.
REFERENCES
Dangchen Sui, Xu Cheng, Xue Wu. (2020) Demographic
Structure Change, Demographic Dividend and
Economic Growth--Based on the Comparison between
China and Japan. J. Reform of economic system.5, 156-
163.
Jiazu Yuan, 1991. Grey System Theory and Its Application,
Science Press, Beijing.
Min Lu, Fang Cai. (2014) The impact of demographic
changes on potential growth rates: a comparison
between China and Japan. J. World economy. 37, 3-29.
Xiaofeng Wang, Xue Li Ma. (2014) The Effects of
Demographic Factors on Japan's Economic Growthin
the Accelerating Ageing Period: a Perspective from the
Double Turning Points of Population and Economics. J.
Contemporary Economy of Japan .197, 1-12.
Yancui, 2016. Economic Growth and Business Cycle in
Japan during the Heisei Era, Social Sciences Academic
Press, Beijing.
Zhongsheng Li, 2016. Japanese Population Economy,
China Personnel Press, Beijing.
PMBDA 2021 - International Conference on Public Management and Big Data Analysis
186
