
Research on the Enterprise Raw Material Ordering and
Transshipment Problems based on the Dual-objective Planning
Model: Taking a Building Materials Enterprise as an Example
Linfei Zhang
1a
, Yuan Gao
2b
and Mingxuan Zhou
1c
1
School of Economics, Henan University, Kaifeng, China
2
School of Eurasia International, Henan University, Kaifeng, China
Keywords: Enterprise Cost Reduction Plan; Comprehensive Evaluation System Construction; Dual-Objective Planning
Model; Price Correction Factor.
Abstract: Based on hierarchical clustering, technique for order preference by similarity to an ideal solution and dual-
objective planning models, we give manufacturers a raw material ordering and transshipment solution
involving multiple supply chain participants, including supplier evaluation, cost control and loss control.
Compared with the traditional increase of constraint conditions to optimize the model, we introduced the price
correction factor containing multiple components from the perspective of system analysis to simulate the
dynamic characteristics of the supply chain system. By constructing the "relative ordering price", the form of
the objective function is affected in real time, thereby increasing the understanding space, so that the objective
function in the process of solving can be more close to the global optimal solution in a limited number of
iterations .The empirical results pointed out that after the introduction of the price correction factor, the
ordering plan formulated has obvious selectivity to the production materials, which significantly improves the
production enterprises’ anti-risk ability and capacity improvement potential, thereby promoting the
transformation and upgrading of the enterprises and also improving its operational management capabilities
and supply chain management capabilities.
1 INTRODUCTION
1.1 Research Background
In recent years, as the global value chain layout has
been further adjusted due to the impact of the covid-
19, the degree of uncertainty in the economic market
has deepened and the government's macro-control
role in the “horizontal integrated” supply chain
management model has become extremely important.
From China’s 2017 “Guiding Opinions of the
General Office of the State Council on Actively
Promoting Supply Chain Innovation and
Application”, which promoting innovation of
industrial organization and government governance
methods, to promote management modernization and
upgrading of industrial structure in the “14th Five-
a
https://orcid.org/0000-0003-3746-408X
b
https://orcid.org/0000-0003-4379-1060
c
https://orcid.org/0000-0002-6071-4334
Year Plan and 2035 Vision Goals Outline” ,from the
second plenary session to the sixth plenary session of
the 19th Central Committee, in the spirit of dealing
with excess capacity and promoting the optimization
and upgrading of the supply chain and industry chain,
enterprises are not only the main body pursuing
individual economic interests, but also need to
perform corresponding social responsibility.
Enterprises need the assistance of government
governance to maximize their profits, which in turn
promotes social and economic development. The
production and operation transactions between the
upstream and downstream of the supply chain are
continuously optimized and upgraded under the
guidance of policies.
Under the influence of the pandemic, China's
building materials industry has been greatly affected
but still maintains a steady upward development
22
Zhang, L., Gao, Y. and Zhou, M.
Research on the Enterprise Raw Material Ordering and Transshipment Problems based on the Dual-objective Planning Model Taking a Building Materials Enterprise as an Example.
DOI: 10.5220/0011150200003437
In Proceedings of the 1st International Conference on Public Management and Big Data Analysis (PMBDA 2021), pages 22-31
ISBN: 978-989-758-589-0
Copyright
c
2022 by SCITEPRESS – Science and Technology Publications, Lda. All rights reserved

trend. According to the “Building Materials Industry
and Economic Operation in 2020”, China’s building
materials industry has grown by 2.8% year-on-year
with generally stable prices and rising profits. We
take a small and medium-sized building materials
enterprise as our research object and analyze its order
volume, supply volume and transshipment data of
various participants in the past ten years to formulated
the optimal raw material ordering plan and
transshipment plan. Based on this, production
enterprises can adjust their development strategy and
accelerate the process of transforming and upgrading.
1.2 Research Purpose and Significance
China’s “14th Five-Year Plan” outline a procedure to
transform and upgrade traditional industries,
especially promoting the layout optimization and
structural adjustment of the raw material industries
such as petrochemicals, steel, nonferrous metals and
building materials to promote green building
materials. The development of the building materials
industry will shift from “incremental expansion” to
“improving quality and efficiency”. We take a certain
building materials enterprise as the research object
and introduce the price correction factor to simulate
the dynamic characteristics of the supply chain. Our
primary method is to build a dual-objective planning
model to analyze the enterprise's optimal ordering
plan and transshipment plan for raw materials from
the perspective of supply chain management.
China’s supply chain industry has developed
rapidly in recent years. Existing researches often
focus on a single manufacturing enterprise as research
object and generally do not consider the dynamic
characteristics of the supply chain system in the
modeling process. With the idea of system analysis,
we creatively introduce the price correction factor,
which can simulate the dynamic characteristics of the
supply chain system to a certain extent. Our planning
model under this correction can not only reduce the
cost of the production enterprise, but also
significantly improve the enterprise's ability to resist
risks and increase the potential for productivity.
Further we take the price correction factor as the
coefficient of the decision variable to affect the form
of the objective function. As a result, in the process of
optimizing the solution result of the model, there are
only a few and concise constraints, which simplifies
the complex processing methods of the traditional
model.
While promoting enterprises to reduce costs,
improve their ability to resist risks and increase
production potential, our results also have certain
reference significance for the transformation and
upgrading of China’s material industry, operation
management and supply chain management in the
future development and contribute to social and
economic construction and development.
1.3 Existing Research
With regard to the research on supply chain ordering
and transshipment, relevant conclusions have been
discussed since the 1970s. A.A. (Gaballa 1974) first
used the mathematical programming model to study
the problem of supplier selection. K. and S. (Skouri
and Papachristos 2002) proposed damage cost,
holding cost and so on.
C.O. (Brien 2006) adopted the
ownership goal method to evolve the single-objective
cost planning model into a multi-objective cost
planning model, marking the formal formation of the
supply chain logistics integration mode. Michael
(Stuart 2010) starts from the three aspects of order
acquisition, transportation, and inventory to minimize
the sum of order processing costs, transportation
costs, and inventory costs. Some scholars (Liu et al.
2017) used AHP and TOPSIS evaluation models to
reconstruct a scientific and effective supplier
evaluation system. Some also (Zhang et al. 2010)
mentioned the importance of realizing the mutual
sharing of information between enterprises at various
nodes during cost control based on the perspective of
supply chain
. Other schoalrs (Liu 2019) think that
enterprises should not only regard the supply chain as
a product supply ,transshipment and storage, but
should recognize the relationship between supply
chain changes and product development and
marketing.
In summary, we can find that there are many
research results on supply chain research methods and
supplier selection at home and abroad, but most of
them stay on the level of cost control and do not
consider the dynamic characteristics of the supply
chain system, thus the solution results are limited to
the improvement of supply chain stability and
capacity potential. Therefore, with the rapid
development of information economy and support of
government policies, it is imperative to formulate
effective methods on the optimal ordering plan and
transshipment plan from the perspective of system
analysis.
1.4 Research Content and Methods
For production enterprises, ensuring their normal
production, operation and maintenance is the most
basic and important thing. Some enterprises may have
Research on the Enterprise Raw Material Ordering and Transshipment Problems based on the Dual-objective Planning Model Taking a
Building Materials Enterprise as an Example
23
seasonal changes in supply, they will get a very low
score in the comprehensive evaluation, or even be
directly excluded. This is obviously unreasonable.
Therefore, prior to the comprehensive evaluation,
first perform hierarchical clustering based on the
supply capacity of the manufacturer and rank the
suppliers with reference to the clustering results and
actual conditions. Next, we carry out the “protection”
operation for the higher-rated suppliers.
Based on that, we conduct a comprehensive
evaluation of suppliers based on TOPSIS and
quantitatively analyze their value to the production
enterprise through the index system of “supply
capacity, supply stability, supply satisfaction rate,
average response time”. In the formulation of
ordering and transshipment plans for production
enterprises, we take the most economical ordering
and the smallest transshipment loss as the objective
function, set the constraint conditions with the lowest
storage threshold and other actual conditions and
creatively introduce the “price correction factor”.
The price correction factor comprehensively
considers the characteristics of the production
materials, the comprehensive ratings of suppliers and
the supply and demand status of the production
materials, which includes “linear components”,
“composite components” and “time-varying
components”, which are combined based on the
coefficient of variation method. Similar to the
adjustment of prices by macro market conditions, the
price correction factor also simulates the
characteristics of the supply chain system to a certain
extent. “Relative order price” also has dynamic
characteristics.
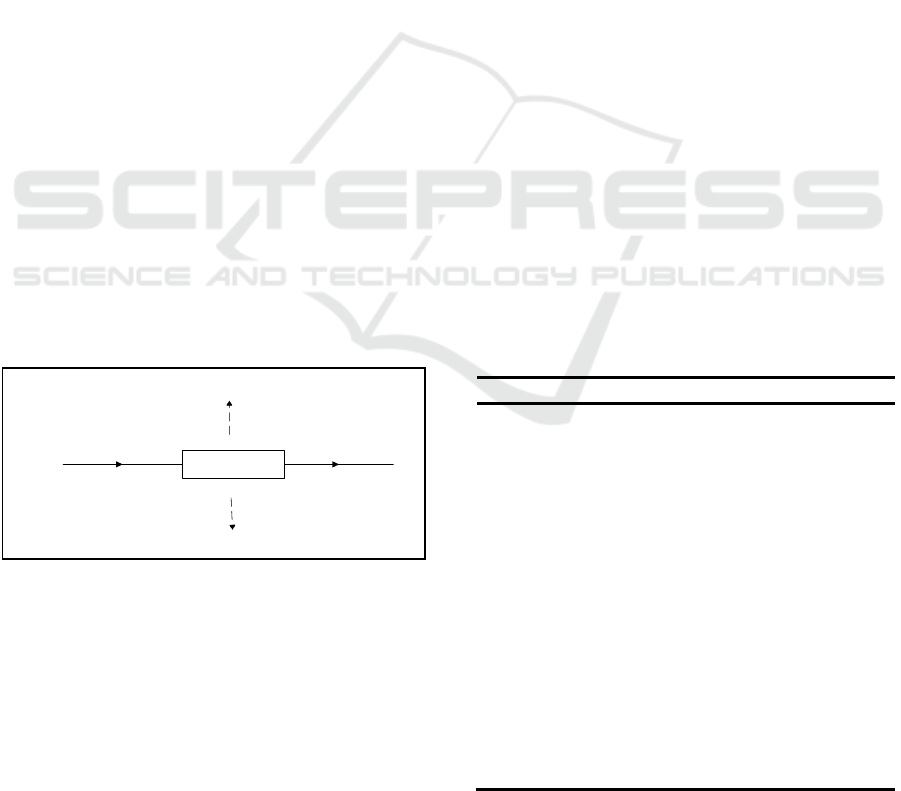
Figure 1: Analogy diagram of price correction factors.
Analog communication system may be easier to
understand the role of price correction factor (see
figure 1): if the order price before correction is
analogous to the input signal, then the price correction
factor can be compared to a system function of this
nonlinear time-varying system, and the price
correction factor can be used to represent an
approximately equivalent supply chain (AESC)
system, and the revised “relative price” also has the
characteristics of this system.
We conducted an empirical analysis based on the
ordering and transshipment data of a building
materials enterprise with various suppliers and the
transshipment data of various forwarders in the past
ten years (Data from the second author’s family
business which is authorized to use).The analysis
results pointed out that after the introduction of price
correction ,the subsequent model solution results
shows a clear preference towards the raw materials,
and even some ordering nodes completely abandon
certain types of raw materials. In fact, C raw material
is a kind of high pollution and low pollution that have
been gradually eliminated in recent years. But in the
absence of price correction factors, this tendency is
not reflected in the solution results of the model.
From the perspective of the storage change curve
before and after the price correction factor is
introduced, the solution result before the introduction
of this factor makes the production enterprise often in
the two extreme situations of raw material backlog
and raw material shortage. And according to the
quantitative analysis of the three parameters "average
replenishment response cycle", "storage vigilance
level" and "peak storage volume", the solution result
after introducing the price correction factor enables
the production enterprise to have stronger capacity
improvement potential and anti-risk ability.
2 SYMBOL DESCRIPTION
Table 1: Symbol Description.
Symbol Description Unit
it
S
Supply volume of the i-th
supplier in week t
3
m
it
O
Order amount of the i-th supplier
in week t
3
m
j
M
J-th raw material
/
j
P
J-th raw material price
RM
B
j
η
The number of j-th raw materials
consumed per cubic meter of
product
3
m
m
T
M-th forwarder
/
m
σ
Loss rate of the m-th forwarder
/
()
j
t
γ
The price correction factor for
the j-th raw material in week t
/
()
j
t
γ
ij j
M
P
ijjj
M
P
γ
()X
ω
()
H
ω
() () ()YXH
ωωω
=
NLTV
A
ESC
PMBDA 2021 - International Conference on Public Management and Big Data Analysis
24

3 ASSUMPTIONS
The enterprise has continuous production for
48 weeks a year.It has a weekly production
capacity of H million cubic meters and raw
material inventory should meet the production
capacity requirements for the next two weeks;
The production enterprise has 2H million
storage capacity in initial week ;
There are n suppliers, and one supplier only
produces one kind of raw material;
The supplier only corresponds to the order
quantity sent once each time, and the supplier
responds to the order each time;
All transshipment enterprises’ maximum
weekly transshipment capacity is 60 million
cubic meters;
The weekly supply of a supplier is transshipped
by a forwarder.
There are s kinds of raw materials, the price of
each raw material remains constant at every
week.
4 MODEL
4.1 Supplier Evaluation
4.1.1 Supplier Rating System based on
Hierarchical Clustering Algorithm
Based on the total supply volume of each supplier in
the past Y years, we use a systematic clustering
method based on supply capacity and the elbow rule
to comprehensively classify suppliers with actual
situation considered. Specific classification methods
are as follows.
First priority supplier: They can stably provide a
large amount of production materials in actual
situation and often has a strategic cooperative
relationship with the manufacturer.
Second-priority suppliers: Their supply
characteristics are also stable, medium-range or have
periodic large-scale supply.
The third priority supplier: They are used as an
alternative to the production enterprise
Fourth priority supplier: They are generally
excluded and does not participate in the
comprehensive evaluation.
4.1.2 Supplier Selection Evaluation Index
System
In order to select a certain number of qualified
suppliers from n suppliers, we establish an index
system to evaluate the supplier's supply
characteristics. The evaluation system is as follows.
Table 2: Evaluation System of Suppliers.
Symbol Description Unit
The supply capacity of the i-
th supplier
Supply stability of the i-th
supplier
/
Supply satisfaction rate of the
i-th supplier
/
The average response time of
the i-th supplier
week
Here are the definitions of four evaluation
indicators.
a)Supply capacity
(1)
b)Supply stability
(2)
This indicator is an extremely small type
indicator, i.e. the smaller the value, the more stable of
the supply.
c)Supply satisfaction
(3)
Define this indicator to measure the matching
degree of supply and demand.
d)Average response time
Considering that there may be many unordered or
unshipped situations in the actual ordering and
shipping data, here is the definition of the annual
effective order quantity and the annual effective
shipment quantity.
The effective ordering quantity of the
manufacturing enterprise to the i-th supplier at the n-
th effective ordering node in a certain year can be
defined as
(4)
1
i
f
3
m
2
i
f
3
i
f
4
i
f
1
iit
t
f
S=
2
ii
f
σ
=
3
100%
it
t
i
it
t
O
f
S
=×
( ) ( ), 1, 2,3...48
iE io i
On OtkTk=− =
Research on the Enterprise Raw Material Ordering and Transshipment Problems based on the Dual-objective Planning Model Taking a
Building Materials Enterprise as an Example
25

Among them, the effective ordering node of the i-
th supplier in the k-th sampling
()
io
nk
can be
defined as
(5)
Similarly, the effective supply volume of the n-th
effective supplying node of the i-th supplier in a
certain year can be defined as
(6)
Among them, the effective supplying node of the
i-th supplier in the k-th sampling can be defined as
(7)
According to the supplier only corresponds to the
order quantity sent once each time, and the supplier
responds to the order each time, there is
(8)
According to the above definition, the average
response time of the i-th enterprise in the past Y years
can be defined as
(9)
The effective ordering sampling sequence of the
i-th supplier can be expressed by the inverse
function of the effective shipping node as
(10)
Similarly, the effective supplying sampling
sequence of the i-th supplier can be expressed as
(11)
Obviously, this indicator should be regarded as an
extremely small type indicator, that is, the smaller its
value, the quicker the supplier can supply the
manufacturer.
4.1.3 Quantitative Evaluation of Suppliers
based on TOPSIS
Use TOPSIS to normalize and standardize the four
indicators of all suppliers, and calculate the scores of
n suppliers and sort the suppliers accordingly.
4.2 The Establishment of
Dual-objective Planning Model
In order to formulate the most economical ordering
plan and transshipment plan with the least loss rate in
the next
t
weeks, the enterprise needs to evaluate and
select four parts of raw materials, suppliers, ordering
quantities, and forwarders so as to construct two
optimal solutions.
4.2.1 The Introduction of Price Correction
Factors
We comprehensively consider multiple participants in
the supply chain and introduce the price correction
factors, which will affect the ordering and
transshipment strategies of manufacturers by
modifying the unit price of raw materials.
Therefore, the price correction factor for the
raw material in the week can be
decomposed into linear components ,complex
component and time-varying
component
.
Linear components can be defined as
(12)
is the input-output ratio of the j-th raw
material.
Composite components can be defined as
(13)
j
M
ark
is the average score of the supplier that
produces the j-th raw material.
Time-varying components can be defined as
(14)
1, ( ) 0
() ,
0, ( ) 0
1, 2,3...max( )
io i
io
i
io io
nOtkT
nk
Ot kT
nn
+−≠
=
−=
=
( ) ( ), 1,2,3...48
iE i s i
Sn StkTk=− =
1, ( ) 0
() ,
0, ( ) 0
1, 2, 3......max( )
is i
is
i
is is
nStkT
nk
St kT
nn
+−≠
=
−=
=
io is i
nnn==
max( )
11
4
(() ())
max( )
i
i
n
Y
yisE i y ioE i
yn
i
i
knk n
n
f
Y
==
−
=
ioE
k
()
io
nk
1
() (), () 0
ioE i io io
kn nknk
−
=≠
1
() (), () 0
isE i is is
kn nknk
−
=≠
()
j
t
γ
j
th−
tth−
lj
γ
cj
γ
()
vj
t
γ
min
max min
j
lj
η
η
γ
η
η
−
=
−
j
η
min
max min
j
cj
Mark Mark
M
ark Mark
γ
−
=
−
11
min
(1) (1)
()
11
max min
(1) (1)
j
vj
Wt Wt
t
Wt Wt
γ
−
−−
=
−
−−
PMBDA 2021 - International Conference on Public Management and Big Data Analysis
26

is the storage volume of the j-th raw
material in the t-th week.
Since some suppliers may have seasonal and
periodic supply characteristics, considering that the
entropy method is susceptible to the impact of the
jump value, and the coefficient of variation can well
explain the value of the jump value. In this case, the
coefficient of variation method is used to synthesize
the above three components.
Let , are
coefficients of variation of the above three
components.
It should be noted that is also a function of
time, so is called a time-varying component.
In summary, the price correction factor can be
expressed as
(15)
In addition, different from the impact of macro
objectively factors such as the market supply and
demand relationship on the actual order price of raw
materials, the "correction" here is partial, which is a
relative correction to ensure the maximum benefit of
the production enterprise. The revised order prices are
references only for formulating the ordering plan and
the transshipment plan.
4.2.2 Formulation of the Most Economical
Ordering Plan
Aiming at n suppliers for s kinds of raw materials, we
try to formulate the most economical raw material
ordering plan for the enterprise in the next t weeks.
The economic expenditure includes ordering cost,
transshipment cost and storage cost. the objective
function is that these three types of expenditure are
the smallest.
First, the ordering cost can be defined as
(16)
is a logical variable which takes value one if
i-th supplier produces j-th raw material, otherwise is
zero.
Second, for z forwarders, the transshipment cost
can be defined as
(17)
is a logical variable which takes value one if
m-th forwarder transship the raw material of the i-th
supplier, otherwise is zero.
Third, for the raw materials transferred by z
forwarders, the storage cost can be defined as
(18)
Take the historical average of the same
period in the past Y years
(19)
Considering that the decision variable of the
objective function is , we give a formula to
describe the relationship between and .
(20)
Here, we use the historical average of over
the same period as a measure of the supply
satisfaction rate of the i-th supplier in the next t weeks
(21)
In summary, the objective function with the
lowest total cost is
(22)
4.2.3 The Formulation of the Least Loss
Plan
According to the above definition, the objective
function of the lowest loss rate is
( 2 3 )
4.2.4 Constrains
In order to ensure the normal operation and
maintenance of production enterprises, combined
with the actual conditions of each link of the supply
chain, constraints are as follows.
According to assumption A and B, the weekly
storage volume needs to be able to maintain the
enterprise's production capacity for two weeks,
namely
()
j
Wt
[
]
123
,,
T
i
VVV
α
=
123
,,VVV
3
α
()
vj
t
γ
()
j
t
γ
12 3
() ()
jljcjvj
tt
γ
α
γ
α
γ
α
γ
=+ +
1
11
ns
ij j j it
ij t
CMPO
γ
==
=
j
M
2
11
()
an
mi it
mi t
CTF TS
==
=
m
T
3
11
((1))
an
mt it
mi t
CTR S
σ
==
=−
jt
σ
1
((48))
Y
mt
y
mt
t
ty
Y
σ
σ
=
+
=
it
O
it
O
it
S
2
()
it i i it
SfnO=
2
i
f
max( )
1
2
1
(max())
(max())
()
i
i
Y
yiE i i
n
y
yiE i i
ii
n
Sn ny
On ny
fn
Y
=
=
+
+
=
1123
min ( )
it
f
OCCC=++
2
11
min ( )
an
it mi mt it
mi t
f
OTS
σ
==
=
Research on the Enterprise Raw Material Ordering and Transshipment Problems based on the Dual-objective Planning Model Taking a
Building Materials Enterprise as an Example
27

(24)
According to assumption C, a supplier only
produces one kind of raw material, so the rank of
is 1 all the time.
(25)
According to assumption E, the weekly
transshipment capacity of each forwarder is 6000
cubic meters at most, that is
( 2 6 )
According to each supplier’s raw materials have
and only one forwarder is responsible for the
transshipment every week, so
11
1
an
mi
mi
T
==
=
(27)
In summary, the dual-objective programming
model can be described as
(28)
5 EMPIRICAL RESULTS
5.1 Problem Introduction
Combined with the above, we are now studying the
ordering and transshipment plan of a building
materials enterprise in the next 24 weeks.
In this example, in addition to satisfying the above
assumptions, a total of 369 suppliers, 8 forwarders, 4
types of raw materials, the prices of them are
and weekly production
capacity of the manufacturer are
. The quantity of four kinds of raw materials required
to produce building material per cubic meter is
,,,,which
means
. Besides, we still
have the supply condition of these 369 suppliers and
weekly transshipment loss rate of forwarders in the
past ten years. According to the above discussion, we
follow the steps below to study the ordering and
transshipment plan of the manufacturer
5.2 Simulation Solution
5.2.1 Hierarchical Clustering Analysis based
on Supplier's Supply Capacity
Combined with the pedigree chart and the elbow rule,
we divide 396 suppliers into 4 categories, and carry
out the “protection” operation for the first and second
types of suppliers, which means even if they fail to
enter the top 80 in the comprehensive evaluation in
the next step, we will replace the original supplier
from back to front.
5.2.2 Comprehensive Evaluation based on
TOPSIS
Based on the evaluation system and protection
operations constructed above, a
comprehensive
evaluation of these 396 suppliers was made and the
top 80 were evaluated.
Table 3: Top Eighty Suppliers.
Rank Supplier Materials Score
1 S229 A 0.067374975
2 S361 D 0.062735875
3 S140 B 0.05772693
4 S108 A 0.04809566
5 S151 C 0.040590773
...... ...... ...... ......
77
S223
C 0.001923605
78
S237
A 0.001915819
79
S324
C 0.001904659
80
S092
D 0.001896674
Among the top 80 suppliers, the scores of the
suppliers who supply the four raw materials are as
follows.
Table 4: Scores of The Suppliers Who Supply Four
Materials.
Materials
Number of
suppliers
Average
Score
Highest
Score
A 26 0.013341073 0.067374975
B 19 0.014170486 0.05772693
C 14 0.005367099 0.040590773
D 21 0.008707384 0.062735875
44
111 2
10 ( 1) 2 10
asn t
mt j it
mji t t
SPt P
ση
=== =
−−≥×
ij
M
)1
ij
RM =(
11
6000
an
mi it
mi t
TS t
==
≤
1
11 11
11
2
11
min ( ) ( ( )
.. ( (1 ) ))
min ( )
ns an
it ij j j it mi it
ij t mi t
an
mt it
mi t
an
it mi mt it
mi t
f
OMPOTFTS
of TR S
fO T S
γ
σ
σ
== ==
==
==
=+
+−
=
[
]
1.0,1.2,1.5,1.3
j
P =
43
3.12 10Hm=×
3
0.68m
3
0.70m
3
0.77m
3
0.73m
[
]
0.68,0.70, 0.77, 0.73
j
η
=
PMBDA 2021 - International Conference on Public Management and Big Data Analysis
28
5.3 Analysis
5.3.1 The Influence of Linear Component
and Composite Component on Raw
Material Ordering Preference
Since materials A and C are the most popular and the
least popular materials respectively, their order ratio
is used as the basis for analysis.
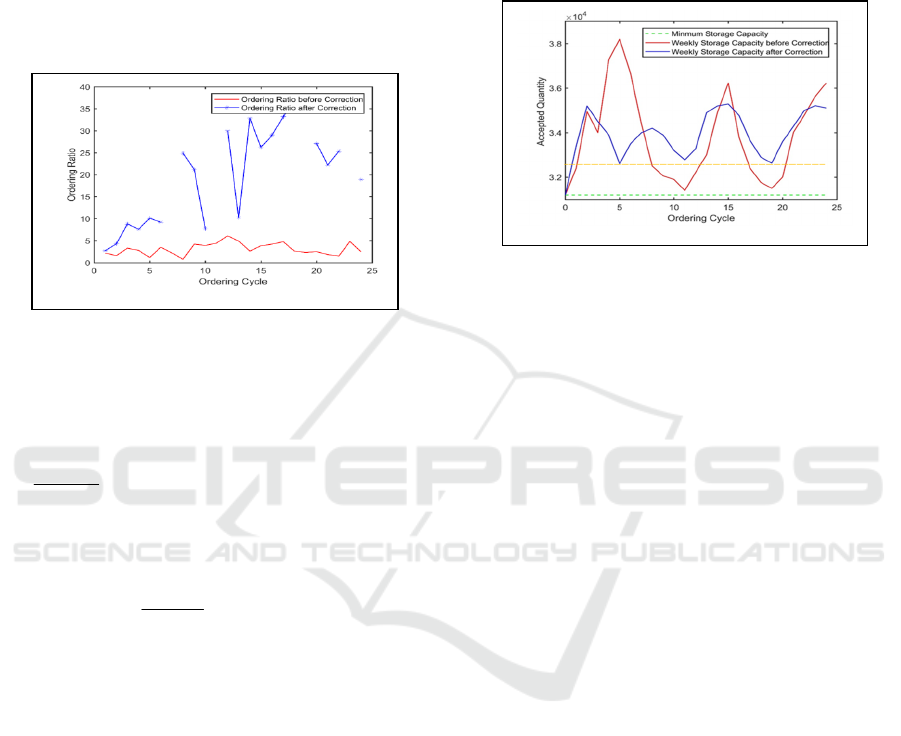
Figure 2: Ordering ratio of A and C raw materials.
It can be concluded that before the introduction of
the price correction factor and the nature of the raw
material C itself, starting from the goal of the least
loss and the lowest cost, there has been
From figure 2, after the introduction of the price
correction factor, the manufacturer’s preference for
raw material A has increased significantly, and even
the situation of has occurred. This is
caused by the fact that the manufacturer did not order
raw material C at some nodes. This shows that the
price correction factor has been strengthened the
profit gap between different raw materials.
From the analysis of the composition of price
correction factors, there are linear components
directly related to the input-output ratio of raw
materials and composite components directly related
to the supplier’s score. Therefore, differences in these
factors are no longer only reflected as constraints, but
directly modifies the weekly ordering prices of
different raw materials, and their values directly
affect the coefficient of the decision variable, which
is quantified in the objective function.
5.3.2 The Influence of Time-varying
Components on the Storage Volume of
Raw Materials
We calculate the weekly storage volume before and
after the price correction factors are introduced.
Figure 3: Storage volume of change curve.
From figure 3, we know that before the
introduction of the price correction factor, the overall
storage volume change curve shows the following
characteristics:
The peak storage volume is too high, and
excessive storage of raw materials is prone to
occur.
Low sensitivity of the enterprise to decreasing
in storage volume.
The average replenishment response cycle is
longer, that is, the storage volume is at a low
level for a longer time.
Lower storage vigilance level, that is, the
timing of replenishment is often selected when
the storage volume is very close to the
minimum level.
In contrast, after introducing the price correction
factor, the overall storage volume change
curve
shows the following characteristics:
Peak reserves are relatively moderate, and the
backlog of raw materials is not easy to appear.
The enterprise is more sensitive to the decline
in storage volume.
The average replenishment response cycle is
shorter, the time when the storage volume is at
a lower level is shorter.
Higher storage vigilance level , that is, when
the storage volume reaches a moderate value,
the restocking starts.
The main characteristic value of the storage
volume change curve mentioned above are as
follows.
1
3
()
1 [1, 24]
()
i
i
MO t
always hold for any t
MO t
≥∈,
1
3
()
()
i
i
MO t
MO t
→∞
Research on the Enterprise Raw Material Ordering and Transshipment Problems based on the Dual-objective Planning Model Taking a
Building Materials Enterprise as an Example
29

Table 5: Characteristic Parameters of Storage Volume.
Change Curve
Average
Response
cycle
Peak
Reserves
Restocking
Vigilance
Level
Before
Correction
4.625 38200 31430
After
Correction
2.783 35290 32680
From a global perspective, before and after the
price correction factor is introduced, the solved total
storage cost can be maintained at a low value. For the
former, this is due to its lower storage vigilance level,
higher replenishment response time and higher
storage peaks. It should be noted that, for a
manufacturing enterprise, having these
characteristics at the same time means that the
enterprise is often in a bad closed loop of production
raw material backlog-rapid consumption of
production raw materials-urgent production of raw
materials-large purchase of production raw materials.
According to the actual situation, combined with the
storage volume change curve of the production
enterprise in such a bad closed loop, the following
conclusions can be obtained:
Affected by the low storage vigilance level,
enterprise in the replenishment period often need to
purchase a large amount of raw materials for
production, and at this time they have just gone
through a period of raw material backlog, so the
expenditure during this period is higher than average.
Under the combined influence of these two factors,
production enterprises are prone to accidents such as
the break of the capital chain.
When the production enterprise needs to increase
production capacity to a certain extent, its long
replenishment response time and poor sensitivity to
the decline in storage volume determine that this goal
is difficult to achieve.
After the introduction of price correction factors,
the above problems have been effectively alleviated,
and the value of each characteristic of the storage
volume change curve is in a relatively reasonable
range, which can effectively improve the risk
resistance of manufacturers and can accept a certain
degree of increase in production capacity. This can be
explained by the composition of the price correction
factor, where there is a time-varying component
directly related to the storage volume, and its value is
inversely proportional to the weekly storage volume
of each raw material. After the price correction factor
is introduced, the weekly storage volume will no
longer only be reflected as a constraint, but as a time-
varying component to directly modify the weekly
order prices of different raw materials. Its value
directly affects the coefficient of the decision variable
and is reflected in the objective function
quantitatively.
5.3.3 Analysis of the Influence of Price
Correction Factors on the
Dual-objective Programming Model
The price correction factor comprehensively
considers the influence of multiple participants in the
supply chain, contains multiple components, and its
value can be used as a coefficient of a decision
variable to affect the form of the objective function in
real time. This directly increases the solution space of
the objective function, making it closer to the global
optimal solution in a limited number of iterations.
Compared with the traditional method of adding more
constraints, it is highly subjective, static, and
significantly increases the complexity of the model. It
is a means of improving the enterprise’s anti-risk
ability and profitability based on the internal factors
of the production enterprise and price modification.
The factor has the characteristics of non-linear and
time-varying, which can simulate the dynamic
characteristics of the supply system, and the
consideration factors are more systematic, more
objective, more flexible and the calculation cost is
also smaller.
6 CONCLUSIONS
After the above discussion, we gave a raw material
ordering and transshipment formulation strategy and
evaluation index based on common mathematical
modeling methods for manufacturers, and introduced
the concept of the price correction factor, and gave the
calculation of each component formula, practical
meaning and synthesis method. It should be noted that
considering the efficiency of model solving, we made
tougher assumptions and constraints. One is that we
assume the order price of raw materials is constant,
and completely ignores the influence of external
factors on the price of raw materials., which has a
certain degree of time-varying characteristics. When
considering the influence of these factors, it is
necessary to define another influence factor, and take
a part of this factor and the time-varying component
of the price correction factor, which will increase the
complexity of the model. Due to the limitation of
data, this article did not do any spatial domain
analysis of the entire model and did not consider the
delay of a series of actions among suppliers,
PMBDA 2021 - International Conference on Public Management and Big Data Analysis
30

forwarders and manufacturing enterprise. To a certain
extent, this also weakens the rigor of a series of
parameters such as average response time,
replenishment response cycle and time-varying
components. Empirical analysis points out that the
model solution results can meet actual operating
needs of the production enterprise.
With the development of social economy and the
change of social thinking, the roles between
enterprises and governments are constantly changing.
Enterprises must have sufficient time and space to
reduce costs, improve their own risk resistance and
capacity improvement potential, so as to achieve
transformation and upgrading and improve their own
operational capabilities. In this process, the
government must provide a policy environment that
is in line with enterprise development so as to
consolidate the results of enterprise development.
Enterprises play a good role in fulfilling individual
economic responsibilities in their development. The
two-way interaction between the government
governance and enterprises forms a social
environment of good governance.
REFERENCES
A.A.Gaballa (1974). Minimum cost allocation of tender. J.
Operational Research Quarterly.3, 389-398.
C.O.Brien(2006). The total cost of logistics in supply
selection under conditions of multiple sourcing and
criteria. J.Production Economic.5,15-17.
K.Skouri and S.Papachristos(2002). A continuous review
inventory model with deteriorating items. J. Applied
Mathematical Modelling.26,603-617.
Liu Sen, Zhang Yingying, Zhang Yan, Yang Junai(2017).
Research on green supplier selection integrating AHP
and TOPSIS evaluation model. J.Logistics Engineering
and Management. 39,1-4+11.
Liu Zelin(2019). Sustainable development of supply chain
management: creating new core competitiveness. J.
China Industry and Information Technology. 7,30-39.
Michael Stuart(2010). Benefits and Drawbacks of
Technology in Supply Chain Management. J.Practical
Application of Science.5,99-201.
Zhang Shan, Zhang Wenfang, Lu Zhou(2011). Analysis of
logistics cost management based on supply chain. J.
Finance and Accounting Newsletter. 2,136-137.
Research on the Enterprise Raw Material Ordering and Transshipment Problems based on the Dual-objective Planning Model Taking a
Building Materials Enterprise as an Example
31
