
The Impact of the Transportation Efficiency on the Tourism
Eco-efficiency based on PVAR Model: A Case Study of the Yellow
River Basin
Qingsheng Zhang
a
School of Economics and Management, Beijing Jiaotong University, Beijing, China
Keywords: Tourism Eco-efficiency, Transportation Efficiency, PVAR Model, Yellow River Basin.
Abstract: Transportation and tourism are closely related, and transportation is an important factor that affects the tourism
eco-efficiency. Based on the transportation data and the tourism data of 9 provinces in the Yellow River Basin
from 2007 to 2019, we use the Super-SBM model and the Super-SBM model with undesirable output (Un-
Super-SBM model) to measure the transportation efficiency and the tourism eco-efficiency. We use the PVAR
model to analyse the panel data of the transportation efficiency and the tourism eco-efficiency, and discuss
the impact of the transportation efficiency on the tourism eco-efficiency. As a result, the transportation
efficiency and the tourism eco-efficiency of the whole Yellow River Basin are relatively high, but the
transportation efficiency and the tourism eco-efficiency of Inner Mongolia need to be improved. The
transportation efficiency has a positive impact on the tourism eco-efficiency, and the impact can reach its peak
in the short term, but the impact is long-term. The impact of the tourism eco-efficiency on the transportation
efficiency is not significant.
1 INTRODUCTION
In recent years, China’s tourism industry has
developed rapidly. According to the data from the
National Bureau of Statistics, the number of tourists
reached 6.072 billion in 2019, which has increased by
more than 6 times in 18 years. Although affected by
COVID-19 in 2020, the number of tourists has
reached 2.88 billion. With the large-scale
development of tourism activities, environmental
pollution and resource consumption caused by
tourism activities have also received extensive
attention (Azam, et al., 2018). How to realize the
coordinated development of ecological environment
protection and tourism has become a research hot
spot. Therefore, the concept of the tourism eco-
efficiency has gradually formed. The tourism eco-
efficiency’s focus is the integration of tourism,
ecology, and efficiency. It not only considers resource
energy consumption and environmental pollution, but
also measures the importance of the tourism
economic output. The tourism eco-efficiency is often
described as a variable in the relationship between the
a
https://orcid.org/0000-0001-5640-0570
tourism input and output. While the economic output
of tourism and the value of services increase, the
carbon emissions are reduced during the tourism
process. There are many measurement methods of the
tourism eco-efficiency, mainly including the ratio
method, the index system method, and the data
envelopment analysis (DEA) method. In recent years,
the DEA method have been widely used in the
measurement of the tourism eco-efficiency. The Un-
Super-SBM model is one of the most common DEA
models used by researchers.
There are many factors influencing tourism eco-
efficiency, and many researchers have conducted a lot
of discussions on both the macro and micro
perspectives. Looking at the existing literature on
tourism eco-efficiency research, it is found that
transportation has always been an important factor
influencing the tourism eco-efficiency. For example,
Gossling and Yao believe that the mode of
transportation is one of the main factors affecting the
tourism eco-efficiency (Gossling, et al., 2005), (Yao,
Chen, 2015). However, there are few papers that can
clearly explain the specific extent of the impact of
16
Zhang, Q.
The Impact of the Transportation Efficiency on the Tourism Eco-efficiency based on PVAR Model: A Case Study of the Yellow River Basin.
DOI: 10.5220/0011149400003437
In Proceedings of the 1st International Conference on Public Management and Big Data Analysis (PMBDA 2021), pages 16-21
ISBN: 978-989-758-589-0
Copyright
c
2022 by SCITEPRESS – Science and Technology Publications, Lda. All rights reserved

transportation on the tourism eco-efficiency. The
transportation efficiency is an index to evaluate the
comprehensive transportation system of a region, and
the most common method to measure the
transportation efficiency is the DEA method.
The Yellow River Basin is a key area for
ecological protection in China. In 2019, President Xi
proposed a major national strategy for ecological
protection and high-quality development in the
Yellow River Basin. The green and high-quality
development of the Yellow River Basin is one of
China's important tasks in the future. A planning for
the construction of the Yellow River National
Cultural Park in 2020 is proposed. With the
advancement of the construction of the National
Cultural Park, the tourism industry in the Yellow
River Basin will develop rapidly. The transportation
infrastructure of the Yellow River Basin has been
greatly improved in recent years. Therefore, this
paper takes 9 provinces in the Yellow River Basin as
case sites, and calculates the transportation efficiency
and the tourism eco-efficiency based on the
transportation data and the tourism data from 2007 to
2019 to form the panel data, and uses the panel vector
autoregression (PVAR) model to study the impact of
the transportation efficiency on the tourism eco-
efficiency.
2 DATA AND METHODOLOGY
2.1 The Transportation Efficiency and
the Tourism Eco-efficiency
In order to study the impact of the transportation
efficiency on the tourism eco-efficiency in the Yellow
River Basin, we choose 9 provinces’ data in the
Yellow River Basin from 2007 to 2019, and calculate
the transportation efficiency and the tourism eco-
efficiency of each province by the SBM model. The
data in this article mainly come from the official
website of the National Bureau of Statistics
(http://www.stats.gov.cn/), Year Book of China
Transportation & Communication, Yearbook of
China Tourism Statistic, Yearbook of China Tourism,
and the yearbooks of 9 provinces in the Yellow River
Basin.
The measurement of the transportation efficiency
has not yet formed a unified index system. The impact
of transportation on tourism is mainly reflected in the
passenger transportation. So we mainly consider four
transportation modes: railway, highway, waterway,
and aviation. Therefore, we choose the railway
operating mileage, the highway line mileage, the
inland waterway mileage, the aircraft take-off and
landing sorties, and the number of employees in the
four modes as input indicators. And the passenger
volume and passenger turnover of the four modes of
transportation as output indicators. We use the Super-
SMB model to measure the transportation efficiency.
The SBM model is a data envelopment analysis
(DEA) method proposed by Tone, which overcomes
the shortcomings of ordinary DEA models that cannot
effectively deal with slack variables (Tone, 2001).
Tone put forward the Super-SMB model based on the
SBM model to deal with the effective decision-
making unit (DMU) in 2002 (Tone, 2002). We use X
to represent the input vector and Y to represent the
output vector. m and s represent the number of input
variables and output variables, respectively. We
consider n DMUs and define the matrices X, Y as
follows:
[
]
12
, ,...,
mn
n
Xxx x R
×
=∈
(1)
[
]
12
, ,...,
s
n
n
Yyy y R
×
=∈
(2)
The equation of the Super-SBM model to
calculate DMU
00
,)
x
y(
is as follows:
0
1
0
1
1, 0
1, 0
00
1/ ( / )
min
1/ ( / )
. . ,
,
,0 , 0
m
ii
i
s
kk
k
n
ijj
j
n
kjj
j
ii k kj
mxx
s
yy
st x x
yy
xx y y
ρ
λ
λ
λ
=
=
=≠
=≠
=
≥
≤
≥≤≤ ≥
(3)
where
λ
is the intensity vector and
ρ
is the
efficiency value of the DMU.
At present, researchers prefer to use the Un-
Super-SBM model to measure the tourism eco-
efficiency. Based on previous papers, we take the
number of tourism companies (including the number
of star-rated hotels, the number of travel agencies, and
the number of A-level scenic spots), the number of
employees in the tourism industry, and the investment
value of fixed assets in the tourism industry as input
indicators. The number of tourists and the tourism
income are used as desirable output indicators. The
tourism carbon emissions are used as undesired
output. And the tourism carbon emissions refer to the
measurement method of Zha et al. (Zha, et al., 2020)
The Un-Super-SBM model adds undesired output
based on the Super-SBM model. We use X (1), Y (2)
and Z (4) to represent the input vector, the desirable
The Impact of the Transportation Efficiency on the Tourism Eco-efficiency based on PVAR Model: A Case Study of the Yellow River Basin
17
output vector, and the undesirable output vector. The
equation of the Un-Super-SBM model to calculate
DMU
000
,,)
x
yz(
is (5):
12
( , ,..., )
wn
n
Z
zz z R
×
=∈
(4)
1
0
11
00
0
1, 0
0
1, 0
0
1, 0
1
*= min
1
1
1( )
. . ,
,
,
0, 0, 0, 0
x
m
i
i
i
yz
sw
kl
kl
kl
n
x
ijji
j
n
y
kjjk
j
n
z
ljjl
j
xyz
ikl j
m
sw
s
x
ss
yz
st x x s
yys
zzs
sss
ρ
λ
λ
λ
λ
=
==
=≠
=≠
=≠
+
+
−+
≥−
≤+
≥−
≥≥≥≥
(5)
where m, s, and w are the number of input variables,
desirable outputs variables, and undesirable output
variables. And
*
ρ
is the efficiency value of the
DMU.
x
s
,
y
s
, and
z
s
represent the slacks in input,
desirable output, and undesirable output.
We use the software called MaxDEA Ultra to
calculate the Super-SBM model and the Un-Super-
SBM model. In the calculation process below, the
transportation efficiency is abbreviated as TRE and
the tourism eco-efficiency is abbreviated as TOEE.
2.2 Panel Vector Autoregression Model
In order to explore the impact of the transportation
efficiency on the tourism eco-efficiency in the Yellow
River Basin, the panel vector autoregression (PVAR)
model established in this paper is as follows:
0
1
,1,2,,
k
it j it j i t it
j
YY iT
λγ αβε
−
=
=+ +++ =
…
(6)
(, )
T
it it it
Y TRE TOEE=
(7)
where
it
Y
is a two-dimensional column vector. TRE
and TOEE respectively represent the transportation
efficiency and the tourism eco-efficiency. The k
represents the lag order.
i
α
and
t
β
respectively
represent fixed effect and time effect.
j
γ
represents
the matrix of lag period coefficients to be estimated.
0
λ
represents the 2×1 order intercept term vector.
it
ε
represents the random disturbance term vector. To
avoid heteroscedasticity, we take the logarithm of
both TRE and TOEE, namely lnTRE and lnTOEE.
Table 1: The results of the transportation efficiency.
Year SX IM SD HN SC SH GS QH NX
2007 1.31 1.14 1.85 1.57 1.83 1.76 1.27 1.13 1.82
2008 1.37 1.07 2.17 3.60 1.94 1.64 1.45 1.79 1.91
2009 1.21 1.07 2.12 1.57 1.75 2.09 1.28 1.87 1.90
2010 1.27 1.06 2.07 1.64 1.61 1.90 1.27 1.92 2.10
2011 1.28 1.04 1.89 1.33 1.75 2.59 1.33 1.99 2.06
2012 1.24 1.16 1.88 1.45 1.52 1.90 1.44 2.27 1.96
2013 1.27 1.25 2.03 1.48 1.62 1.95 1.45 3.19 2.31
2014 1.26 1.25 1.60 1.42 1.61 1.84 1.36 1.34 2.28
2015 1.26 1.22 1.58 1.47 1.80 1.93 1.40 2.64 2.34
2016 1.26 1.37 1.61 1.47 1.47 1.86 1.31 1.22 2.48
2017 1.25 1.33 1.62 1.61 1.39 1.78 1.42 1.18 2.50
2018 1.25 1.34 1.60 1.52 1.57 1.68 1.25 1.20 2.33
2019 1.29 1.07 1.63 1.47 1.68 2.13 1.28 2.78 2.40
PMBDA 2021 - International Conference on Public Management and Big Data Analysis
18
Table 2: The results of the tourism efficiency.
Year SX IM SD HN SC SH GS QH NX
2007 1.06 0.54 1.13 1.41 1.12 0.64 0.32 1.12 1.35
2008 1.08 0.52 1.15 1.68 1.05 0.60 0.30 1.48 1.32
2009 1.10 0.58 1.15 1.44 1.07 0.82 0.32 1.70 1.33
2010 1.06 0.53 1.21 1.32 1.16 0.81 0.40 1.64 1.37
2011 1.10 0.53 1.20 1.21 1.15 0.95 0.52 1.58 1.27
2012 1.07 0.45 1.15 1.08 1.23 1.05 0.51 1.60 1.24
2013 1.07 0.44 1.13 1.19 1.19 1.04 0.59 1.66 1.32
2014 1.11 0.50 1.10 1.23 1.28 1.06 0.69 1.52 1.30
2015 1.28 0.41 1.08 1.18 1.30 1.01 0.61 1.33 1.44
2016 1.36 0.48 1.05 1.05 1.30 1.04 0.57 1.23 1.27
2017 1.45 0.38 1.09 1.05 1.13 1.06 0.73 1.14 1.49
2018 1.36 0.41 1.10 1.03 1.07 1.07 0.72 1.06 1.67
2019 1.38 0.44 1.06 1.04 1.06 1.05 1.06 1.13 1.54
3 RESULTS
3.1 The Results of the Transportation
Efficiency and the Tourism
Eco-efficiency
The Super-SBM model and the Un-Super-SBM
model are used to evaluate the transportation
efficiency and the tourism eco-efficiency of 9
provinces in the Yellow River Basin. The results are
shown in Table 1 and Table 2.
It can be found from Table 1 that each
transportation efficiency in the Yellow River Basin is
greater than 1.00, indicating that the overall
transportation efficiency of the Yellow River Basin is
relatively high. The transportation efficiency of
Shandong (SD), Shaanxi (SH), Ningxia (NX) and
Sichuan (SC) is higher than that of other provinces.
Inner Mongolia (IM), Gansu (GS) and Shanxi (SX)
have lower transportation efficiency. Qinghai’s (QH)
transportation efficiency is unstable and fluctuates
greatly.
It can be found from Table 2 that, except for Inner
Mongolia, Shaanxi and Gansu, the tourism eco-
efficiency in other provinces is relatively higher
(greater than 1.00). However, the tourism eco-
efficiency in Shaanxi and Gansu has shown an
upward trend, and has exceeded 1.00 in recent years.
The tourism eco-efficiency in Henan (HN) and Inner
Mongolia has a downward trend.
3.2 Empirical Analysis of PVAR Model
3.2.1 Stationarity Test
In order to prevent the spurious regression caused by
non-stationary variables and ensure the validity of the
estimation results, we use LLC test to test the
stationarity of lnTOEE and lnTRE. The results are
shown in Table 3. The results show that both series
are stationary.
Table 3: The results of LLC test.
T Statistics P-value
lnTRE -6.6648
***
0.0000
*** stands for the significance level of 1%.
3.2.2 Determining the Optimal Lag Order
We choose the maximum lag order at 3 and use three
information criteria (AIC, BIC and HQIC) to
determine the optimal lag order. The calculation
results of the information criteria are shown in Table
4. According to the results of the three information
criteria, the optimal lag order is selected as 3.
Table 4: The results of the optimal lag order.
Lag AIC BIC HQIC
1 -2.37741 -1.80072 -2.14408
2 -2.87812 -2.15595
*
-2.5869
3 -2.94468
*
-2.05785 -2.58887
*
* stands for the optimal lag order determined by the AIC,
BIC and HQIC information criteria.
The Impact of the Transportation Efficiency on the Tourism Eco-efficiency based on PVAR Model: A Case Study of the Yellow River Basin
19
3.2.3 Granger Causality Test
We use the optimal lag order to perform Granger
Causality Test on lnTOEE and lnTRE. The results
shown in Table 5 suggest that lnTRE is the granger
cause of lnTOEE, but lnTOEE is not the granger
cause of lnTRE. It shows that the transportation
efficiency can affect the tourism eco-efficiency.
Table 5: The results of granger causality test.
Equation Excluded Chi2 P-value
h_lnTOEE h_lnTRE 10.2480
**
0.017
h_lnTRE h_lnTOEE 2.0791 0.556
** stands for the significance level of 5%.
3.2.4 Impulse Response Function
The impulse response function (IRF) can analyse the
impact of an endogenous variable on other variables,
that is, how current value and future value of the
variable will be affected when the model is impacted
or the random error term changes. There are four
response graphs of lnTOEE and lnTRE, including
response graphs of these two variables to itself and
the mutual response graphs of them. According to the
results of the Granger Causality Test, we mainly
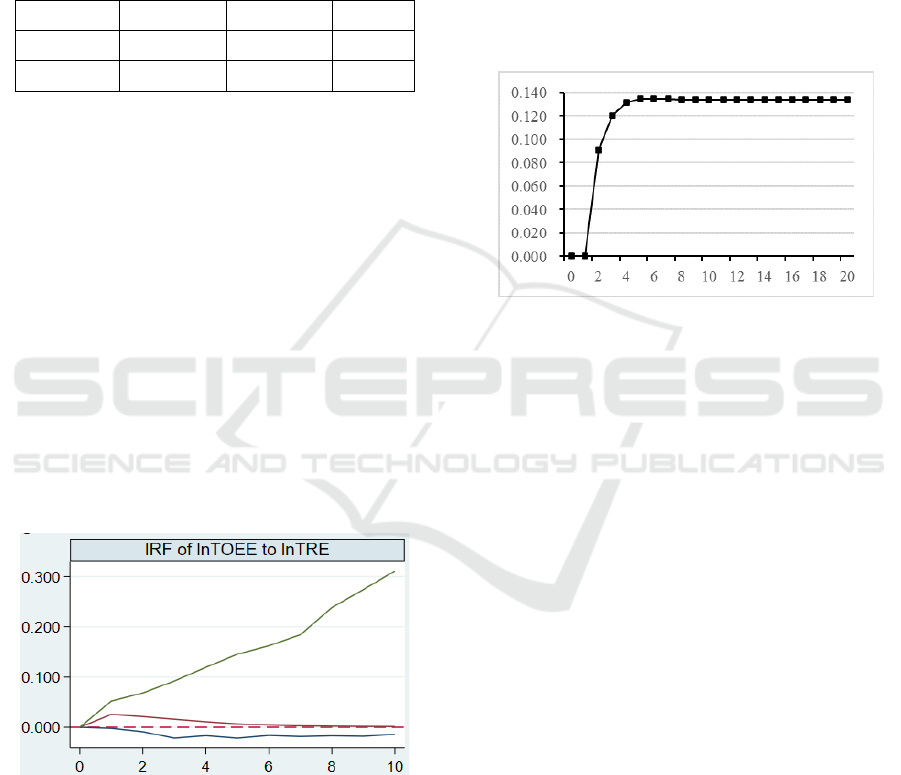
analyse the IRF of lnTOEE to lnTRE. Figure 1 is the
graph of IRF of lnTOEE to lnTRE. lnTOEE has a
positive response to the impact of lnTRE. After being
impacted by lnTRE by one standard deviation,
lnTOEE reaches its peak in the first period, and then
gradually decreases. And it lasts a long time.
Figure 1: The impulse response function.
3.2.5 Variance Decomposition
We use variance decomposition to measure the
proportion of lnTOEE impacted by lnTRE (the
variance contribution rate of lnTRE to lnTOEE) to
further explore the impact of the transportation
efficiency on the tourism eco-efficiency. Figure 2 is
the graph of the variance decomposition results for 20
forecast periods. In the first forecast period, lnTOEE
is not affected by lnTRE. In the second prediction
period, the variance contribution rate of lnTRE to
lnTOEE increases rapidly to 9.1%. And then the
growth rate gradually slows down. The variance
contribution rate reaches the maximum value of
13.5% in the fifth period, and remains until the
seventh forecast period, after which the variance
contribution rate falls to 13.4% in the eighth period
and remains unchanged for a long time. It shows that
the transportation efficiency can affect the tourism
eco-efficiency, and this impact will exist for a long
time.
Figure 2: The results of the variance decomposition.
4 CONCLUSIONS
Based on the transportation data and the tourism data
of 9 provinces in the Yellow River Basin from 2007
to 2019, we use Super-SBM model and Un-Super-
SBM model to measure the transportation efficiency
and the tourism eco-efficiency. The PVAR model is
used to explore the impact of the transportation
efficiency on the tourism eco-efficiency.
Except for Inner Mongolia, the transportation
efficiency and the tourism eco-efficiency of the other
provinces in the Yellow River Basin are at a higher
level. The transportation efficiency and the tourism
eco-efficiency of Inner Mongolia need to be
improved.
From 2007 to 2019, the transportation efficiency
of the 9 provinces in the Yellow River Basin has a
positive impact on the tourism eco-efficiency, but the
tourism eco-efficiency has no significant impact on
the transportation efficiency. The impact of the
transportation efficiency on the tourism eco-
efficiency reaches the peak (13.5%) in the fifth
forecast period, but drops to 13.4% after maintaining
three forecast periods and remains unchanged for a
long time. The impact of the transportation efficiency
on the tourism eco-efficiency can be seen in the short
term, but the impact is long-term.
PMBDA 2021 - International Conference on Public Management and Big Data Analysis
20

REFERENCES
Azam, M., Alam, M., Hafeez, M. H. (2018). Effect of
tourism on environmental pollution: further evidence
from Malaysia, Singapore and Thailand. J. Journal of
Cleaner Production. 190, 330–338.
Gossling, S., Peeters, P., Ceron, J. P., Dubois, G. (2005).
The eco-efficiency of tourism. J. Ecological
Economics. 54, 417–434.
Tone, K. (2001). A slacks-based measure of efficiency in
data envelopment analysis. J. European Journal of
Operational Research. 130, 498–509.
Tone, K. (2002). A slacks-based measure of super-
efficiency in data envelopment analysis. J. European
Journal of Operational Research. 143, 32–41.
Yao, Z. G., Chen, T. (2015). Tourism eco-efficiency model
and an empirical research. J. China Population,
Resources and Environment. 25, 113–120.
Zha, J. P., Yuan, W. W., Dai, J. Q., Tan, T., He, L. M. (2020).
Eco-efficiency, eco-productivity and tourism growth in
China: a non-convex metafrontier DEA-based
decomposition model. J. Journal of Sustainable
Tourism. 28, 663–685.
The Impact of the Transportation Efficiency on the Tourism Eco-efficiency based on PVAR Model: A Case Study of the Yellow River Basin
21
