
Analysis of Spatiotemporal Distribution and Non-stationary of
Extreme Precipitation Events during 1960-2018 in the Yellow River
Basin
Xianglin Lv
1
, Hongjing Yu
1
, Hao Dong
1
, Shibao Ji
1
, Yaqin Qiu
1,*
, Xvdong Duan
2
, Hao Zheng
2
1
National Key Laboratory of Basin Water Cycle Simulation and Control, China Institute of Water Resources &
Hydropower Research, Beijing 100078, P. R. China
2
Laboratory of Coastal Groundwater Utilization & Protection, Tianjin University of Science and Technology, Tianjin
300450, P. R. China
Keywords: Extreme precipitation, The Yellow River, Non-stationary
Abstract: Climate change has changed the extreme precipitation pattern in the Yellow River Basin (YRB). In this
article, total of six extreme indices of rainfall were employed to assess the spatial and temporal distribution
characteristics of extreme precipitation in YRB, and the GAMLSS model is applied in two typical stations
(Xinghai, Yuncheng) to investigate the non-conformity in terms of persistence-CDD, intensity-R95p, and
frequency-R20, respectively. The results showed that: a) In YRB, CDD had a significant upward trend,
while there was a clear downward trend in R20 and SDII (Simple daily intensity index), and the spatial
distribution of temporal trends varies greatly among regions, with an increasing tendency in the northwest
of YRB and decreasing tendency in the southeast of YRB, which was the opposite of the spatial distribution.
Indicating that rainfall decreased in the downstream of relatively wet basins, while rainfall increased in the
upstream of relatively dry basins. b) Both representative stations expressed non-stationarity, but with
different characteristics. In the stationary model (Model 0), the WEI (Weibull) was selected at most indices,
In the non-stationary model (Model 1), the GA (Gamma) was selected at most Climate indices. In Station
Xinghai in upper of YRB, drought days decreased, the mean and variance of the R20 and R95p distribution
functions were increasing which indicates that the inter-annual variation became larger and more prone to
extreme flooding or extreme drought. Station Yuncheng in lower of YRB also has fewer drought days,
however the mean and variance of the R20 and R95p are decreasing which indicates more stable
precipitation and a lower chance of extreme events than before.
1 INTRODUCTION
For hydrological cycle, precipitation is vital and
directly affects the flood and drought events in an
area. Warming leads to greater evaporation, 7%
increase in air holding capacity for every 1 degree
rise in temperature, more intense precipitation events
would be widespread, even in places where total
precipitation is reduced (Trenberth, 2011).
Furthermore, precipitation change may differ in
different aspects, such as totals and extremes (Donat
et al., 2016). In addition, non-stationarity has been
widely reported in hydrological time series analysis,
and related studies have shown that rainfall series
also exhibit non-stationary characteristics (Zhang et
al., 2016; Gu et al., 2019; Wu et al., 2021; Medeiros
et al., 2019). Consequently, research about the
spatiotemporal dynamics of extreme precipitation
and its distribution pattern under the changing
environment is significant for the monitoring and
prevention of climate disasters like floods and
droughts (Zou et al., 2021).
For the latest years, the dynamic changes of
spatial and temporal variability and non-stationarity
of extreme precipitation has attracted the attention of
many scholars. Gao et al. (2018) used six climate
variables based on GAMLSS showing the existence
of non-stationarity in the Coastal areas of Southeast
China. Lei et al. (2021) pointed out the intensity
indices (PRCPTOT, SDII, R99P) and frequency
indices (R20, R10) of extreme precipitation showed
stationary characteristics, however the duration
indices (CWD, CDD) showed non-stationary
494
Lv, X., Yu, H., Dong, H., Ji, S., Qiu, Y., Duan, X. and Zheng, H.
Analysis of Spatiotemporal Distribution and Non-stationary of Extreme Precipitation Events during 1960-2018 in the Yellow River Basin.
In Proceedings of the 7th International Conference on Water Resource and Environment (WRE 2021), pages 494-503
ISBN: 978-989-758-560-9; ISSN: 1755-1315
Copyright
c
2022 by SCITEPRESS – Science and Technology Publications, Lda. All rights reserved
characteristics in the Poyang Lake Basin of China.
Hao et al. (2019) used two precipitation indices
(RX5day, R20) which choose two covariates, time
and climate, to determine the non-stationarity of
extreme precipitation in the Han River basin of
China. Liu et al. (2008) shows that precipitation is
significantly correlated with longitude and not with
latitude, and exhibits a downward trend at most
stations in the YRB. S Swain et al., showed that
annual rainfall has increased by 10.65% from 1901-
2002 by Sen’s slope and Mann-Kendall (M-K) test
(Swain et al., 2019). He et al., used M-K method to
analyze the temporal trends of extreme rainfall index
in YRB from 1960 to 2012, and its spatial
distribution (He & He, 2014). Yang et al. (2017)
pointed out that the frequency of extreme
precipitation exists significant increasing trends by
POT sampling method.
.
Existing studies have been concentrating on the
Spatiotemporal patterns of extreme rainfall indices
and their effects. This research adopts the Modified
Mann-Kendall (MM-K) method to compensate for
the shortcomings of autocorrelation in the MK test,
and establishes the GAMLSS model with time as the
independent variable to investigate the change of the
distribution function of extreme rainfall index in
YRB.
2 STUDY AREA AND DATA
COLLECTION
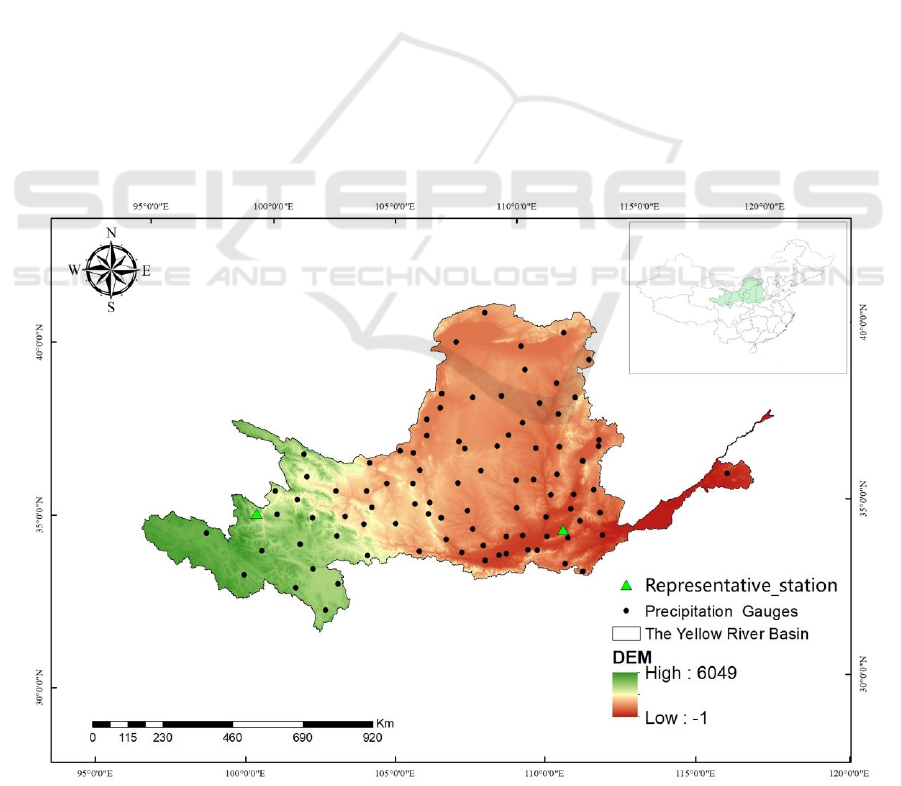
YRB is located in the arid and semi-arid regions
(between 96°-116°E and 32°-42°N), arid in the west,
wet in the east, dry in winter and dry in spring, rainy
in summer and autumn. YRB has an important
influence in northern China (Fig 1.). YRB has a huge
difference in elevation from east to west, and the
geomorphology varies greatly between different
regions. In addition, it is in the mid-latitude zone,
which is affected by atmospheric circulation and
monsoon circulation in a complex way, and the
climate varies significantly in different areas of YRB.
The data used were obtained from the daily
precipitation data of 874 stations from 1960 to 2018
provided by the China Meteorological Science Data
Sharing Service, including 91 precipitation stations
in the Yellow River basin, and the location of
precipitation stations is shown in Figure 1. To ensure
the continuity and uniformity of the precipitation
data, only the years with continuous measured data
were included. Secondly, all data were checked for
outliers to ensure data integrity and accuracy.
Figure 1: Location of meteorological stations and study area.
Analysis of Spatiotemporal Distribution and Non-stationary of Extreme Precipitation Events during 1960-2018 in the Yellow River Basin
495

3 METHODS
3.1 Extreme Precipitation Index
Six extreme precipitation indices were selected from
the 27 extreme climate indices recommended by the
Expert Group on Climate Change Monitoring and
Indicators jointly established by WMO, Commission
for Climatology (CCI) and other meteorological
organizations (Costa & Soares, 2009), as shown in
Table 1. All extreme precipitation indices were
calculated using RClimate software.
Table 1: Definition of extreme precipitation indices.
Index Name Definition Unit
SDII
Simple daily intensity
index
Annual total precipitation divided by the number of wet days
(
defined as PRCP>=1.0mm
)
in the
y
ea
r
mm/d
PRCPTOT
Annual total wet-day
p
recipitation
Annual total PRCP in wet days (Rain Rate (RR)>=1mm) mm
R95P Ver
y
wet da
y
s Annual total PRCP when RR>95
th
p
ercentile m
m
CDD Consecutive dr
y
da
y
s Maximum number of consecutive da
y
s with RR<1m
m
d
R10
Number of heavy
p
reci
p
itation da
y
s
Annual count of days when PRCP>=10mm d
R20
Number of very heavy
p
recipitation days
Annual count of days when PRCP>=20mm d
3.2 MM-K Trend Analysis Method
The M-K test is an important nonparametric trend
test for time series, which is widely used in the field
of hydrological statistics because it does not require
the series to be examined to obey a certain
probability distribution, overcoming the problems of
bias, non-identical distribution, and having outliers
in hydrological data. Although the MK method has
the advantages of nonparametric tests, it does not
solve the problem of data independence required in
statistical tests of hydrological series (Zhang et al.,
2013). Hamed and Rao (1998) proposed a Modified
Mann-Kendall test which corrected V (S) by using
the effective sample size (ESS), which reflects the
effect of serial autocorrelation on the test results
(Tian et al., 2017). Swain et al. (2021) showed a
significantly increasing trend of drought in Narmada
River Basin. The corrected V (S) equation is as
follows:
𝑉
∗
(
𝑆
)
=𝑉
(
𝑆
)
∗
(1)
∗
=1+
() ()
∑
(𝑛 − 𝑘) (𝑛 − 𝑘 − 1) (𝑛 − 𝑘 − 2)𝑟
(2)
𝑟
=
∑[
(
)]
[
(
)]
∑
[
(
)]
(3)
𝐸
(
𝑋
)
=
∑
𝑋
(4)
3.3 GAMLSS Model
The GAMLSS model is a generalizable additive
model based on the location parameter, scale
parameter and shape parameter (Rigby &
Stasinopoulos, 2005). It extends the form of the
assumption of the distribution from exponential
distribution to a more generalized form, which can
be parametric or nonparametric model for the
location parameter, scale parameter and shape
parameter of a distribution simultaneously under
various distribution assumptions, describing the
linear or nonlinear relationship between any
statistical parameter of the sequence of random
variables and the explanatory variables (Zhang et al.,
2015; Zhang et al., 2014). Then the regression
relationship between the distribution factors,
explanatory variables, and random effects are as
follows:
𝑔
(
𝜃
)
=𝑋
𝛽
+
∑
ℎ
(𝑥
)
(5)
Where 𝑔
is the monotonic connection function;
𝜃
is the vector of k distribution parameter with
length n; 𝑋
is the explanatory variable in the n ×m
matrix; 𝛽
is the parameter vector of length m;
and ℎ
(.) represents the joint function (the cubic
WRE 2021 - The International Conference on Water Resource and Environment
496

spline function is applied here) between the
distribution parameters and explanatory variables 𝑥
.
The linear function and cubic spline function are
chosen as the parameter to explain the function of
association between variables. Five distributions,
lognormal (LOGNO), gamma (GA), normal (NO),
Weibull (WEI) and logistic (LO), were applied to
model the extreme precipitation data. The Akaike
Information Criterion (AIC) was used to penalize
overfitting of the models and to select the best model
(Arnold, 2010). The best model fit is evaluated by
snail plot and the independence and normality of the
residuals are checked.
4 RESULTS
4.1 Temporal Variation of Extreme
Precipitation Characteristics in the
Yellow River Basin
According to the daily data from 91 precipitation
stations in YRB, a total of six extreme precipitation
indices, CDD, PRCPTOT, R10, R20, R95P and SDII,
were calculated for each precipitation station year by
year, and the Thiessen polygon method was used to
calculate the extreme precipitation indices. The
MMK test results for these indices are presented in
Table 2.
Table 2: MMK trend results.
trend h z-value slope intercept mean
CDD decreasing TRUE -4.49 -1.08 101.34 85.55
PTOT no trend FALSE -0.66 -0.34 579.37 568.45
R10 no trend FALSE 0.16 0.005 15.78 15.92
R20 increasing TRUE 2.03 0.02 5.20 5.58
R95P no trend FALSE -0.90 -0.36 142.21 134.80
SDII increasing TRUE 2.83 0.02 7.30 7.34
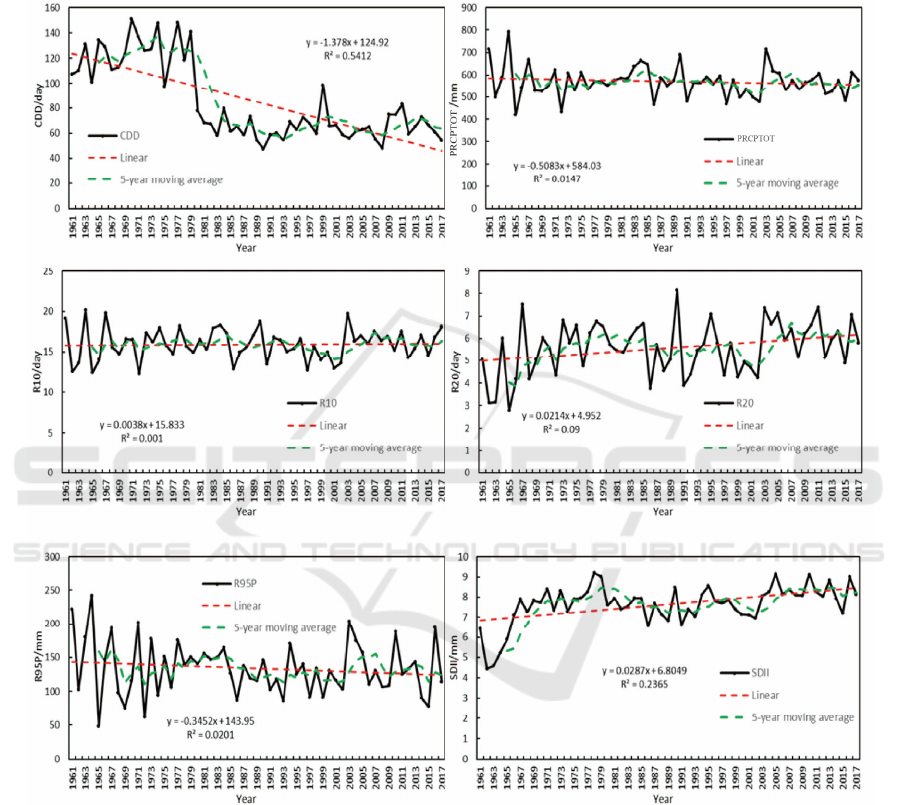
As shown in Figure 2, CDD, PRCPTOT, and
R95P showed a decreasing trend, and R10, R20, and
SDII showed an increasing trend and slope of -1.08/a
(CDD), -0.34mm/a (PRCPTOT), 0.005mm/a (R10),
0.02mm/a (R20), - 0.36mm/a (R95P), and 0.02mm/a
(SDII). The decreasing trend of CDD was significant
(Z=-4.49), and the increasing trend of R20 (Z=2.03)
and SDII (Z=2.83) was significant. Hence the trend
of drought is decreasing, and precipitation
distribution is more homogeneous in annual basis.
Daily precipitation intensity showed a significant
increasing trend, while annual precipitation showed
a non-significant decreasing trend. In contrast, R20
shows a significant increasing trend and R10 shows
a non-significant increasing trend, indicating that the
frequency of extreme precipitation in YRB in recent
years is dominated by moderate and heavy rainfall,
and the precipitation process is more concentrated.
From Figure 3, the number of CDD in YRB basin
showed a decreasing trend, with the most drastic
decrease in the northwestern and northeastern parts
of YRB, the trend of PRCPTOT is increasing in the
northwestern part of the basin. In the southern parts
of the basin, the number of consecutive dry days
decreased the least, the number of wet days
increased the least, and the PRCPTOT was also in a
decreasing trend and more significant.
The number of light rain days, R10, was on a
decreasing trend in the central, southern, and eastern
parts of the study area. The trend in the northwest is
consistent with that of PRCPTOT, but differs in the
Yellow River source area, where the annual
precipitation increases, and the number of light rain
days R10 shows a decreasing trend and the number
of medium rain days R20 shows an increasing trend.
Compared with PRCPTOT and R10, R20 and
R95P also showed an increasing trend in the middle
part of YRB, indicating that the decrease in annual
precipitation in the middle part of YRB was mainly
caused by the decrease in the number of light rain
days, and the number of medium rain days showed
an increasing trend in contrast to the decrease in
annual precipitation. The increase in the frequency
of moderate and heavy rainfall somewhat suppressed
the decrease in annual precipitation caused by the
decrease in light rainfall.
4.2 Spatial Distribution of Extreme
Precipitation in the Yellow River
Basin
From Figure 4, significant differences could be
found in different regions of YRB, the CDD values
range from 40.2-147.6, PRCPTOT ranges from
Analysis of Spatiotemporal Distribution and Non-stationary of Extreme Precipitation Events during 1960-2018 in the Yellow River Basin
497
155.4-1144, light rain days between 4.716-29.59,
medium rain days between 0.679-17.38, R95P
between 39.96-73.38, and SDII between 3.27-15.95.
In the study area, except for SDII, the multi-year
average of extreme precipitation indices basically
shows a distribution characteristic of gradually
increasing from northwest to southeast, and SDII
shows a distribution characteristic of gradually
increasing from west to east. The results are
consistent when comparing the spatial distribution of
Yang Peiyu using POT sampling with 95% quantile
as the threshold.
Figure 2: Time series of extreme precipitation index in YRB.
4.3 Non-stationary Analysis of Extreme
Precipitation in YRB
From the upper and lower reaches of YRB, two
stations (Xinghai, Yuncheng) were selected as the
representative stations for non-stationarity analysis.
Three indices were selected from six extreme
climate indices as mentioned in preceding part of the
paper. These are Consecutive dry days (CDD) that
can describe the persistence of extreme precipitation
events, the number of very heavy rainfall days (R20)
which can describe the frequency of extreme
precipitation events, the Very wet days (R95p) which
can indicate the intensity of extreme precipitation
events.
WRE 2021 - The International Conference on Water Resource and Environment
498
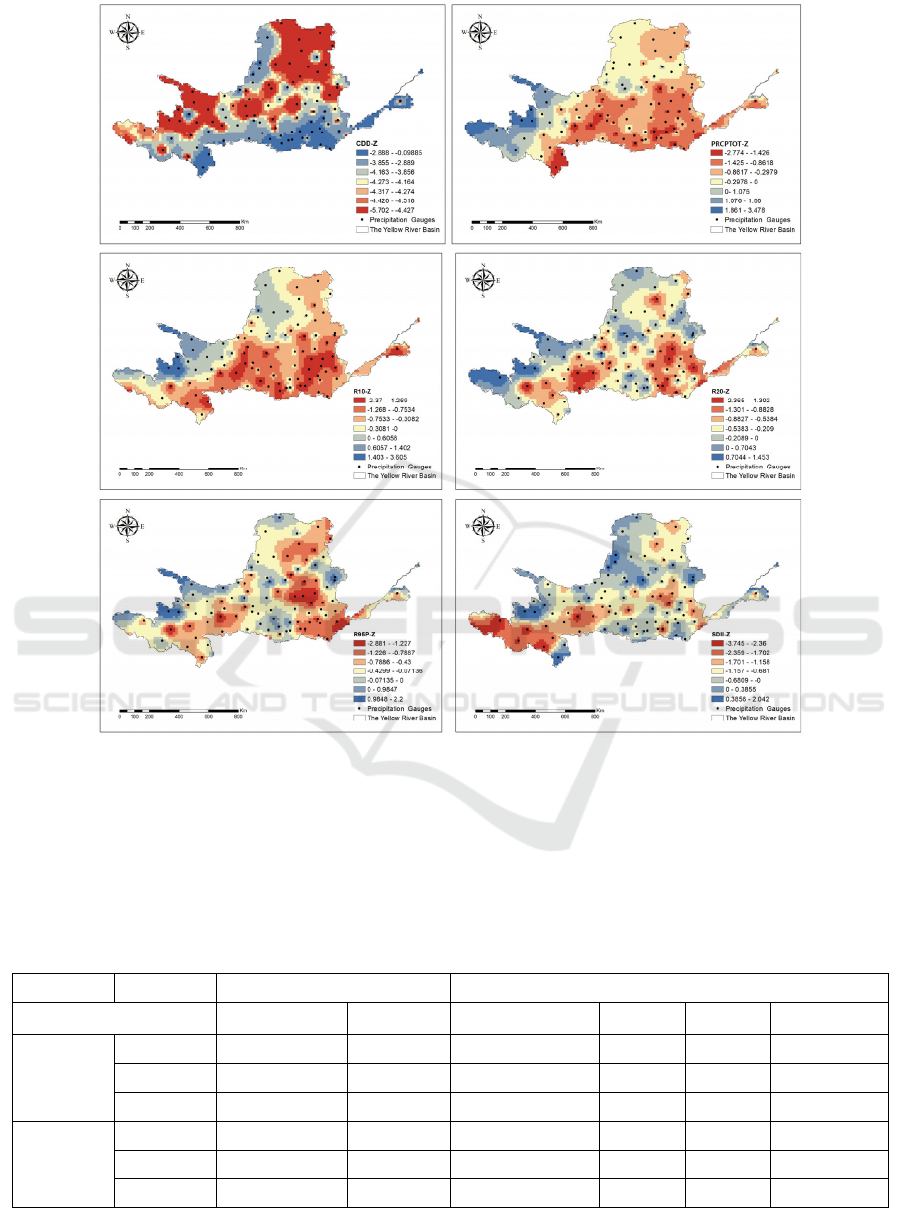
Figure 3: Spatial distribution of MMK test results in the Yellow River Basin.
Based on the AIC values, one distribution with
the best fit was selected for each site. (from Table 3).
In the Model 0, the WEI was selected at most indices
(4 indices), GA and LOGNO performed best at one
Indexes. In the Model 1, the GA was selected at most
Climate indices (4 indices), NO and WEI performed
best at one index.
Table 3: Summary for the fitted models with time as the covariate: cs () indicates the dependence is via the cubic splines;
and ct refers to a parameter that is constant.
Model 0 Model 1
Extreme Index Distribution AIC Distribution θ
1
θ
2
AIC
Xinghai
CDD WEI 630.3423 NO cs (t,3) ct 596.2364
R95p WEI 628.8753 WEI cs (t,0) cs (t,2) 622.2544
R20 GA 192.6919 GA cs (t,3) ct 189.9838
Yuncheng
CDD LOGNO 571.527 GA
ct
cs (t,0) 565.378
R95p WEI 697.5988 GA cs (t,0) cs (t,2) 697.0961
R20 WEI 309.0856 GA ct cs (t,2) 308.5433
Analysis of Spatiotemporal Distribution and Non-stationary of Extreme Precipitation Events during 1960-2018 in the Yellow River Basin
499
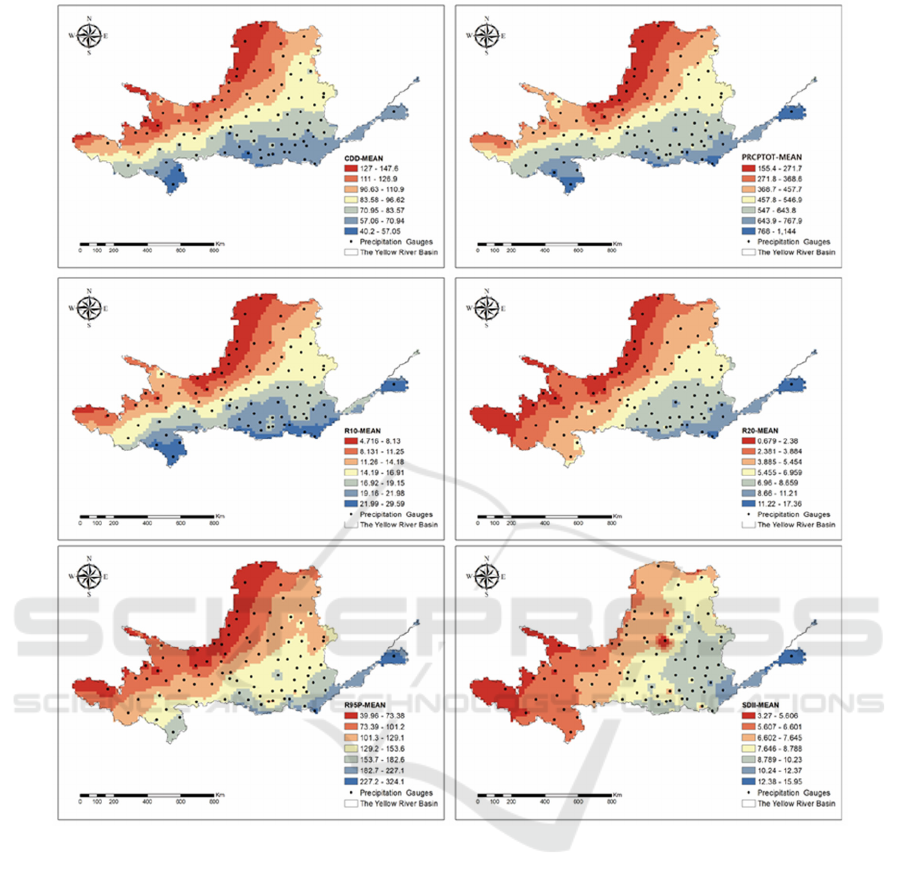
Figure 4: Spatial distribution of extreme precipitation in the YRB.
Model 0 is a steady-state model with constant
mean and variance, and Model 1 is a non-stationary
model with varying mean and variance which time is
covariate). The smaller AIC values for the non-
stationary model 1 compared to the stationary model
0 suggest that the non-stationary model 1 indicates
that the model with time as a covariate performs
better than the model with constant parameters. From
table 3, the parameter θ
1
is the cubic spline function
with degree of freedom 3 and the parameter θ
2
is
constant in Xinghai-CDD and Xinghai-R20. The
parameter θ
1
is constant and the parameter θ
2
is
the
cubic spline function with degree of freedom 3
in
Yuncheng-CDD and Yuncheng-R20. The parameter
θ
1
is linear trend function and the parameter θ
2
is the
cubic spline function with degree of freedom 2 in
Xinghai-R95p and Yuncheng-R95p.
Figure 5, whose vertical coordinate is the normal
normalized residual series, and the horizontal
coordinate is the theoretical residual value, shows
the worm plot of the residuals of the optimal model
for each index, and the red line in the middle is a
cubic polynomial curve fitted by the series of scatter
points in the plot. All the scatter points in the worm
plot lie within the confidence interval between the
upper and lower curves. The above fitting results
show that the residual series of the optimal model for
each site can be considered to obey the standard
normal distribution, and thus the distribution type
and parameter selection of each preferred model
WRE 2021 - The International Conference on Water Resource and Environment
500
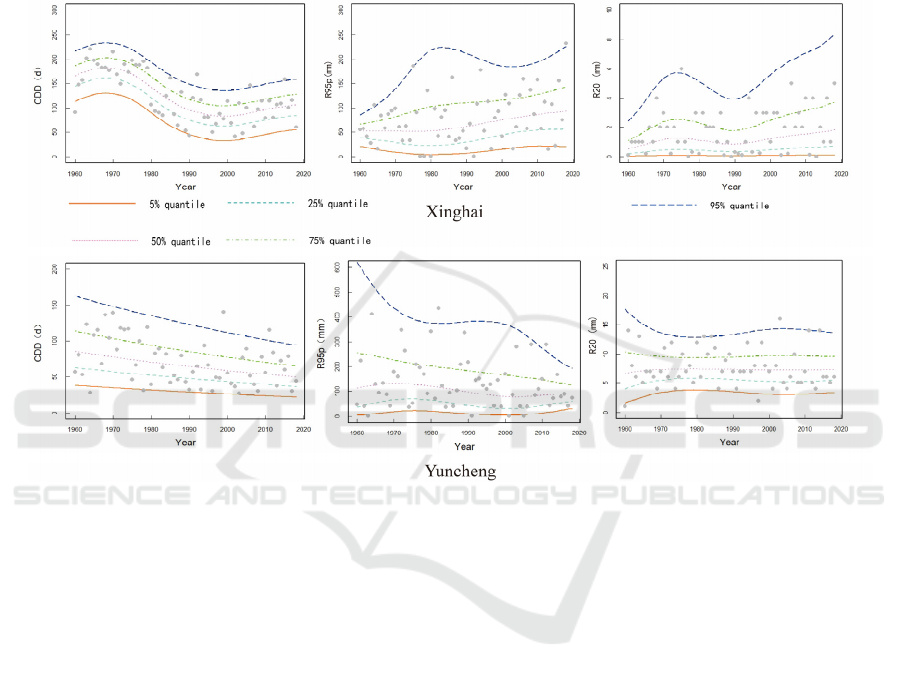
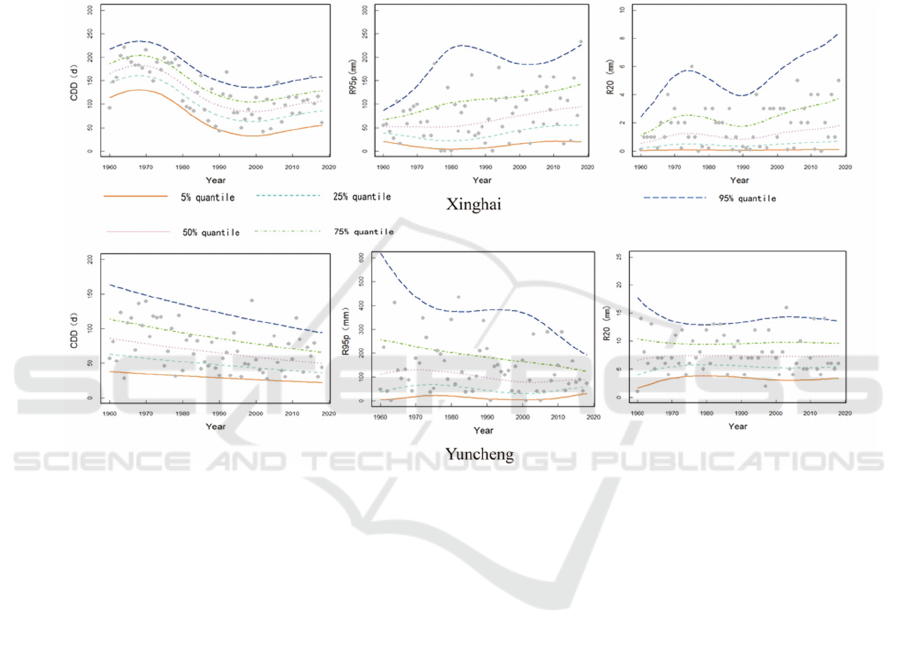
constructed earlier can be judged to be reasonable.
Based on the distribution and parameters of each
preferred model, the quantile values corresponding
to each indicator series at the specified time and at
the specified percentile can be calculated. Figure 6
shows the quantile plot for each indicator series,
where the dots represent the measured values for
each year at the site, and the solid lines of different
colors represent the quantile values corresponding to
the five percentiles of 5%, 25%, 50%, 75%, and 95%,
respectively. Most of the data points are between 5%
and 95% of the quantile curve. It indicates that the
simulation results of the theoretical distribution of
each station match well with the distribution of the
actual measured points.
Figure 5: The residual worm diagram of the optimal model.
In terms of persistence of dry day (CDD), the
parameter θ
1
related to the mean value of the
extreme precipitation events has a nonlinear
decreasing trend in station Xinghai, the parameter θ
2
related to the fluctuation of the extreme precipitation
events has no significant trend in station Xinghai.
The parameter θ
1
is on a linear decreasing trend in
station Yuncheng, The parameter θ
2
also has a linear
decreasing trend in station Yuncheng.
In terms of intensity (R95p), the parameter θ
1
is
on a nonlinear decreasing trend in station Xinghai,
the parameter θ
2
has a nonlinear increasing trend in
station Xinghai. The parameter θ
1
is on a nonlinear
decreasing trend in station Yuncheng, the parameter
θ
2
also has a nonlinear decreasing trend in station
Yuncheng.
In terms of frequency (R20), the parameter θ
1
is
on a nonlinear increasing trend in station Xinghai,
the parameter θ
2
also has a nonlinear increasing trend
in station Xinghai. The downward trend of parameter
θ
1
is non-significant in station Yuncheng, the upward
of parameter θ
2
is non-significant in station
Yuncheng.
5 CONCLUSION
In this paper, we analyzed the spatiotemporal
variation of six extreme precipitation indices in the
YRB from 1960 to 2018 by MMK trend test and
selected three indices in terms of persistence (CDD),
frequency (R20) and intensity (R95p) for non-
stationary analysis through GAMLSS model.
In YRB, CDD has a significant upward trend,
R20 and SDII have a significant downward trend,
and other indicators have no significant changes. In
addition, the spatial distribution of temporal trends
varies considerably between regions, with an upward
trend in the northwest and a downward trend in the
southeast. However, the spatial distribution of the
multi-year average values of the basin precipitation
indices shows an opposite trend which gradually
Analysis of Spatiotemporal Distribution and Non-stationary of Extreme Precipitation Events during 1960-2018 in the Yellow River Basin
501
increases from northwest to southeast. Rainfall
decreases in the relatively wet downstream portion
of basin and increases in the relatively dry upstream
portion of basin, the gap between upstream and
downstream will gradually decrease.
In the Model 0, the WEI performed best at most
indices (4 indices), GA and LOGNO performed best
at one index. In the Model 1, the GA performed best
at most Climate indices (4 indices), NO and WEI
performed best at one index. In Station Xinghai in
upper parts of YRB, decreasing drought days, along
with the increasing mean and variance of the R20
and R95p distribution functions with time indicates
that the inter-annual variation became larger and
more prone to extreme flooding or extreme drought.
Station Yuncheng in lower of YRB also has fewer
drought days, however the mean and variance of the
R20 and R95p are decreasing which indicates more
stable precipitation and a lower chance of extreme
events than before.
Figure 6: 5%, 25%, 50%, 75% ,95%for two representative stations CDD, R95p, R20. 95% quantile.
ACKNOWLEDGMENTS
The researchers would like to extend their thanks to
the National Natural Science Foundation of China
(No. 52009140). The Independent Research Project
of State Key Laboratory of Simulations and
Regulation of Water Cycle in River Basin
(SKL2020ZY04).
REFERENCES
Arnold, T. W. (2010). Uninformative parameters and
model selection using Akaike's Information Criterion.
The Journal of Wildlife Management, 74(6), 1175-8.
Costa, A. C., & Soares, A. (2009). Trends in extreme
precipitation indices derived from a daily rainfall
database for the South of Portugal. International
Journal of Climatology, A Journal of the Royal
Meteorological Society, 29(13), 1956-75.
Donat, M. G., Lowry, A. L., Alexander, L. V., O’Gorman,
P. A., & Maher, N. (2016). More extreme precipitation
in the world’s dry and wet regions. Nature Climate
Change. 6(5), 508-13.
Gao, L., Huang, J., Chen, X., Chen, Y., & Liu, M. (2018).
Contributions of natural climate changes and human
activities to the trend of extreme precipitation.
Atmospheric Research, 205, 60-9.
Gu, X., Zhang, Q., Li, J., Singh, V. P., & Sun, P. (2019).
Impact of urbanization on non-stationarity of annual
and seasonal precipitation extremes in China. Journal
of Hydrology, 575, 638-55.
Hamed, K. H., & Rao, A. R. (1998). A modified Mann-
Kendall trend test for autocorrelated data. Journal of
Hydrology, 204(1-4), 182-196.
Hao, W., Shao, Q., Hao, Z., Ju, Q., Baima, W., & Zhang, D.
(2019). Non‐stationary modelling of extreme
precipitation by climate indices during rainy season in
Hanjiang River Basin, China. International Journal of
Climatology, 39(10), 4154-69.
WRE 2021 - The International Conference on Water Resource and Environment
502

He, Z., & He, J. (2014). Temporal and spatial variation of
extreme precipitation in the Yellow River Basin from
1960 to 2012. Resources science, 36(3), 490-501.
Rigby, R. A., & Stasinopoulos, D. M. (2005). Generalized
additive models for location, scale and shape. Journal
of the Royal Statistical Society, 54, 507-554.
Lei, X. Y., Gao, L., Ma, M. M., Dang, H. F., & Gao, J. Y.
(2021). Temporal-spatial and non-stationarity
characteristics of extreme precipitation in the Poyang
Lake Basin, China [J/OL]. Chinese Journal of Applied
Ecology, 2021, 1-11.
Liu, Q., Yang, Z., & Cui, B. (2008). Spatial and temporal
variability of annual precipitation during 1961–2006 in
Yellow River Basin, China. Journal of hydrology,
361(3-4), 330-8.
Medeiros, E. S., de Lima, R. R., Olinda, R. A., Dantas, L.
G., & Santos, C. A. (2019). Space–Time Kriging of
Precipitation, Modeling the Large-Scale Variation with
Model GAMLSS. Wat e r, 11(11), 2368.
Swain, S., Mishra, S. K., & Pandey, A. (2021). A detailed
assessment of meteorological drought characteristics
using simplified rainfall index over Narmada River
Basin, India. Environmental Earth Sciences, 80(6), 221.
Swain, S., Dayal, D., Pandey, A., & Mishra, S. K. (2019).
Trend analysis of precipitation and temperature for
Bilaspur District, Chhattisgarh, India. In World
Environmental and Water Resources Congress 2019,
Groundwater, Sustainability, Hydro-Climate/Climate
Change, and Environmental Engineering (pp. 193-204).
Reston, VA, American Society of Civil Engineers.
Tian, J., Liu, J., Wang, J., Li, C., Nie, H., & Yu, F. (2017).
Trend analysis of temperature and precipitation
extremes in major grain producing area of China.
International Journal of Climatology, 37(2), 672-87.
Trenberth, K. E. (2011). Changes in precipitation with
climate change. Climate Research, 47(1-2), 123-38.
Wu, X., Meng, F., Liu, P., Zhou, J., Liu, D., Xie, K., Zhu,
Q., Hu, J., Sun, H., & Xing, F. (2021). Contribution of
the Northeast Cold Vortex Index and Multiscale
Synergistic Indices to Extreme Precipitation Over
Northeast China. Earth and Space Science, 8(1),
e2020EA001435.
Yang, P. Y., Zhang, Q., Shi, P. J., Gu, X. H., & Li, Q.
(2017). Spatiotemporal Distribution of Precipitation
Extremes and Related Implications Across the Yellow
River Basin, China. Journal of Wuhan University:
Science Edition, 63(4), 368-376.
Zhang, D. D., Yan, D. H., & Wang, Y. C. (2015).
GAMLSS-based nonstationary modeling of extreme
precipitation in Beijing–Tianjin–Hebei region of China.
Natural Hazards, 77, 1037–1053.
Zhang, D. D., Lu, F., Zhou, X. N., Chen, F., Geng, S. M.,
& Guo, W. (2016). GAMLSS model-based analysis on
non-stationarity of extreme precipitation in Daduhe
River Basin.
Water Resources and Hydropower
Engineering, 47(05), 12-15+20.
Zhang, D. W., Cong, Z. T., & Ni, G. H. (2013).
Comparison of three Mann- Kendall methods based on
the China’s meteorological data. Advances in Water
Science, 24(4), 490-496.
Zhang, Q., Gu, X. H., Singh, V. P., Xiao, M. Z., & Xu, C.
Y. (2014) Stationarity of annual flood peaks during
1951-2010 in the Pearl River basin, China. Journal of
Hydrology, 519, 3263–3274.
Zou, L., Yu, J. Y., Wang, F. Y., & Zhang, Y. (2021).
Spatial-temporal variations of extreme precipitation
indices and their response to atmospheric circulation
factors in the Weihe River Basin. Arid Zone Research,
38(3), 764-774.
Analysis of Spatiotemporal Distribution and Non-stationary of Extreme Precipitation Events during 1960-2018 in the Yellow River Basin
503
