Research on Water Resources-social Economy-ecosystem Coupling
System based on Improved Ant Colony Algorithm
Yihuan He
*
and Shi An
School of Economics and Management, Harbin Institute of Technology, Harbin, 150001, P.R. China
Keyword: Water resources, Social economy, Ecosystem, Ant colony algorithm, Symbiosis, Security status
Abstract:
Based on the ant colony algorithm, using the Lotka-Volterra symbiosis model and taking Guangzhou,
Shenzhen, Zhuhai, Shantou, Dongguan, Zhongshan, Zhaoqing, Foshan and Yangjiang as the research objects,
research on the coupling relationship of water resource, social economy and ecosystem system from 2005 to
2019 was carried out. The basic index, comprehensive index and security status of water resources were
calculated. The symbiotic relationship between water resources, social economy, and ecological environment
was analyzed quantitatively. It is of great significance to the realization of full utilization of water resources
and sustainable development.
1 INTRODUCTION
The social-ecological-water resources system
includes all aspects of human activities. The purpose
of studying the coupling development of the system
is to understand the interaction mechanism between
the systems, calculate the exchange flux within the
system, and provide ideas and methods for guiding
the coordinated and efficient development of the
entire system. Compared with traditional linear and
non-linear programming algorithms, ant colony
algorithm in studying coupled systems has many
advantages. The idea of the algorithm is simple, and
it is not restricted by the differentiability,
differentiability, and continuity required by the
planning problem. Since the algorithm starts from a
set of schemes, it expands the scope of search and
optimization, and reduces the risk of a large gap
between the local optimal solution and the global
optimal solution generated by the traditional linear
optimization method. Thus, the relationship between
the various elements is coordinated, and the unity of
economic, social and environmental is realized by
applyling the ant colony algorithm to the water
environment system.
Research on water rights allocation, optimization
models, water shortage risk assessment, and optimal
allocation of water resources have been carried out
(Chen et al., 2015; He, 2014; Hou & Wu, 2015; Liu et
al., 2020; Wang et al., 2014; Xie et al., 2013; Zhao et
al., 2017). However, the ant colony algorithm also had
the following shortcomings: (1) It requires a longer
search time. (2) It is prone to stagnation, which is not
conducive to finding a better solution. Therefore, it is
necessary to improve the state transition probability
of the basic ant colony algorithm, and build a new ant
colony algorithm suitable for the coupled system of
water resources-social economy-ecosystem based on
actual problem requirements.
Based on the ant colony algorithm, the basic index,
comprehensive index, safety index and carrying
capacity of the nine major cities in Guangdong
Province was calculated by using the Lotka-Volterra
symbiosis model. Then the coupling relationship
between water resources, social economy and
ecological environment was analyzed.
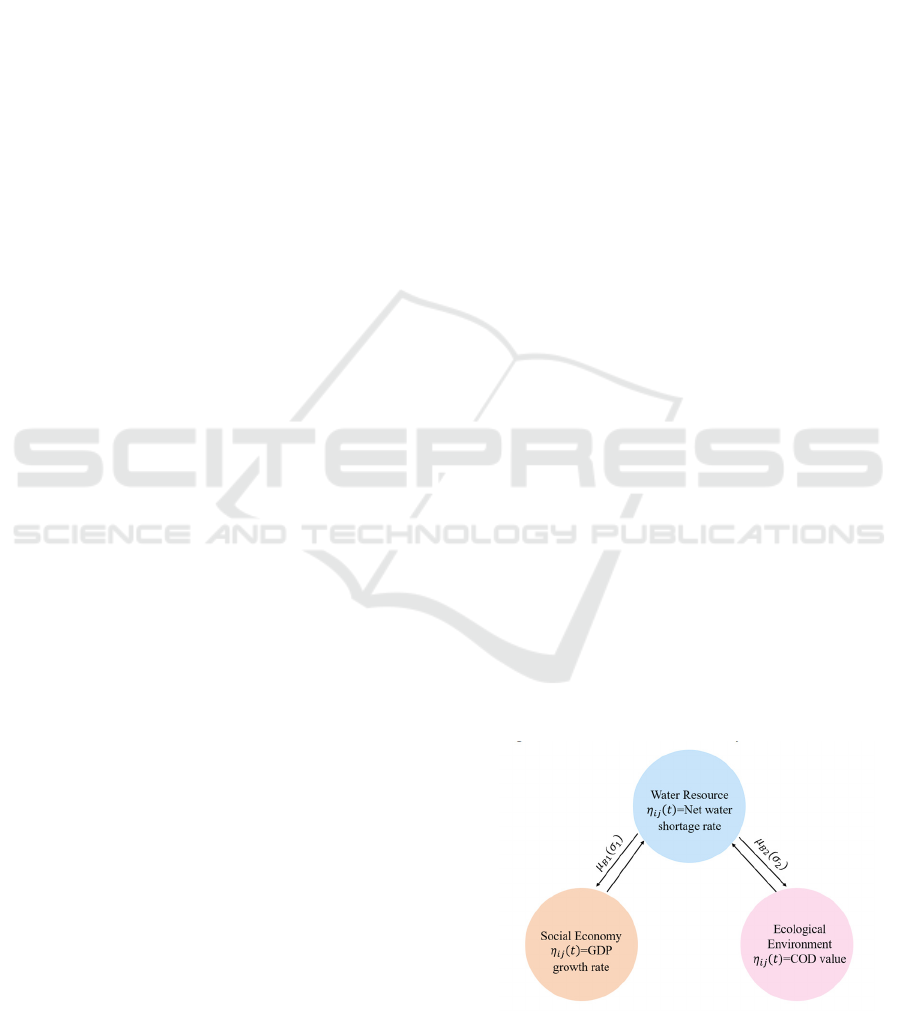
Figure 1: Improved ant colony algorithm feedback
relationship diagram.
He, Y. and An, S.
Research on Water Resources-social Economy-ecosystem Coupling System based on Improved Ant Colony Algorithm.
In Proceedings of the 7th International Conference on Water Resource and Environment (WRE 2021), pages 483-487
ISBN: 978-989-758-560-9; ISSN: 1755-1315
Copyright
c
2022 by SCITEPRESS – Science and Technology Publications, Lda. All rights reserved
483
2 IMPROVED ANT COLONY
ALGORITHM
Based on the basic ant colony algorithm, the state
transition probability of the traditional ant colony
algorithm is improved, introducing into the
coordination degree between water resource
utilization and economic development 𝜇
(𝜎
) as
well as the coordination degree between water
environment quality improvement and economic
development𝜇
(𝜎
) . By establishing the coupling
relationship between water resources and social
economy, water resources and ecological
environment, mutual feedback was used to promote
the rapid convergence of the algorithm in the early
stage. The specific feedback relationship is shown in
Figure 1. The state transition probability control
equation of the improved ant colony algorithm is as
follows:
𝑃
(
𝑡
)
=
(
)
∙
(
)
∑
(
)
∙
(
)
∈
(
)
(
)
(
)
,𝑗∈𝑎𝑙
0,𝑗∉𝑎𝑙
(1)
Among them, al
k
was the node of the next step that
k ants were allowed to choose. α and β were the
pheromone accumulated by the ant during the
movement and the different roles played by the
enlightening information in the path selection, 𝜂
(
𝑡
)
was the heuristic function.
∆𝜏
(
𝑡
)
=𝜇⋅
∑
∆𝜏
(
𝑡
)
(2)
Among them, 𝜌 ( 𝜌∈(0,1)) was the pheromone
volatilization coefficient, 1−𝜌 was the pheromone
residual factor, ∆𝜏
(
𝑡
)
was the pheromone
increment on the path (i,j) during the cycle, ∆𝜏
(
𝑡
)
was the pheromone left by the k ant on the path (i, j)
in the cycle.
According to the model and ACO data
requirements, relevant data was collected, and
parameters were set. The water supply, water demand,
total water resources, and water consumption were
obtained by consulting relevant water resources data
in Guangdong Province. The number of ants, L value,
maximum iteration number, minimum pheromone
intensity, maximum pheromone intensity, minimum
global pheromone performance coefficient, optimal
value, minimum threshold and other calculation
parameters were chosen based on the calibration
situation of Guangdong water resources model, as
shown in Table 1. The actual data in Table 1 were
2005 data values, taken from the Guangdong
Statistical Yearbook. In this study, the ants took pixels
as the configuration object, which had nothing to do
with the length of the route.
Table 1: Actual and calculated parameters.
Actual data Calculation parameters
Parameters
Value
(billion m
3
)
Parameters Value
Water suppl
y
0.846
N
umber of ants M 100
Water deman
d
0.712 L 50
Total water resources 0.698 Maximum number of iterations 500
Water
consumption
Life 0.378
Initial pheromone
concentration
80
Production 0.459 Heuristic
ɑ
0.1
Ecolo
gy
0.237 β 15
Industry 0.412
Minimum global pheromone
p
erformance coefficien
t
100
Surface wate
r
0.311
μ
30
Rainwate
r
0.279 Minimum threshol
d
0.005
3 RESULTS AND DISCUSSION
Figure 2 shows the comprehensive level value of
water resources, social economy and ecological
environment in Guangdong Province from 2005 to
2019. The basic water resources index ranged from
0.115 to 0.25 between 2005 and 2019. The fluctuation
range is small, and the trend is not significant, which
WRE 2021 - The International Conference on Water Resource and Environment
484
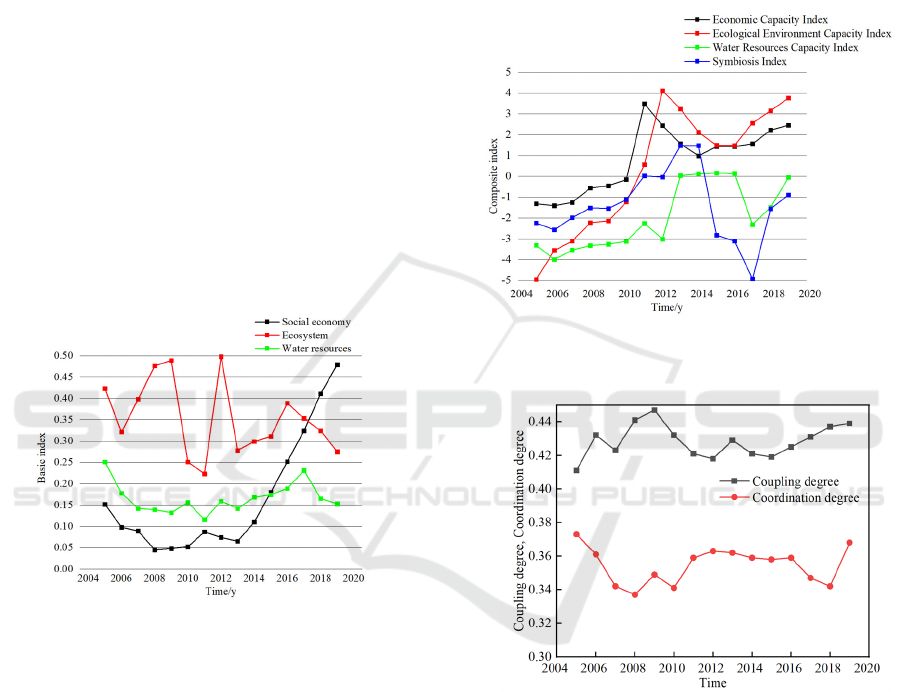
indicates that the driving force from the social and
economic external environment is weak. Therefore, to
encourage rapid economic development, a number of
stimulus policies to improve the utilization of water
resources in the social economy is necessary. The
comprehensive level of ecological environment
shows large M-shaped fluctuations, with fluctuations
ranging from 0.23-0.49, which indicating that the
protection of the ecological environment is very
important and has a great impact on water resources.
Therefore, it is necessary to take effective measures
to ensure the balanced development of the ecological
environment and water resources in Guangdong
Province. Between 2017 and 2019, the basic index of
water resources had declined to a certain extent. Small
decline shows that the state of water resources in
Guangdong Province is not good. The substantial
improvement in living standards resulted in fast
consumption of water resources. At the same time, the
decline of the water resource index limited the
development of the overall level of the ecological
environment.
Figure 2: Basic indexes in Guangdong Province.
Figure 3 shows economic capacity index,
Ecological environment capacity index, water
resource capacity index and symbiosis index of
Guangdong Province from 2005 to 2019. The effect
of water resources to the social economy from 2011
to 2019 was positive, indicating that water resources
played a positive role in promoting social and
economic development. The water resource capacity
index was only positive during 2013-2016, indicating
that the development of water resources is limited by
economic development except for 2013-2016. The
symbiosis index of water resources, economy and
ecological environment was 1.478 and 1.479 in 2013
and 2014, respectively, showing the best symbiosis
state. With the passage of time, the symbiosis index
has shown a significant decline, indicating that the
symbiosis conditions at this time need to be
continuously improved. According to the
classification of water resources safety standards, the
water resources of Guangdong Province from 2005 to
2019 have gradually changed from the initial
dangerous state to the vigilant state. The
comprehensive level of water resources has increased
to a certain extent, but the overall level is still unstable
state.
Figure 3: The comprehensive index of Guangdong
Province.
Figure 4: Coupling degree and coordination degree of water
resources, economy, and ecological environment in
Guangdong Province.
Figure 4 shows the degree of coupling and
coordination of water resources, economy and
ecological environment in Guangdong Province. The
degree of coordination among the water resources,
economy and the ecological environment has
continued to decline from 2005 to 2009. The degree
of coordination was low in 2010 and 2018 while
relatively high from 2011 to 2016. In 2010 and 2018,
the economic and ecological environment's
dependence on water resources was relatively low.
However, the economic and ecological environment's
Research on Water Resources-social Economy-ecosystem Coupling System based on Improved Ant Colony Algorithm
485
dependence on water resources was relatively high
from 2011 to 2016. Economic development and the
protection of the ecological environment have a
relatively large impact on the development of water
resources, which is consistent with the status of water
resources development in Guangdong Province. The
coupling degree was in the M-shaped change from
2009 to 2019. It reached maximum value in 2009 and
gradually decreased, and then increased slowly in
2013, and then appeared a downward trend. After
2015, it has shown an upward trend. The coupling
degree has decreased significantly from 2009 to 2012,
which was due to the economic development and the
deterioration of the ecological environment. With the
sustainable development of the economy and the
restoration of the ecological environment, the
coupling of the three has continued to increase. It also
shows that with the introduction of national
governance policies, the coupling relationship
between water resources, economy and ecological
environment in Guangdong Province has been
significantly improved.
The water resources security status of nine major
cities in Guangdong Province from 2005 to 2019 is
shown in Figure 5 and Table 2. From 2005 to 2019,
the overall water security status of the nine major
cities in Guangdong Province has improved
significantly, but it is still at a relatively low level.For
most cities with a higher level of development, their
water resources were basically in a state of vigilance,
requiring local governments to adjust water resources,
economic and ecological environment.
Figure 5: Water resources security status of nine major cities in Guangdong Province.
Table 2: Water resources security status of nine major cities in Guangdong Province.
City Guangzhou Shenzhen Zhuhai Shantou Dongguan Zhaoqing Zhongshan Foshan Yangjiang
2005 Dangerous Dangerous Dangerous Dangerous Dangerous Poor Dangerous Vigilant safe
2006 Vigilant Dangerous Dangerous Vigilant Dangerous Vigilant Poor Vigilant safe
2007 Poor Poor Vigilant Poor Vigilant Poor Vigilant Poor Vigilant
2008 Vigilant Poor Poor Poor Poor Vigilant Poor Poor Poor
2009 Dangerous Dangerous Dangerous Dangerous Dangerous Poor Dangerous Vigilant safe
2010 Dangerous Dangerous Vigilant Vigilant Dangerous Poor Dangerous Vigilant Vigilant
2011 Poor Dangerous Vigilant Vigilant Dangerous Vigilant Poor Vigilant Vigilant
2012 Dangerous Vigilant Vigilant Dangerous Dangerous Vigilant Poor Vigilant Vigilant
2013 Poor Vigilant Vigilant Poor Vigilant Poor Vigilant Vigilant Vigilant
2014 Poor Vigilant Poor Poor Vigilant Poor Vigilant Poor Poor
2015 Poor Poor Vigilant Poor Vigilant Vigilant Poor Vigilant safe
2016 Vigilant Vigilant Poor Vigilant Poor Vigilant Poor Vigilant Poor
2017 Poor Poor Vigilant Poor Poor Vigilant Vigilant Vigilant Vigilant
2018 Vigilant Poor Poor Poor Poor Vigilant Poor Poor Vigilant
2019 Vigilant Poor Vigilant Poor Sensitive safe Vigilant Vigilant safe
WRE 2021 - The International Conference on Water Resource and Environment
486

4 CONCLUSIONS
Based on the ant colony algorithm, using the Lotka-
Volterra symbiosis model and taking Guangzhou,
Shenzhen, Zhuhai, Shantou, Dongguan, Zhongshan,
Zhaoqing, Foshan and Yangjiang as the research
objects, research on the coupling relationship of water
resource, social economy and ecosystem system from
2005 to 2019 was carried out. It showed the best
symbiosis state in 2013 and 2014, whose symbiosis
index were 1.478 and 1.479, respectively. The overall
water security status of nine major cities in
Guangdong Province has improved significantly, but
it was still at a relatively low level.
REFERENCES
Chen, N. X., Liu, W., Gao, Z. P., & Qu, J. H. (2015).
Optimal deployment of water resources based on multi-
objective genetic ant-colony hybrid algorithm in
Zhongmou county. Journal of North China University
of Water Resources and Electric Power (Natural
Science Edition), 36(06), 1-5.
He, X. H. (2014). Application of quantum ant colony
algorithm in optimizing agricultural irrigation channels.
Hubei Agricultural Sciences, 53(03), 676-680.
Hou, J. W., & Wu, J. J. (2015). Improvement and simulation
of swarm intelligence algorithm for spatial optimal
allocation of water resources. Journal of Geo-
Information Science, 17(04), 431-437.
Liu, H. H., Li, W. H., & Zhao, X. (2020). Joint Operation
simulation of multi water sources of Hanjiang River to
Weihe River water transfer project and Heihe River
diversion project in Xi'an city. Bulletin of Soil and Water
Conservation, 40(01), 136-141.
Wang, G. Y., Xie, J. C., & Zhang, J. L. (2014). Optimal
calculation of water supply network based on improved
ant colony algorithm. Journal of Northwest A&F
University, 42(01), 228-234.
Xie, J. C., Liao, W. H., Jing, X. L., Sun, B., & Zhu, J. W.
(2013). Artificial fish swarm algorithm based water
resources optimal allocation in Chanba river basin.
Journal of Northwest A&F University (Natural Science
Edition), 41(06), 221-226.
Zhao, Z. Y., Li, W. C., Wang, X., Cui, T. T., Cheng, Z. H.,
Liu, X. Z., & Wang, S. (2017). Analysis of water
resources ecological footprint in Henan Province based
on exponential decomposition method. Hydrology,
37(04), 57-61.
Research on Water Resources-social Economy-ecosystem Coupling System based on Improved Ant Colony Algorithm
487
