
Simulation Study on the Effect of Rainfall-runoff Control in Sponge
Transformation Quarter in Northwest China
Liu Yang
1,2,*
, Bing Wang
1,2
, Bo Ma
3
, Shuhong Xue
3
, Xiao Yang
3
and Shili Wei
3
1
State Key Laboratory of Eco-hydraulics in Northwest Arid Region of China, Xi'an University of Technology, Xi'an, China
2
Research Center of Eco-hydraulics and Sustainable Development, The New Style Think Tank of Shaanxi Universities,
Xi'an, China
3
Power China Northwest Engineering Corporation Limited, Xi'an, China
Keywords: Sponge transformation quarter, Rainfall-runoff, Control effect, Northwest China
Abstract: To cope with urban flooding, water pollution, and water shortage, China has proposed and continuously
promoted sponge city construction. The quarter-scale site is the main carrier for the centralized deployment
of small scattered sponge facilities, which is an important part of the urban stormwater system and an essential
link to realize the source reduction of rainfall-runoff. The diversification of sponge facility types and
structures and its combined applications have greatly changed the ecological background and hydrological
characteristics of a quarter, and the nonlinear relationship of rainfall-runoff has become more complex. It is
of great practical and guiding significance to study the role and effect of small community sponge
transformation on the control of rainfall-runoff. Therefore, this study takes a sponge transformation quarter
in northwest China as an example, based on the storm water management model, constructs a quarter rainfall
model before and after spongy transformation, and carries out the process and effect analysis of rainfall-runoff
control. The main research results show that: 1) During the monitoring period, after sponge transformation in
the study area, the runoff control rate in response to 1.0 mm-45.5 mm rainfall event reached 83.49%-99.07%,
with a better reduction effect on the peak flow and its occurrence time. 2) For the heavy rain event on August
3, 2019, the peak reduction rate was 69.7%, and the runoff control rate increased from 50.09% to 85.25%
before the sponge transformation, and for the heavy rain event on June 27, 2019, the peak reduction rate was
58.79%, and the runoff control rate improved from 48.89% to 83.49% before the sponge transformation. 3)
After the sponge transformation of the study area, the storage facilities played a better role in the storage, and
the water depth of the standing water node was lower than before. For the storm event on June 27, 2019, the
water depth in the rainwater discharge wells on the east side of the study area decreased by 0.05 m compared
with that before the transformation, and the rainwater runoff control effect was apparent.
1 INTRODUCTION
China's urbanization rate exceeded 60% in 2019
(National Bureau of Statistics, 2020). The Urban Blue
Book: China Urban Development Report No. 12
predicts that this rate in China will reach 70% by 2030
and about 80% by 2050, and urbanization still has
more room and potential for development (Jiang et al.,
2018). While enjoying the dividends of urbanization,
the urban water ecosystem has revealed three core
challenges that are becoming increasingly serious:
water pollution, water shortage, and urban flooding.
Due to both climate change and urbanization
development, urban flooding disasters are frequent
within many cities in China. An average of more than
100 cities in China have been threatened by urban
flooding every year Since 2010 (Wang et al., 2018).
Under the talk of urban sea watching, there is more
helplessness and better expectations for urban
construction and urban water systems. On December
12, 2013, the Chinese President emphasized in his
speech at the Central Urbanization Work Conference
that "in upgrading urban drainage systems, priority
should be given to keeping rainwater in, to making
more use of natural forces for drainage, and to
building cities with natural storage, natural
infiltration, and natural purification." The sponge city
has entered the public view, providing a new direction
and idea for China's urban development and
comprehensive response to urban water problems.
China attaches great importance and supports it with
Yang, L., Wang, B., Ma, B., Xue, S., Yang, X. and Wei, S.
Simulation Study on the Effect of Rainfall-runoff Control in Sponge Transformation Quarter in Northwest China.
In Proceedings of the 7th International Conference on Water Resource and Environment (WRE 2021), pages 467-474
ISBN: 978-989-758-560-9; ISSN: 1755-1315
Copyright
c
2022 by SCITEPRESS – Science and Technology Publications, Lda. All rights reserved
467

issued a series of policy documents and measures and
has given great support in terms of funds. In 2015 and
2016, China's Ministry of Finance, Housing and
Urban-Rural Development, and Water Resource
jointly launched 30 pilot sponge cities. In March
2017, the construction of sponge cities was included
for the first time in the "Government Work Report"
of China's two sessions, calling for the coordination
of urban construction above and below ground and
the promotion of sponge city so that cities have both
a "face" and a "face". In March 2018, the United
Nations launched the "International Decade of Action
for Water" plan, which aims to better cope with water
shortage pressure and climate change through
measures such as changes in water resources
management. China's "sponge city" project has
become one of the focus of the United Nations and
has high hopes for it.
The construction of sponge cities has increased
the variety of underlying surfaces to some extent,
making the urban hydrological characteristics change
once again and the rainfall-runoff nonlinear
relationship more complex (Xiang et al., 2017). The
effect of sponge cities on the control of rainfall-runoff
has also gradually become a research hotspot. Dreelin
et al. discovered that the permeable pavement had
better runoff control at lower precipitation levels,
with runoff reduction rates of up to 93% (Dreelin et
al., 2006). By analyzing the effects of permeable
paving and low elevation greenbelt in a region of
Beijing, Jin Cuntian et al. found that low elevation
greenbelt is more effective in controlling runoff and
permeable paving is more effective when the intensity
of precipitation is low (Jin et al., 2010). Wan
chenghui et al. conducted a study on the effects of
low-impact development using the storm water
management model in Ping xiang City as an example.
Results showed that this effect of combined low-
impact development facilities on surface runoff
hydrology and water quality control could effectively
improve the regional pollution abatement and flood
resistance when comparing the status quo (Wan et al.,
2019). Xu Duo studied the runoff control effect of
sponge campus LID facilities (Xu, 2019). The study
showed that the total annual runoff control category
reached 75% after the campus was transformed by
sponging, and the contribution ranking of the three
LID facilities to runoff abatement is permeable
pavement > sunken tree pond > low elevation
greenbelt. The research results have been mainly
focused on the single LID and sponge facilities
themselves in terms of structure, effect, impact
research, etc., lack of research on the comprehensive
role of a variety of facilities, and the monitoring and
evaluation of the actual operation effects of the
sponge transformation of old quarters.
Therefore, this paper takes a spongy
transformation quarter in northwest China as the
research object, obtains multiple rainfalls and flow
data of the experimental site in the research area
through monitoring, and simulates and analyzes the
flow process of the discharge outlet and the
distribution of water accumulation points before and
after the spongy transformation of the quarter with the
help of storm water management model, identifies the
influencing factors, analyzes and evaluates the role
and effect of the spongy transformation on the control
of rainwater runoff, with a view to providing practical
guidance for the spongy transformation of the future
building quarters.
2 OVERVIEW OF THE STUDY
AREA AND DATA SOURCES
2.1 Study Area Overview
The area of the study area is about 28855 m
2
, the
current building occupies about 8106 m
2
, the green
area occupies about 7940 m
2
, the green area ratio is
27.52%, the rest are hardened pavement and square,
the permeable area before renovation accounts for
about 38%. The study area divides into two regions:
office and living. The office area concentrates on the
north side of the site, where the hardened pavement is
mostly. The office area is less green but has a higher
integrated surface runoff coefficient, which makes it
easy to form local road ponding when the rainwater is
discharged only by surface runoff organization under
rainfall weather. Most of the living areas are
residential buildings built at the beginning of this
century, with the limited green area, aging road
surface, limited scope of rainwater pipe network
laying, and rainwater flowing on the road surface on
rainy days. The terrain of the study area divides into
10s catchment areas with high south and low north
and high west and low east trends roughly. There
have no foreign water enters, the incoming water is
mainly rainfall, and there are two rainwater outfalls
connected to municipal pipes. The main types and
scales of low-impact development facilities after the
sponge transformation are as follows: 5429.63 m
2
of
low elevation greenbelt, 1199.60 m
2
of the rain
garden, 10350.95 m
2
of overall permeable pavement,
540.05 m
2
of permeable tile pavement, 399.28 m
2
of
grass planting ditch, etc. The storage volume of 1#
regulating pond is 60 m
3
, the storage volume of 2#
WRE 2021 - The International Conference on Water Resource and Environment
468
regulating pond is 100 m
3
, and the storage depth is
about 4.3 m, accounting for 1.2% of the total area of
the study area. The study area's percentage of the
previous area after sponge transformation is about
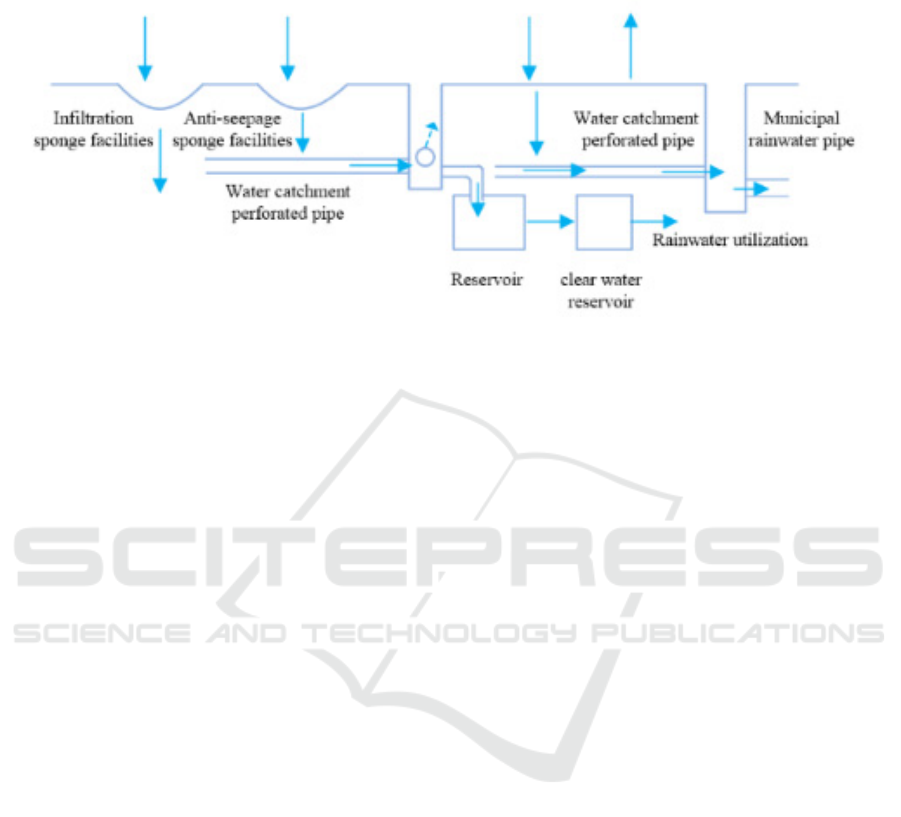
73%. The process of rainwater runoff control is
shown in Figure 1.
Figure 1: Diagram of the process of rainwater runoff control in the sponge transformation community.
2.2 Data Sources
The fundamental data required for this modeling
collection mainly includes data on the subgrade
conditions before and after the transformation of the
study area, topographic maps, the number, length,
diameter, and elevation of stormwater pipes, and the
number and height of rainwater wells. In addition, the
monitoring and collection of rainfall process data
from July 25, 2018, to August 30, 2019, during the
operation period after sponging in the study area, as
well as the flow process data from the 1# transfer
pond (60 m
3
) inlet, can provide efficient data support
for model construction, validation, and rate
determination and conducting simulation analysis.
3 MODEL BUILDING
SWMM (Storm water Management Model) is an
urban storm water management model proposed by
the U.S. Environmental Protection Agency to cope
with the increasingly severe urban water problems.
After continuous improvement and upgrading of the
model functions and interface, it has been added the
setting of low impact development module after
version 5.0, which can achieve field and long series
continuous simulation of water quantity and quality,
and is widely used in the areas of drainage network
planning and design, evaluation of the effect of low
impact development facilities and flood risk analysis,
providing better environment and conditions for the
simulation of rainfall and flood runoff process after
sponge city construction. Therefore, this paper selects
the storm water management model to construct the
urban rainfall model of the study area and carries out
the simulation and analysis of the rainfall-runoff
process and inundation distribution before and after
the sponge transformation of the study area.
3.1 Calculation Principle
The storm water management model is mainly used
to deal with the hydrological processes generated by
regional runoff. 1) The infiltration process, which
exists in permeable areas, is calculated in this study
using Horton Equation for infiltration. 2) The surface
runoff includes flow production of the previous
ground, Low-lying impervious surface, and
Impervious floor without depression. In general,
except for evaporation, rainfall on impervious
surfaces is converted into a runoff, the amount of
water produced by the Low-lying impervious surface
is the amount of rainfall minus the initial loss of
puddle filling, permeable surface flow rate is rainfall
minus evaporation, ponding, and infiltration. 3)
Surface confluence, treating each sub-catchment as a
reservoir, is calculated using a nonlinear reservoir
model coupled with the Manning equation and the
continuity equation. 4) The pipe network converges,
and the dynamic wave method is used to establish a
complete set of St. Venant's equations to describe the
flow variation process in the pipe channel with
continuous momentum conservation equations and
mass conservation at the nodes of the pipe channel.
3.2 Model Generalization
The probabilistic models of the study area have been
constructed separately before and after the sponge
Simulation Study on the Effect of Rainfall-runoff Control in Sponge Transformation Quarter in Northwest China
469
transformation. Due to limited space, the probabilistic
model construction process of the study area after
sponging renovation is illustrated here as an example.
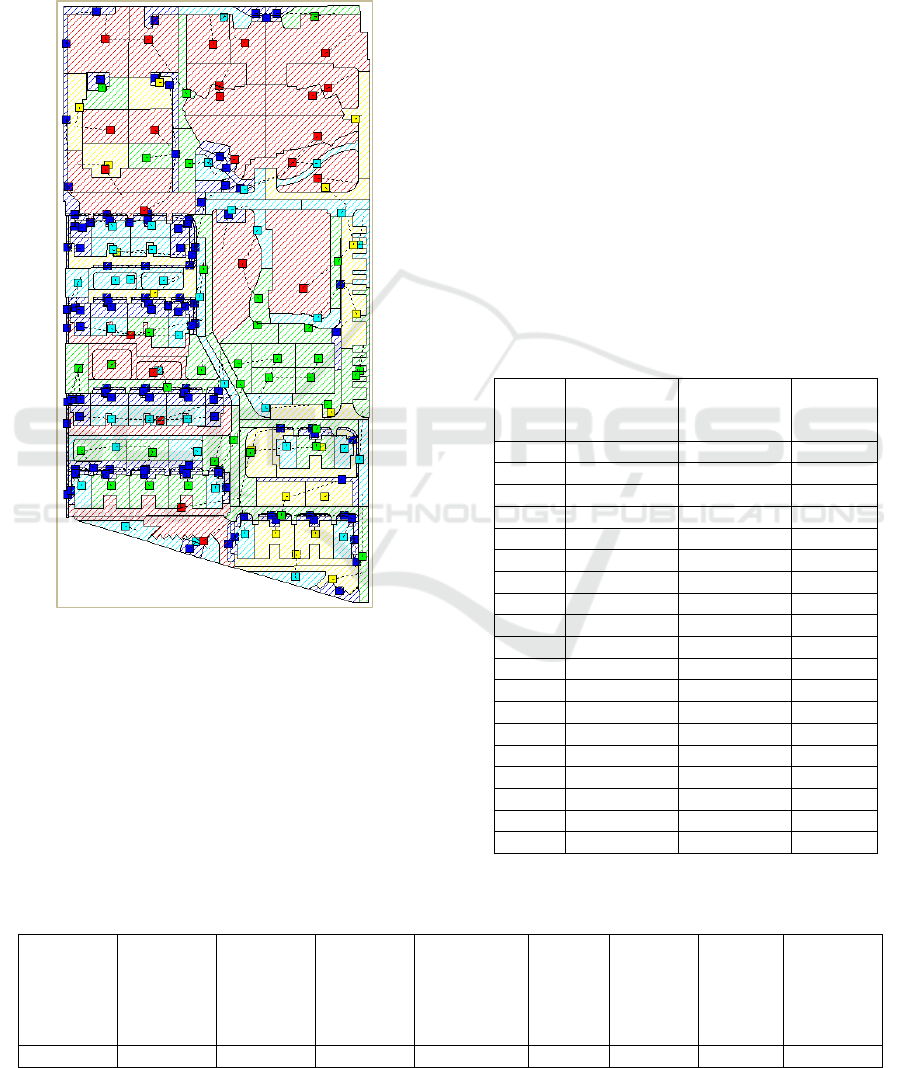
Based on various influencing factors such as
topography, elevation, pipes, rainwater wells, land
use properties, and field observation and research
during rainfall, the study area was divided into 232
sub-catchment divisions, as shown in Figure 2.
Figure 2: Generalized map of sub-catchments in the study
area.
The rainwater pipe network system in the
rainwater wells, storage facilities, outfalls is
generalized as nodes. The pipe network, weirs,
orifices are generalized as pipe sections. In this way,
the rainwater pipe network system can summarize
into a system composed of nodes and pipe sections.
According to the study area, sponge transformation
project of pipe plan layout and vertical elevation
drawing data, rainwater pipe network system can be
generalized as 100 pipe sections, 2s outfalls, 105
rainwater wells, and 2s storage facilities.
3.3 Parameter Calibration
Considering the rainfall ephemeris, intensity, and
flow process continuity, the rainfall data of the study
area on August 9, 2019, and the flow process data of
the inlet of the storage pond were selected to rate the
model. The measured flow process at the inlet of the
storage pond and the model simulated flow process
data are shown in Table 1. The rainfall lasted 145
mins, the outflow occurred at the 40th min after the
rainfall started, and the flow process lasted until the
220th min. The simulation results are consistent with
the measured flow process, and the peak occurrence
time-matched and the relative error between the
simulated and measured values are between -5.27%
and 7.50%, which is within the allowable error range.
After simulation analysis and rate determination, the
main parameter settings in the model are shown in
Table 2.
Table 1: Model calibration results.
Time
(mins)
Observed
values
(
×10
-3
m
3
/s
)
Simulated
values
(
×10
-3
m
3
/s
)
Relative
error
40 0.31 0.33 5.60%
50 0.96 1.01 5.73%
60 1.51 1.50 -0.50%
70 2.54 2.47 -2.80%
80 2.98 3.02 1.39%
90 2.94 2.90 -1.42%
100 2.40 2.43 1.13%
110 4.71 4.68 -0.69%
120 3.93 3.83 -2.55%
130 2.78 2.63 -5.27%
140 2.58 2.60 0.95%
150 1.71 1.80 5.09%
160 1.02 0.99 -3.54%
170 0.65 0.60 -7.50%
180 0.58 0.58 -0.35%
190 0.37 0.37 -1.30%
200 0.27 0.25 -6.22%
210 0.19 0.19 0.88%
220 0.04 0.05 4.81%
Table 2: The calibration setting of main parameters.
parameter
Manning
coefficient
in
impermeabl
e zone
Manning
coefficient
of
permeable
zone
Manning
coefficient
of
rainwater
pipeline
Sinkage
storage in
impervious
area
/mm
Sinkage
storage
in
permeabl
e area
/mm
Maximal
infiltratio
n
rate/mm˙h
-1
Minimu
m
infiltratio
n rate
/mm˙h
-1
attenuation
constant/h
-1
the value 0.012 0.1 0.013 5.75 1.25 103.81 11.44 6.2
WRE 2021 - The International Conference on Water Resource and Environment
470
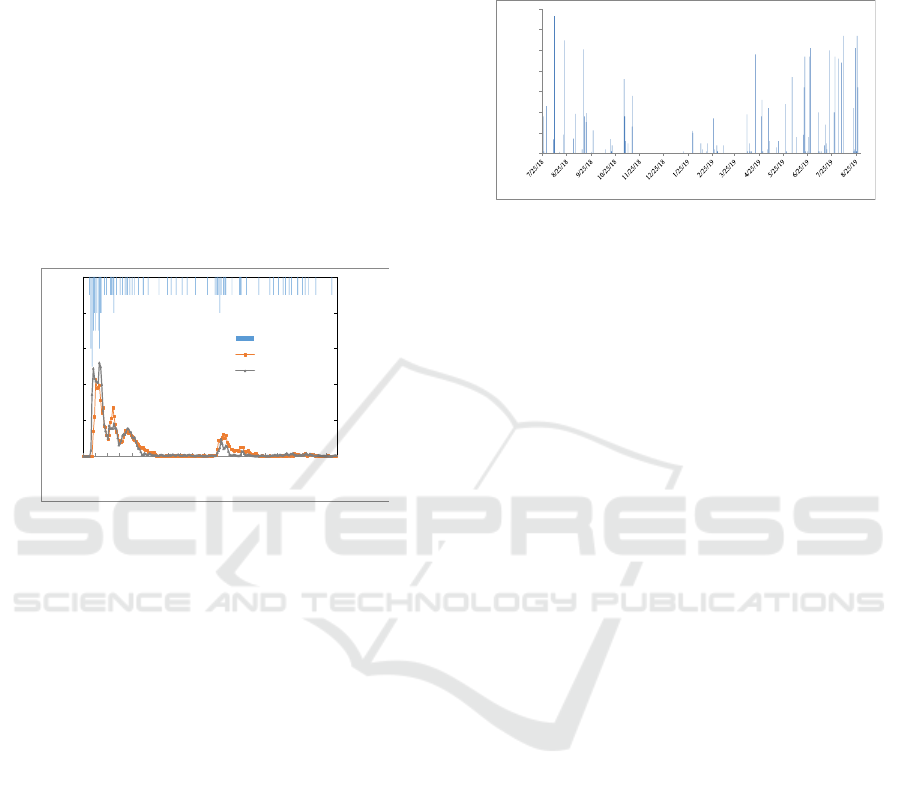
3.4 Model Validation
The model was validated using the rainfall and flow
data on August 26, 2019, as shown in Figure 3. It can
be seen that the simulated flow process is consistent
with the measured flow process, and the relative
errors between the simulated and measured values
range from -7.23% to 9.30%, and the peak occurrence
times match, indicating that the storm water
management model of the built study area can
simulate the actual process of rainfall-runoff in the
study area more realistically, and can be used for the
simulation of the flow process of the discharge outlet
and the effect of rainfall-runoff control before and
after the sponge transformation of the study area
Analysis.
Figure 3: Flow process diagram for model validation fitting.
4 RESULTS AND ANALYSIS
4.1 Analysis of Rainfall Characteristics
During the Monitoring Period
When the sponging of the study area is completed, the
rainfall data from July 25, 2018, to August 30, 2019,
were monitored and collected. And a total of 61
rainfall events were monitored. The data collected in
the study area were compared and verified by using
the real-time public rainfall events, duration, and
rainfall data information on the website of Xi’an
Meteorological Bureau. The rainfall data collected by
the rainfall station in the study area and the public
data have a slight fluctuation. However, the
characteristics of rainfall events and duration are the
same, indicating that the rainfall station monitoring
data in the study area have certain reliability. The
daily rainfall distribution during the monitoring
period is shown in Figure 4.
Combined with the process data of the inlet flow
of the1# storage tank, it is found that 34 light rain
events have not occurred during the monitoring
period. There are eight rain events and two outflow
events. There are 18 heavy rain events, including 15
outflows. There are two heavy rainfall events, of
which the 12-hour rainfall on 27 June 2019 is 36.5
mm and the 12-hour rainfall on 26 August 2019 is 37
mm.
Figure 4: Daily rainfall distribution during monitoring
period.
4.2 Analysis of Rainwater Runoff
Effect Control
The rainfall events with 12 - hour rainfall exceeding
5 mm during the monitoring period are simulated, and
the control effect of sponge transformation on
rainwater runoff in the study area is analyzed and
calculated. The results show that there is no outflow
at the outlet of rainwater in 33 light rain events and
eight moderate rain events, and the runoff control rate
was 100%. In 18 heavy rain events and two rainstorm
events, there are 12 outflows of rainwater outlets in
the residential area, and the runoff control rate is
83.49%-99.07%. The characteristics of rainfall events
and the outflow of rainwater discharge outlets in the
sponge transformation area are detailed in Table 3. It
is found that rainfall intensity, early drought days, and
rainfall are the main factors affecting the control
effect of rainwater runoff in the sponge
transformation area, among which rainfall intensity
has a greater impact. With the increase of rainfall
intensity, the rainwater pipe flows out earlier. Rainfall
events with small rainfall intensity and uniform
distribution have less outlet flow and a gentle flow
process. The rainfall intensity and occurrence time
also have a great influence on the occurrence of peak
flow. The greater the drought days in the early stage,
the better the reduction effect of rainwater runoff.
4.3 Process Analysis of Rainwater
Discharge
Limited by space, the measured rainfall data of the
heavy rain event on August 3, 2019, and the rainstorm
event on June 27, 2019, are selected as input files to
simulate and analyze the rainwater discharge process
of the residential area before and after the sponge
transformation in the study area, as shown in Figure
5. It can be seen that the changing trend of the
0.000
0.002
0.004
0.006
0.008
0.0100.0
1.0
2.0
3.0
4.0
5.0
0
50
100
150
200
250
300
350
400
450
500
550
600
650
700
750
800
850
900
950
1000
Flow/m
3
/s
Time /min
Rainfall/mm
Rainfall
Measured flow
Simulated flow
0.0
5.0
10.0
15.0
20.0
25.0
30.0
35.0
Rainfall /mm
Time
Simulation Study on the Effect of Rainfall-runoff Control in Sponge Transformation Quarter in Northwest China
471
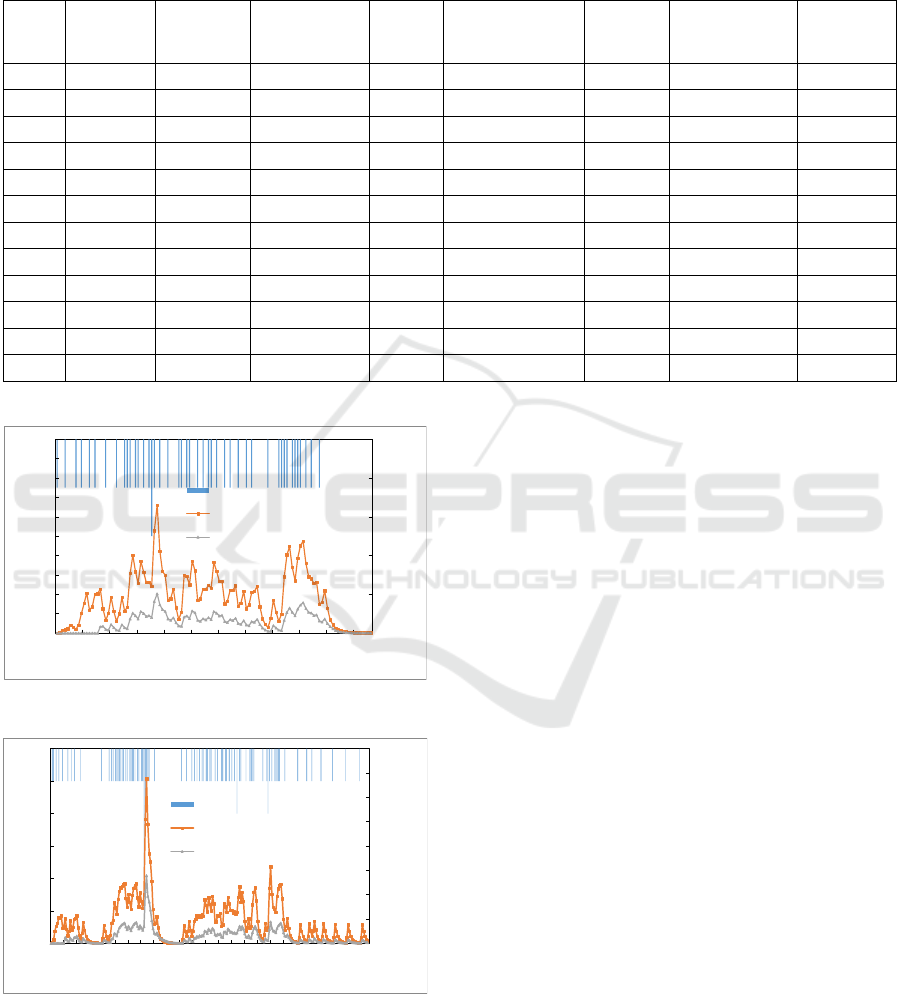
rainwater discharge process before and after the
sponge transformation in the study area is basically
the same, and the occurrence of peak flow is closely
related to the occurrence time of maximum rainfall
intensity.
Table 3: Characteristics of rainfall events and runoff control rate.
Order
number
Time
Rainfall
duration/
min
Previous
drought day / d
Rainfall/
mm
Maximum rainfall
intensity
/ mm/5min
Rainfall
scale
The start time of
outflow
/ min
Runoff
control
rate
1 2018/07/30 15 2 11.5 7.0 heavy rain 10 99.07%
2 2019/06/05 550 7 18.5 1.0 heavy rain 260 96.53%
3 2019/06/20 280 0 15.5 1.0 heavy rain 115 94.77%
4 2019/06/21 465 0 14.5 1.0 heavy rain 180 97.32%
5 2019/07/22 270 3 24.5 1.5 heavy rain 60 89.98%
6 2019/07/29 255 0 22.0 4.0 heavy rain 42 85.07%
7 2019/08/03 485 4 23.0 1.0 heavy rain 85 85.25%
8 2019/08/06 440 2 21.5 1.0 heavy rain 73 84.12%
9 2019/08/09 145 2 27.5 3.5 heavy rain 40 91.06%
10 2019/08/24 65 2 25.5 5.5 heavy rain 34 93.57%
11 2019/6/27 1200 5 45.5 2.0 rainstorm 55 83.49%
12 2019/8/26 1020 1 43.5 2.5 rainstorm 42 84.91%
(a) August 3, 2019
(b) June 27, 2019
Figure 5: Rainwater discharge process before and after
sponge transformation in the study area.
During the rainfall process on August 3, 2019,
before the sponge transformation of the study area,
the rainwater outlet of the study area outflowed in the
fifth minute after the rainfall began. After the sponge
transformation, the outflow time of rainwater
drainage in the residential area is delayed by about 80
minutes. The maximum peak flow is 0.033 m
3
/s
before the sponge transformation, and the maximum
peak flow is reduced to 0.01 m
3
/s after the sponge
transformation, and the peak reduction rate is 69.7%.
The runoff control rate also increased from 50.09%
before sponge transformation to 85.25%.
During the rainfall process on June 27, 2019,
before the sponge transformation of the study area,
the rainwater discharge outlet of the residential area
occurred 5 minutes after the rainfall began. After the
sponge transformation, the outflow time of rainwater
drainage in the residential area was delayed by about
50 minutes. The maximum peak flow was 0.068 m
3
/s
before and 0.028 m
3
/s after the sponge
transformation, and the peak reduction rate was
58.79%. The runoff control rate also increased from
48.89% before sponge transformation to 83.49%.
4.4 Distribution and Analysis of Water
Accumulation Points
The simulated analysis was carried out using the
measured rainfall process data on August 3, 2019,
with a rainfall of 23 mm. The water depth distribution
of nodes before and after the sponge transformation
in the study area is shown in Figure 6.
0
0.01
0.02
0.03
0.04
0.050.0
0.2
0.4
0.6
0.8
1.0
1.2
1.4
1.6
1.8
2.0
5
30
55
80
105
130
155
180
205
230
255
280
305
330
355
380
405
430
455
480
505
530
555
580
Flow/m
3
/s
Time /min
Rainfall/mm
Rainfall
Outlet flow before sponge
transformation
Outlet flow after sponge
transformation
0
0.01
0.02
0.03
0.04
0.05
0.06
0.07
0.080.0
0.5
1.0
1.5
2.0
2.5
3.0
5
60
115
170
225
280
335
390
445
500
555
610
665
720
775
830
885
940
995
1050
1105
1160
1215
Flow/m
3
/s
Time /min
Rainfall/mm
Rainfall
Outlet flow before sponge
transformation
Outlet flow after sponge
transformation
WRE 2021 - The International Conference on Water Resource and Environment
472
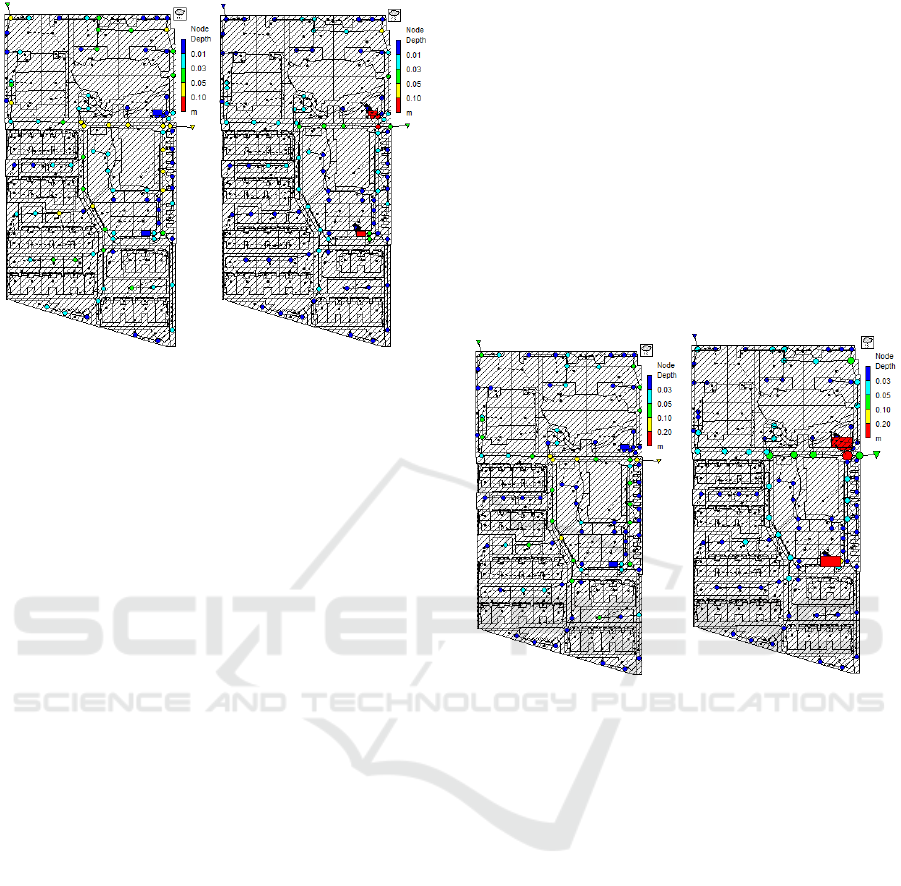
(a) Before sponge reconstruction
(b) After sponge transformation
Figure 6: Distribution of simulated node water depth during
rainfall process on August 3, 2019 ( the maximum water
occurred at 3:10 ).
The results show that after the sponge
transformation in the study area, the node with
ponding has the maximum water depth at 3:10. At
the same time, there are 14 nodes with a water depth
of 0.05 m -0.1m and 35 nodes with a water depth of
0.01 m -0.03 m before the sponge transformation.
There is only one node with a water depth of 0.05-0.1
m and 32 nodes with a water depth of 0.01 m -0.03 m
after sponge transformation. The water depth in the
well of the municipal pipe network in the north of the
study area is 0.04 m, and that in the east is 0.08 m.
After the sponge transformation, the two storage
tanks in the study area played a good role in
regulating and storing. The storage tank on the north
side was fuller than that on the south side. Compared
with before the sponge transformation, the node water
depth decreased. There was no water in the drainage
well on the north side, and the water depth in the
drainage well on the east side was 0.05m, which
decreased by 0.03m.
The simulated analysis was carried out using the
measured rainfall process data on June 27, 2019, with
a rainfall of 45.5 mm. The water depth distribution of
nodes before and after sponge transformation in the
study area is detailed in Figure 7. The results show
that after the sponge transformation in the study area,
the node with ponding has the maximum water depth
at 6:15. Before the sponge transformation at the same
time, there were five nodes with a water depth of 0.1-
0.2 m, 19 nodes with a water depth of 0.05 m-0.1 m,
and 19 nodes with a water depth of 0.03-0.05m. After
sponge transformation, there is only one node with a
water depth of 0.1 m -0.2 m, five nodes with a water
depth of 0.05 m -0.1 m, and 24 nodes with a water
depth of 0.03 m -0.05 m. The water depth in the well
of the municipal pipe network in the north of the study
area is 0.06 m, and that in the east is 0.12 m. After the
sponge transformation, the two reservoirs in the study
area have played a good role in regulating and storing.
The northern reservoir is fuller than the southern
reservoir. Compared with before the sponge
transformation, the water depth of the node is
decreased. The water depth in the northern drainage
well is 0.02 m, which is decreased by 0.04 m. The
water depth in the eastern drainage well is 0.07 m,
which is decreased by 0.05 m. It has a good effect on
the reduction of water-logging points in the study
area.
(a) Before sponge reconstruction
(b) After sponge transformation
Figure 7: Water depth distribution of simulated nodes
during rainfall on 27 June 2019 ( the maximum water
occurred at 6:15 ).
5 CONCLUSIONS
This paper takes a spongy transformation plot in
northwest China as the research object, and obtains
multiple rainfalls and flow data from the experimental
site in the study area through monitoring. And with
the help of storm water management model, we
simulate and analyze the process of discharge flow
and the distribution of water accumulation points
before and after the spongy transformation of the
district, identify the influencing factors, and analyze
and evaluate the role and effect of spongy
transformation on the control of rainwater runoff. The
main research findings are as follows:
(1) During the monitoring period, the runoff
control rate of rainfall events with rainfall of 1.0 mm
–45.5 mm reached 83.49%–100% after the sponge
Simulation Study on the Effect of Rainfall-runoff Control in Sponge Transformation Quarter in Northwest China
473

transformation in the study area. Among them, the
runoff control rate of small and medium rainfall
events reached 100%. The peak flow and the
occurrence time of peak flow were well-reduced.
(2) After the sponge transformation of the study
area, the low-impact development facilities played a
better role in source reduction, and the storage tank
played an important role in terminal storage. In
response to the heavy rain event on August 3, 2019,
the peak reduction rate was 69.7%. And the runoff
control rate increased from 50.09% before the sponge
transformation to 85.25%. In response to the heavy
rain event on June 27, 2019, the peak reduction rate
was 58.79%, and the runoff control rate increased
from 48.89% before the sponge transformation to
83.49%. The effect of rainwater -runoff- control after
the sponge transformation was significantly
improved.
(3) After the sponge transformation in the study
area, the regulation and storage facilities have played
a better role in regulation and storage. In the heavy
rain event on August 3, 2019, the time of outflow
from the outlet was delayed by about 80 minutes, and
on June 27, 2019, the time of outflow from the outlet
was delayed by about 50 minutes. The water depth of
the water accumulation node is decreased compared
with that before the sponge transformation.
Compared with the previous sponge renovation, the
water depth in the two rainwater drainage wells in the
study area decreased to 0.03 m-0.05 m. It effectively
alleviates the problems of rainwater accumulation
and heavy rain in front of the transformation road, and
the sponge effect is prominent.
(4) The analysis found that rainfall intensity, early
drought days, and rainfall are the main factors
affecting the control effect of rainwater runoff in the
sponge transformation area. Among them, the
intensity of rainfall has a stronger impact. With the
increase of rainfall intensity, the rainwater pipe flows
out earlier. Rainfall events with small rainfall
intensity and uniform distribution have less outlet
flow and a gentle flow process. The rainfall intensity
and occurrence time also have a great influence on the
occurrence of peak flow. The greater the drought days
in the early stage, the better the reduction effect of
rainwater runoff.
ACKNOWLEDGEMENTS
This research was funded by Scientific Research
Project Founded by Shaanxi Provincial Education
Depart
ment (Program No.20JT052), Start up Fund
Project for Teachers' Doctoral Research (
Program
No.
107-451120003).
REFERENCES
Dreelin, E. A., Fowler, L., & Carroll, C. R. (2006). A test
of porous pavement effectiveness on clay soils during
natural storm events. Water Research, 40(04), 799-805.
Jin, C. T., Zhao, S. Q., Yan, X. L., & Zhou, Y. W. (2010).
Impacts of Permeable brick and sunken lawn on urban
stormwater. China Water & Wastewater, 26(01), 40-42.
Jiang, Y., Zevenbergen, C., & Ma, Y. C. (2018). Urban
pluvial flooding and stormwater management: A
contemporary review of China's challenges and
"sponge cities" strategy. Environmental Science &
Policy, 80, 132-143.
National Bureau of Statistics. (2020).
https://data.stats.gov.cn/easyquery.htm?cn=C014
Wan, C. H., Yang, J. W., Pei, Q. B., Qiu, Y. L., & Lu, L. L.
(2019). Rainstorm simulation and LID effect evaluation
based on SWMM: exemplified by a demonstrative area
in Pingxiang City. Journal of Nanchang Institute of
Technology, 38(06), 75-80.
Wang, Y. T., Chen, A. S., Fu, G. T., & Djordjević, S. (2018).
An integrated framework for high-resolution urban
flood modelling considering multiple information
sources and urban features. Environmental Modelling
& Software, 107, 85-95.
Xiang, C. Y., Liu, J. H., Shao, W. W., Mei, C., Xiao, L., &
Wang, H. (2017). Effectiveness of systematically
installed sponge facilities under different rain patterns.
Water Resources and Hydropower Engineering,
48(06), 7-12.
Xu, D. (2019). SWMM-based evaluation on runoff control
in sponge campus—a case of Beixing Primary School
in Pingxiang City. Water Resources and Hydropower
Engineering, 50(07), 32-39.
WRE 2021 - The International Conference on Water Resource and Environment
474
