
Hydraulic Characteristics and Sediment Yielding on Engineering
Excavated Soil Slope under Simulated Rainfall
Xi Li, Chongqing Wang, Shixiong Jiang, Sunxian Weng, Yanhong Che,
and Yao Chen
*
Electric Power Research Institute of State Grid Fujian Electric Power Co., Ltd., Fuzhou 350007, P. R. China
Keywords:
Engineering excavated slope, Simulated rainfall, Hydrodynamics, Inter rill erosion, Model
Abstract: Engineering excavated soil slopes play an important role in artificial soil loss. In order to assess the impact of
these engineering excavated soil slopes, hydraulic characteristics and sediment generation must be quantified.
Field rainfall simulation experiments were conducted under five rainfall intensities (0.6, 1.1, 1.61, 2.12 and
2.54 mm/min) and three slope gradients (10°, 15°and 20°) on engineering excavated soil slopes. The
precipitation of each rainfall was set to 50 mm, the duration of rainfall was 83, 45, 31, 24 and 20 min for
simulated rainfall intensities of 0.6, 1.1, 1.61, 2.12 and 2.54 mm/min respectively. Plots used in this study
were laid out to be 3 m in length and 1 m in width. Calibration of rainfall intensities was conducted before
each experiment. Totally, 45 simulated rainfall events were performed. Three indices were used to research
the soil erosion processes, including surface and subsurface runoff volume and the sediment yield. Results
showed that: 1) both surface and subsurface runoff varied depending on slope gradient and rainfall intensity.
Surface runoff and subsurface runoff were 33.6~42.7 mm and 0.15~ 1.24 mm, respectively. The process of
surface runoff yield was the main hydrological process, accounting for 67.2~85.4% of the precipitation. Under
conditions of low (0.6 mm/min) and high (2.12 and 2.54 mm/min) rainfall intensity, surface runoff increased
with slope. 2)The averaged flow velocity, Reynold number, Froude number, Darcy-Weisbach friction
coefficient, Manning roughness coefficients and stream power were 0.047~0.104 m/s, 48.985~392.918,
0.355~0.581, 1.317~5.171, 0.044~0.101 m
-1/3
·s, 0.029~0.457 kg·s
-3
, respectively. In addition, flow velocity
and Reynold number had a greatly significant correlation with rainfall intensities, Manning roughness
coefficients, Darcy-Weisbach friction coefficients and stream power a week correlation with rainfall intensity,
Froude number had a week correlation with rainfall and slope. There was no obvious relationship between
Darcy-Weisbach friction coefficient and the Reynolds number and there was a “increase resistance”
phenomenon in engineering excavated soil slopes. 3) Interrill erosion was the main erosion form on
engineering excavated soil slopes. Rainfall intensity, runoff rate and slope gradient are key factors to model
sediment yield rate. Three commonly interrill erosion models were evaluated and compared, the fitness of
model followed the pattern: model 1(NSE=0.977)>model 2(NSE=0.966)>model 3(NSE=0.924). A further
comparison between the models showed that the convex curvilinear slope factor (model 1) was more precise
than the power (model 3) and linear (model 3) slope factor in describing the effect of slope gradient for this
data. Interrill erodibility adopted in the WEPP model was determined as 0.332×10
6
kg·s·m
-4
. The results
provide valuable data for establishing water erosion prediction model of engineering excavated slope.
1 INTRODUCTION
Erosive rainfall is one of the main driving factors of
slope hydraulic erosion. Rainfall indicators such as
rainfall volume, rainfall intensity and rainfall
ephemeris jointly influence the slope erosion process.
Pruski and Nearing
(2002) found that soil loss
increased by 0.85% when the total rainfall increased
by 1% for the same rain intensity conditions. The
raindrop striking splash not only causes separation
and displacement of soil particles, but also increases
the turbulence of water flow in the thin layer of the
slope. The boundary conditions of water flow in
indoor soil tank test are easy to control. It is a more
common method to study soil erosion dynamics of
slope, but it has large differences with natural slope.
As one of the most widely distributed and hazardous
sources of anthropogenic soil erosion, soil excavation
slopes are mainly excavated after topsoil stripping for
construction projects. The disturbed soil is generally
composed of weathered crust or parent material
458
Li, X., Wang, C., Jiang, S., Weng, S., Che, Y. and Chen, Y.
Hydraulic Characteristics and Sediment Yielding on Engineering Excavated Soil Slope under Simulated Rainfall.
In Proceedings of the 7th International Conference on Water Resource and Environment (WRE 2021), pages 458-466
ISBN: 978-989-758-560-9; ISSN: 1755-1315
Copyright
c
2022 by SCITEPRESS – Science and Technology Publications, Lda. All rights reserved
(parent rock) (Zhang et al., 2013). Soil excavation
slopes have high soil capacity, high compactness, and
steep slope, thus resulting in a soil loss process that
differs significantly from that of natural slopes. Under
the erosive rainfall, the water flow along the
excavated slope of the project constantly has the
convergence of mass sources, and the temporal and
spatial changes of runoff are obvious, and the soil
porosity of the lower bedding surface is lower, and the
infiltration capacity is poorer than that of the natural
slope surface, which is more complicated.
At present, there are relatively few studies on the
erosion characteristics of engineering excavation
surfaces and their erosion mechanisms. Most studies
have focused on the erosion of loose piles generated
by mineral extraction and road construction. For the
prediction model of soil erosion on excavated slopes,
the current research is still in the initial stage.
Therefore, this study analyzes the hydrodynamic
characteristics of erosion between fine trenches on
soil excavation slopes and its loss prediction under
erosive rainfall conditions by field artificial rainfall
test method, with a view to providing a theoretical
basis for the prediction and control of anthropocentric
soil erosion caused by engineering construction
excavation.
2 MATERIALS AND METHODS
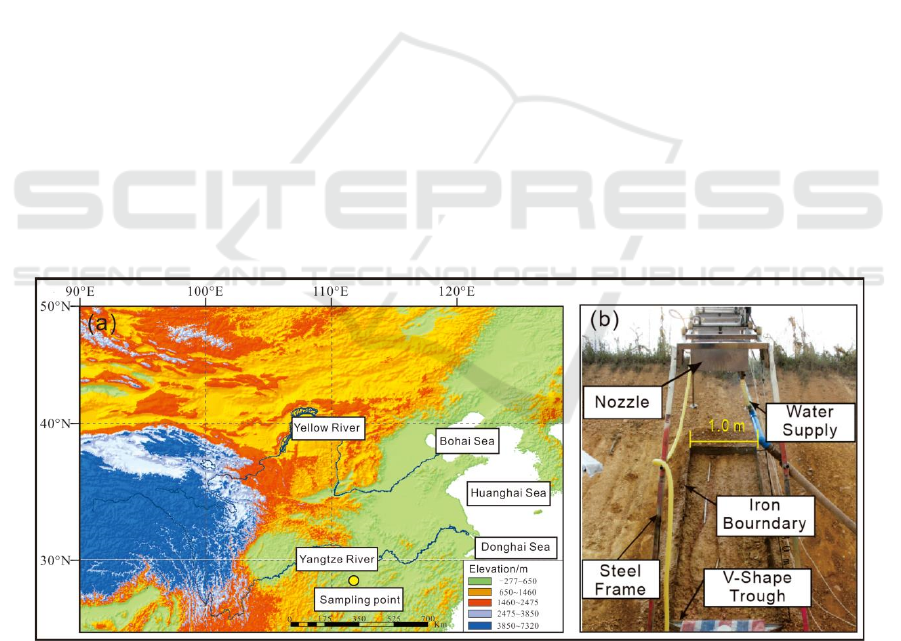
2.1 Experimental Design and
Observation
Three slope plots of 3 m in length and 1 m in width
were selected for this experiment on a highway slope
in central China, with the slopes of 10°, 15° and 20°.
The wall of the slot is made of stainless steel plate of
2 mm thickness to cut off the channel of runoff
exchange inside and outside the cell. A "V" shaped
catch basin was inserted at the lower end of the plot
and connected to a runoff collection barrel through the
catch basin to collect surface runoff, the structure of
which is shown in Figure 1.
The test uses a spray-swing simulated rainfall
device. The rainfall height was 2.5 m, the rainfall
uniformity was 85%, the effective rainfall area was
about 2 m×3 m, the simulated rain intensity range was
20~170 mm/h, and the simulated rainfall
approximated natural rainfall. In view of the range of
erosive rainfall occurring at the test site, the rainfall
intensities of 0.6, 1.1, 1.61, 2.12 and 2.54 mm/min
were finally designed for the combined tests. The total
amount of rainfall for each rainfall test was controlled
at 50 mm, and the rainfall ephemeris was set
according to the rainfall intensity, i.e., the rainfall
intensities for 83, 45, 31, 24 and 20 min were 0.6, 1.1,
1.61, 2.12 and 2.54 mm/min, respectively.
Figure 1: (a) Sampling point location;(b) Diagram of runoff and sediment collection system in the field.
The soil capacity of the road excavation slope of
the test site was measured by the ring knife method to
determine 1.54~1.58 g/cm
3
. The average capacity of
the test plot was 1.56±0.21 g/cm
3
and the average
water content was 17.6±0.18%. The slope of the
excavated surface is between 10° and 70°, with 40° to
70° accounting for 19%, 20° to 40° accounting for
75% and 20° accounting for 6%. Through particle
sieving of the collected soil samples, it was found that
the soil on the excavated slope was dominated by 1~2
Hydraulic Characteristics and Sediment Yielding on Engineering Excavated Soil Slope under Simulated Rainfall
459

mm soil particles with coarse texture, and the basic
soil properties are shown in Table 1.
Table 1: Physical-chemical properties of the test soil.
Soils
Particle composition/%
Particle size/ mm Mass percent/%
Disturbed soil
<0.01 0.19
0.01~0.1 4.48
0.1~0.5 22.10
0.5~1 21.68
>1~2 51.56
2.2 Test Process
A rain shelter was used to cover the plot before the
start of each test. Rain barrels were placed around the
perimeter of the plot to filter the rain intensity until
the rainfall intensity reached the test requirements.
Soil samples were collected on the excavated surface
to determine the pre-soil water content. When the soil
moisture content of the repeated tests showed a large
difference, it was left to stand for 24 hours after a light
rainfall in advance to eliminate the effect of soil
moisture content. From the beginning of the
experiment to the full production of flow on the slope,
the flow rate and sand content at the outlet were
measured and the time was recorded. During the test,
the water flow temperature is used to calculate the
water flow viscosity coefficient, while the total time
of rainfall is also recorded. Further, the sampling
interval was determined as one sample every 1 minute
at the beginning of the birth flow. After 3-7 minutes,
a sample was taken every 2 minutes. After 7-10
minutes, one sample was taken every 3 minutes. After
10 minutes, a sample was taken every 5 minutes. The
sediment content in the sample is determined by
drying method. The surface flow velocity was
determined by KMnO
4
pigment tracer method in three
measurement sections at the top, middle and bottom,
and each test was repeated three times to ensure the
test accuracy. After the test, the new plot was
rearranged for the test.
2.3 Data Analysis Method
1) Surface runoff velocity (V). The maximum surface
flow velocity was measured at three observation
sections using KMnO4 solution and an electronic
stopwatch to determine the time required to pass the
1 m measurement distance, and the average value was
taken and multiplied by a correction factor of 0.67 to
obtain the average surface runoff flow velocity (Li et
al., 2015), m·s
-1
.
2) Average water depth (H). Since the erosion of
the soil excavation slope during the test was
dominated by the erosion between fine trenches and
the water depth was small, it was difficult to
determine directly. Therefore, equation (1) was used
for calculation (Wang et al., 2016):
Q
h
VBt
=
⋅⋅
(1)
Where, h is the average water depth on the slope,
m; Q is surface runoff flow, m
3
; B is the cross-section
width, m; t is the time, s.
3) Calculation of hydrodynamic parameters. The
hydrodynamic parameters involved in this paper
include Reynolds number Re, Darcy-weisbach drag
coefficient f, Manning's roughness coefficient n and
flow power w. The above parameters were calculated
using the open channel flow equation (Luo et al.,
2009).
4) Soil denudation rate (D
i
) is the mass of soil
transported by surface runoff per unit area per unit
time, kg·(s
-1
m
-2
), which is calculated as follows:
s
i
M
D
At
=
⋅
(2)
Where, Ms is the soil loss from the slope in the
time period t(s), kg, obtained from runoff sediment
samples. A is the area of the test plot, m
2
.
5) In this paper, three commonly used statistical
models of inter-groove erosion on slope surfaces are
used to study their applicability in predicting inter-
groove erosion on soil excavation surfaces.
Model 1 adopts WEPP inter rill erosion equation
(Flanagan & Nearing, 1995):
iif
D
KQS I=
(3)
In which, Ki is the erodibility factor between
rills,kg·s·m
-4
; Q is the average runoff intensity, m·s
-1
;
S
f
is the slope factor and the slope of the test plot; I is
rain intensity, m·s
-1
.
Model 2 adopts the inter rill erosion equation
including runoff factor proposed by Kinnell (1993):
ii
D
KQSI=
(4)
Where, Q is the average runoff intensity, m·s
-1
; S
is the slope of the test area, m·m
-1
.
WRE 2021 - The International Conference on Water Resource and Environment
460
Model 3 adopts the inter rill erosion equation
proposed by Bulygin et al. (2002):
(5)
SPSS 20.0 was used for data analysis, and LSD
(lowest extreme difference method) was applied in
ANOVA for multiple comparisons with a significance
level of p<0.05. The model accuracy evaluation
metrics were selected from the complex correlation
coefficient (R
2
) and the Nash-Suttclife efficiency
coefficient (NSE), where the NSE was calculated
using the following equation (Bulygin et al., 2002):
(6)
Where Oi is the measured value, Oc is the
calculated value and Om is the average value of the
measured value.
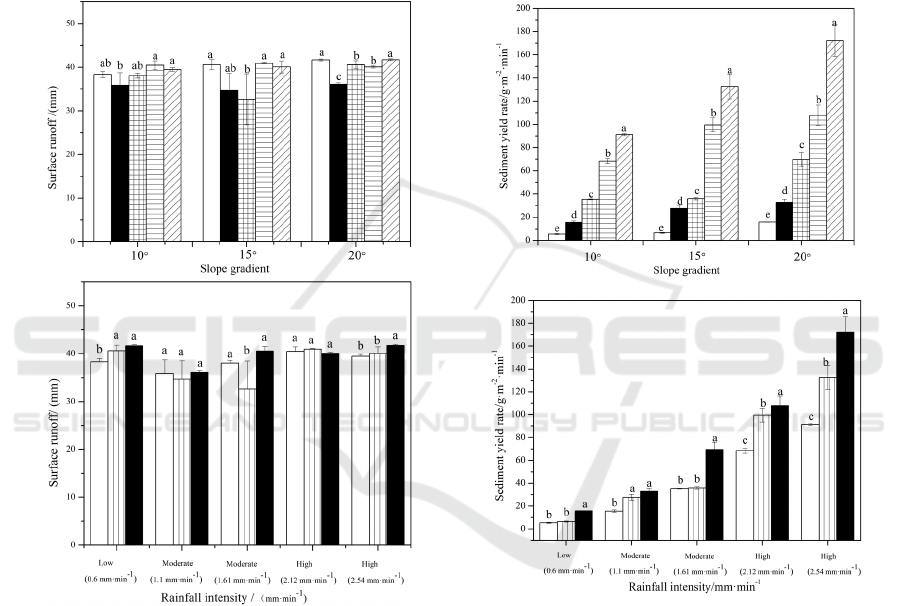
(a) Surface flow (b) Sediment
y
ield rate
Figure 2: Surface runoff volume and sediment yield rate for different slope gradients and rainfall intensities. For each
treatment, means with the same lower-case letter are not significantly (p<0.05, least significant difference) different.
3 RESULTS AND ANALYSIS
3.1 Analysis on Characteristics of
Water and Soil Loss on Soil
Excavation Slope
Surface runoff from soil excavation slopes varied
between 33.6 and 42.7 mm under different slope and
rain intensity conditions (Figure 2a). Surface runoff,
as the main hydrological process under erosion
conditions, accounted for 67.2 to 85.4% of the total
rainfall. A study by Defersha and Melesse (2012)
indicated that the effect of slope and rain intensity on
sand and flow production on slopes varies with
changes in soil properties on the subsurface. In this
study, an artificially simulated rainfall scheme was
adopted to control the total rainfall of 50 mm with
rainfall intensities of 0.6, 1.1, 1.61, 2.12 and 2.54
mm/min. Under the same slope condition, the surface
runoff volume shows a phenomenon of decreasing
and then increasing with the increase of rain intensity,
Hydraulic Characteristics and Sediment Yielding on Engineering Excavated Soil Slope under Simulated Rainfall
461

which is due to the fact that when the soil on the slope
surface produces crust, it will make the slope surface
flow production mechanism become more
complicated. When the rain intensity changes from
small to medium rain intensity, the splash of raindrops
is further enhanced. The soil compacted by the
excavation is further transported and the soil porosity
increases, thus increasing the soil infiltration. With
the further increase of rainfall intensity, the rainfall
intensity is greater than the infiltration rate, forming
superinfiltration production flow and accelerating the
formation of surface runoff. The increase of surface
runoff flow rate will reduce the chance of infiltration
of slope surface flow. Therefore, the surface runoff
appears to decrease and then increase with the
increase of rainfall intensity.
There were significant differences in sand yield
per unit area under different slope and rain intensity
conditions (Figure 2b), and the sand yield per unit
area increased with the increase of slope and rain
intensity. When the slope of excavation slope
increases from 10° to 20°, the sand production rate per
unit area increases by 2.92, 2.12, 1.96, 1.57 and 1.88
times when the rain intensity is 0.6 mm·min
-1
, 1.1,
1.61 mm·min
-1
, 2.12 and 2.54 mm·min
-1
, respectively.
On the other hand, the sand production rate per unit
area increased 16.87, 20.48 and 10.88 times when the
rainfall intensity increased from 0.6 mm min
-1
to 2.54
mm min
-1
at slopes of 10°, 15° and 20°, respectively.
This is consistent with the findings of Ziadat and
Taimeh
(2013). The effect of variation in rainfall
intensity on sand production rate is greater than the
effect of slope variation on sand production rate.
3.2 Analysis on Hydrodynamic
Parameters of Soil Excavation
Slope
Table 2 shows the correlation coefficient statistics of
hydrodynamic parameters with slope S, rain intensity
I and rain intensity-slope interaction (I×S). Under
different rain intensity conditions, the surface runoff
velocities V of 10°~20° soil excavation slopes were
0.047~0.084, 0.052~0.092 and 0.054~0.104 m·s
-1
,
respectively. The flow velocity V increased with
increasing rain intensity at the same slope. There is a
significant linear relationship between the two
(R
2
=0.58-0.92, P<0.01). Under the same rainfall
intensity, the runoff flow velocities of slopes of 15°
and 20° were 0.84-1.19 times and 0.92-1.23 times
higher than those of slopes of 10°, respectively. The
differences between the runoff velocities of excavated
slopes with different slopes of soil were not
significant (P>0.05). The results of correlation
analysis showed that the soil excavation slope flow
velocity was not significantly correlated with slope
(P>0.05) and was highly significantly correlated with
rain intensity I and the interaction of slope and rain
intensity I×S (P<0.01).
Table 2: Correlations between flow hydrodynamic parameters and coupling effects of rainfall intensity and slope gradient.
Variable V/(m·s
-1
) Re Fr f
n
/(m
-1/3
·s)
w/(kg·s
-3
)
I 0.892** 0.954** -0.199 0.091 0.397 0.759
S
0.198 0.213 -0.052
/
/
/
I×S 0.878** 0.918** -0.109 / / /
The Reynolds number of soil excavation slope
runoff under different rain intensity and slope
conditions is between 48.985 and 392.918, and the
soil excavation slope runoff flow pattern belongs to
the category of laminar flow according to the criteria
for determining the flow pattern of open channel flow.
In the test, it was observed that no matter what the
combination of rain intensity and slope, there was
obvious sand-holding phenomenon in the process of
slope flow movement. The sand concentration of the
water body at the outlet of surface runoff is between
1.2% and 23.7%. The slope runoff flow pattern should
belong to the category of turbulent flow. The
traditional criteria for determining the flow pattern of
open channel flow are not applicable to the soil
excavation slope. Re had the highest correlation with
rainfall intensity I and insignificant correlation
(P>0.05) with slope S (Table 2), indicating that the
magnitude of rainfall intensity determines the
variation of runoff patterns on the soil excavation
slopes. The Froude number Fr is between 0.355 and
0.581, all of which are less than 1 and are slow flow.
Correlation analysis showed that the correlation
between Fr and the interaction of rain intensity I,
slope S and rain intensity I × S was not significant
(P>0.05).
The Darcy-Weisbach resistance coefficient f and
the Manning coefficient n are hydraulic parameters
commonly used to characterize the resistance to water
flow on a slope. Under different rain intensity
conditions, the runoff resistance coefficient of
excavation slope at slope of 10° ranged from 1.317 to
WRE 2021 - The International Conference on Water Resource and Environment
462
3.527. Under the same rain intensity conditions, the f-
values of 15° and 20° soil excavation slopes are 1.04-
2.18 times and 1.46-2.97 times higher than those of
10° slopes. The f-value of soil excavation slope
increases with the increase of slope. At the same slope,
there is no significant trend in the f-value of soil
excavation slope with rain intensity. The Manning
coefficients n of 10°~20° soil excavation slope is
0.044~0.084, 0.057~0.090 and 0.079~0.101
respectively. The correlation between the f and n
values of the soil excavation slope and the rain
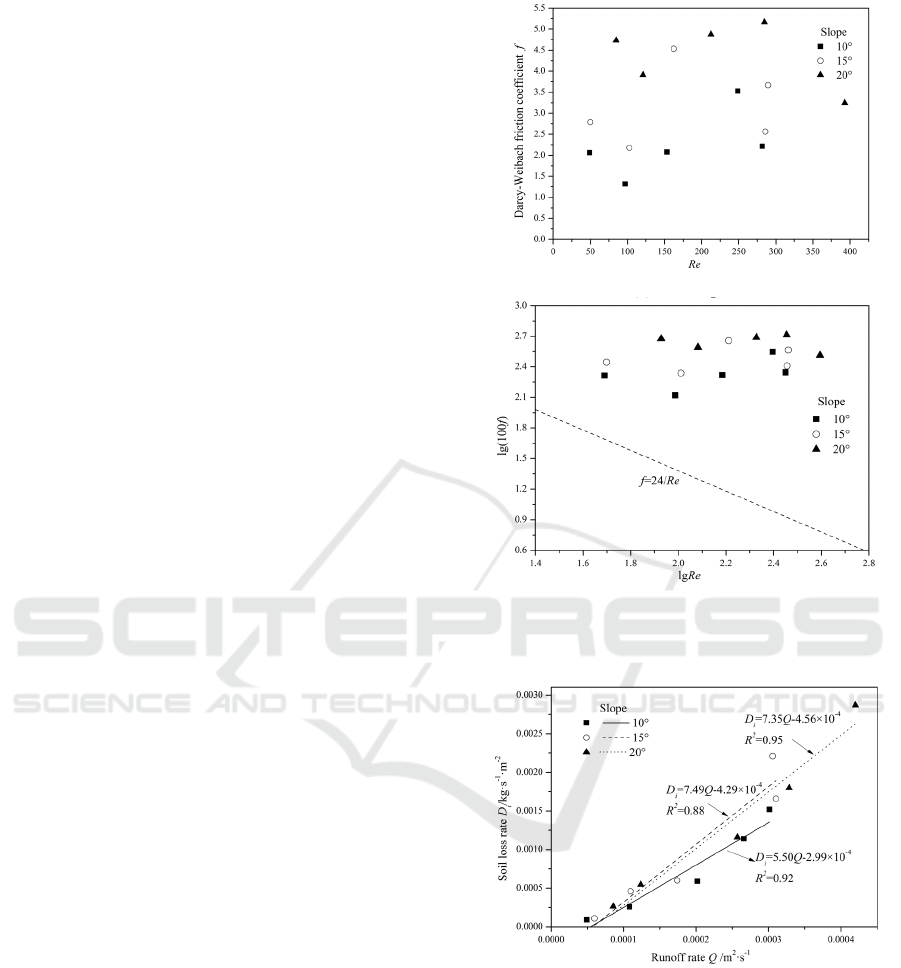
intensity was not significant. A power function
relationship exists between the slope flow resistance
coefficient f and the Reynolds number Re (Nearing et
al., 1997). The results of this test show that there is no
significant relationship between f and Re (see Figure
3a). The Reynolds number is not the main factor
affecting the resistance coefficient because the
particle resistance of the soil excavation slope does
not dominate. This is in agreement with the findings
of Nearing et al. (1997). On rough slopes, there is no
single relationship between f and Re As can be seen
from Figure 3b, the resistance of slope flow under
rainfall conditions is greater than that under non-
rainfall conditions, and the extent of its effect is
influenced by the depth of water flow, slope and
surface morphology. There is an obvious
phenomenon of "increasing resistance" of water flow
on the slope of soil excavation.
The water flow power w incorporates the role of
slope and runoff rate. Soil flow can be predicted in
terms of water flow dynamics. The water flow power
ranged from 0.029 to 0.457 kg·s
-3
for different slope
and rain intensity conditions. Under the same
conditions of rain intensity, the water flow power (w)
of slope 15° and 20° is 1.517~1.745 times and
2.282~3.379 times than that of slope 10°. The w value
increases as the slope increases. The correlation
between w value and rain intensity is not significant.
The relationship between the power of water flow and
the amount of soil loss per unit was obtained from the
regression analysis, as follows:
(7)
Where, qs is the unit soil loss, g·s
-1
·m
-1
; W is the
water flow power,g·s
-3
.
From equation (7), it can be seen that the linear
relationship between water flow power and unit soil
loss has a high coefficient of determination and can
be used to predict soil loss from soil excavation
surfaces. Meanwhile,the water flow power must reach
a certain critical value for soil loss to occur on the
slope surface.
(a) Scatter plot
(
b
)
Double-Lo
g
p
lot
Figure 3: Relationship between Darcy-Weisbach resistance
coefficient and Reynolds number.
Figure 4: Soil loss rates as functions of runoff rates.
3.3 Analysis of Rill Erosion Model on
Soil Excavation Slope
Figure 4 shows the relationship between runoff rate
and soil denudation rate on the soil excavation slope.
Runoff rates of 4.92×10
-5
to 3.01×10
-4
m
2
·s
-1
for
excavated surfaces with a slope of 10°. When the
slope is 15° and 20°, the runoff rate is 0.86 to 1.21
times and 1.14 to 1.74 times, respectively. There was
a good linear relationship between soil denudation
Hydraulic Characteristics and Sediment Yielding on Engineering Excavated Soil Slope under Simulated Rainfall
463
rate and runoff rate. Among them, the slopes of the
fitted equations were 1.36 and 1.33 times higher for
slopes of 15° and 20° than for slopes of 10°,
respectively. Therefore, the slope is the key factor
affecting soil loss on the slope of soil excavation, and
the degree of its influence increases with the slope
showing the characteristics of first increasing and
then leveling off.
The relationship between soil erosion rates
between fine channels on soil excavated slopes and
the rainfall runoff factor and topographic factor was
obtained by predicting the soil erosion rates between
fine channels based on the equations used in the
WEPP model for calculating fine channel erosion:
(8)
Where, Di is the soil erosion rate between rills on
the soil excavation slope, kg·s
-1
·m
-2
; Q is the average
runoff rate of surface runoff, m·s
-1
; Sf is the slope
factor; I is the rain intensity, m·s
-1
.
The soil erodibility factor Ki of the soil excavation
slope is 0.332×10⁶kg·s
-1
·m
-2
obtained from the
regression coefficient of equation (8).
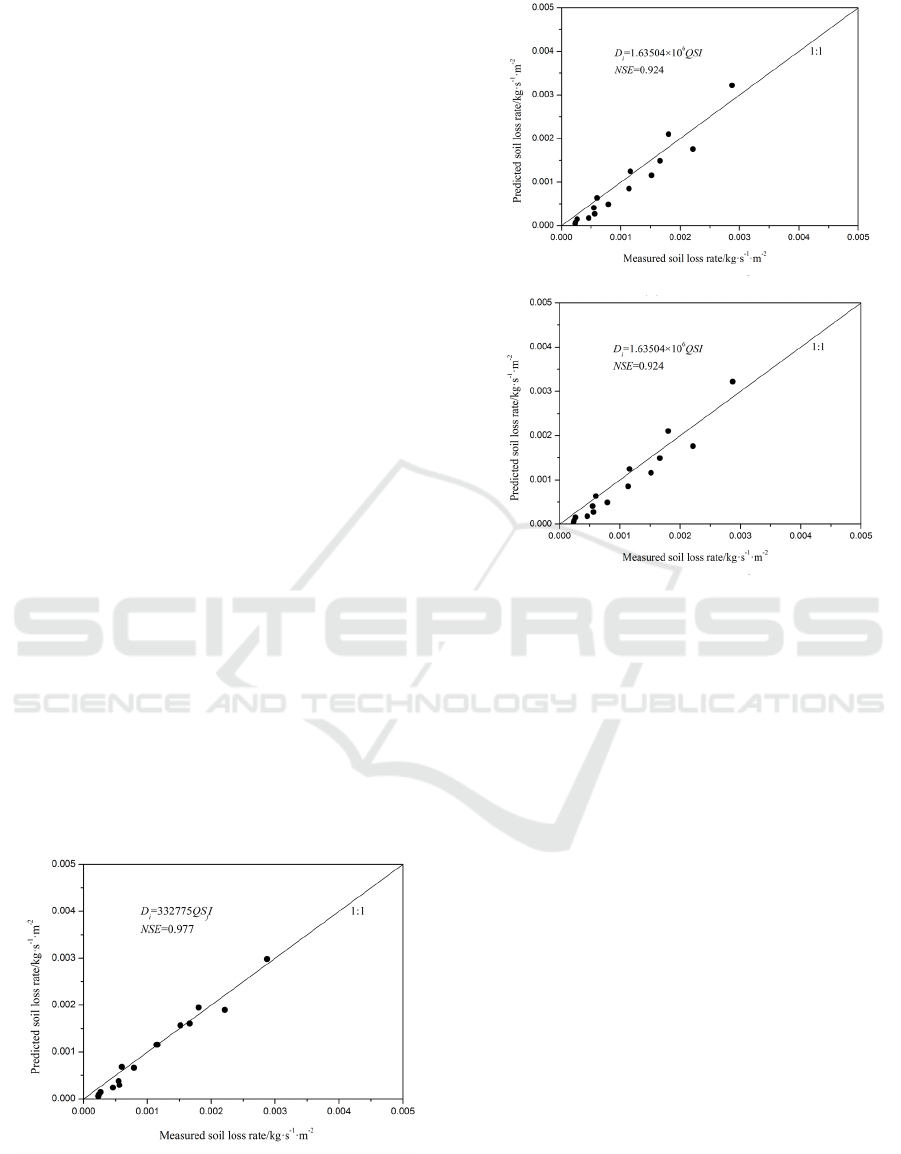
The prediction results of the fine intergully
erosion models selected in this study are shown in
Figure 5. The Nash efficiency coefficients of model 1,
model 2, and model 3 were 0.977, 0.924, and 0.966,
respectively, indicating that all three models
performed well in predicting soil denudation rates on
soil excavation slopes under the rainfall intensity and
slope conditions of this study. Model 1 was the best in
predicting soil denudation rate on soil excavation
slopes. The comparison of the model structures
reveals that the calculation results using the convex
curve type slope factor index are more accurate.
(
a
)
Model 1
(
b
)
Model 2
(c) Model 3
Figure 5: Comparison between measured and predicted soil
losses from the excavated soil slope.
4 DISCUSSION
In this paper, the hydrodynamic characteristics of the
soil excavation slope are analyzed for its fine
interchannel erosion process under rainfall conditions.
The soil excavation slope has the characteristics of
high compactness, high capacity, low infiltration rate
and steep slope, etc. Its process of producing flow and
sand is quite different from the natural slope. The
erosion mode of the soil excavation slope during the
sampling stage of this test is mainly interfine gully
erosion, and the hydrological process is mainly
surface runoff, which accounts for 67.2~85.4% of the
total rainfall. Under the test rainfall conditions, the
surface runoff flow pattern on the soil excavated slope
with slope of 10°~20° still belongs to laminar flow.
However, there is obvious tumbling of fine sand in the
test slope surface runoff, which contradicts with the
non-mixing of masses between the layers of laminar
flow. At the same time, the resistance coefficient of
surface runoff from soil excavated slopes is greater
than that in open channel laminar flow (Figure 3), and
for this phenomenon can be explained from the
perspective of slope flow resistance composition. The
WRE 2021 - The International Conference on Water Resource and Environment
464

slope surface flow resistance includes four
components: particle resistance, morphological
resistance, wave resistance and rainfall resistance,
and these four components can be superimposed on
each other. In this study, field rainfall tests were used,
with no ground cover on the excavated slope and the
slope flow depth h ranging from 1.04 to 4.03 mm. The
median diameter of raindrop is 2.30 mm, because
when h ≦ 3mm, the raindrop striking force can
penetrate the water layer and affect the topsoil. At the
same time, raindrops disturbing the thin layer of water
flow on the slope increase the turbulence of the water
flow, thus increasing its resistance (Proffitt et al.,
1993).
Through the test observation, the erosion process
of soil excavation slope surface shows that the thin
layer of water flow erosion is dominant, i.e., fine
inter-groove erosion. Therefore, the conclusions
obtained from this study are applicable to the surface
erosion stage of the slope without erosion ditch. Water
flow power is suitable for describing the erosion
process of thin water flow on slopes, and can reflect
the effect of slope water runoff rate and slope factor
on soil denudation rate. The sand transport process of
slope surface flow caused by rainfall is influenced by
the water depth, while the size of the water depth is
influenced by the slope. Rain intensity is also an
important parameter that influences the erosion
process between fine trenches on the slopes of soil
excavations (Kinnell, 1988). Through the above
analysis, we further added the rain intensity factor
into the equation for predicting soil denudation rate.
The results show that the prediction accuracy of the
model in Table 3 is greater than that of Eq. (7), and
the model in Table 3 takes into account the effects of
rainfall, runoff and slope on soil denudation rate at the
same time. Models 1 and 3 performed better in
predicting soil denudation rates compared to model 2,
indicating that the convex curve type slope factor
index is more suitable for soil denudation rate
calculation on soil excavation slopes. The slope of the
fitted equation between soil denudation rate and
runoff rate under different slope conditions is not a
single linear relationship with increasing slope
(Figure 4), which is similar to the results of Parson
and Abrahams (1993). The amount of erosion
between fine trenches showed a tendency to increase
and then decrease with increasing surface slope, i.e.,
there was a critical slope, and this phenomenon was
also present on the soil excavation slopes.
Due to the limitation of experimental conditions,
only the soil excavation slope was selected for this
study to investigate the hydrodynamic characteristics
during the erosion between fine trenches. In reality,
there are various forms of engineering excavation
slopes, and the composition of the sub-bedding
material, the depth of the excavated soil layer and the
length of the excavated slope will affect the process
of slope hydraulic erosion, and the way of erosion is
also diversified, including sheet erosion, fine ditch,
shallow ditch and other erosion methods. In this paper,
the field excavation surface plot size is small, the
material composition of the lower bedding surface is
relatively single, the test is not designed separately for
different slope lengths, and the erosion process of the
excavation slope under the condition of water and
sand coming from above is not considered. The later
research needs to further study the test plot size,
material composition of the lower bedding surface,
erosion mode and other aspects, so as to provide
reference for the establishment of erosion prediction
model for the engineering excavation slope.
Table 3: Efficiency of selected models.
Equation NSE
Model 1 D
i
=332775QS
f
I 0.977
Model 2 D
i
=1.63504×10
6
QSI 0.924
Model 3 D
i
=753568QS
2/3
I 0.966
5 CONCLUSION
By establishing excavated slope plots with different
slopes (10°, 15° and 20°) of soil in the field and
studying the hydrodynamic characteristics of fine
interchannel erosion on excavated slopes under
different simulated rainfall intensities (0.6, 1.1, 1.61,
2.12 and 2.54 mm/min) and a design total rainfall of
50 mm, the main conclusions are as follows:
1) The surface runoff from the soil excavation
slope is 33.6~42.7 mm, and surface runoff is the main
hydrological process, accounting for 67.2~85.4% of
the total rainfall. The influence of rainfall intensity on
sediment yield is greater than that of slope change.
2) The flow velocity and Reynolds number of the
soil excavation surface were highly significantly
correlated (P<0.01) with the interaction of rain
intensity I and slope and rain intensity I×S. Interaction
between Froude number and rain intensity I, slope s,
slope and rain intensity I×S was not related; Manning
coefficient, Darcy weisbach resistance coefficient and
flow power are not related to rain intensity. There is
no obvious relationship between Darcy-Weisbach
resistance coefficient and Reynolds number, and the
phenomenon of "increasing resistance" exists on the
soil excavation slope.
Hydraulic Characteristics and Sediment Yielding on Engineering Excavated Soil Slope under Simulated Rainfall
465

3) All three fine intergully erosion models were
able to predict the soil denudation rate of soil
excavated slopes better. In terms of fitting effect,
model 1 (NSE=0.977) > model 3 (NSE=0.966) >
model 2 (NSE=0.924). The convex curve type slope
factor index is more suitable for the calculation of soil
denudation rate of soil excavation slope. The soil
erodibility factor Ki of the soil excavation slope is
0.332×10⁶ kg·s·m
-4
calculated from the WEPP inter
fine gully erosion equation (Model 1).
ACKNOWLEDGMENT
This work is supported by the State Grid Corporation
of China (WBS NO.501304200006)
REFERENCES
Bulygin, S. Y., Nearing, M. A., & Achasov, A. B. (2002).
Parameters of interrill erodibility in the WEPP model.
Eurasian Soil Science C/C of Pochvovedenie, 35(11),
1237-1242.
Defersha, M. B., & Melesse, A. M. (2012). Effect of rainfall
intensity, slope and antecedent moisture content on
sediment concentration and sediment enrichment
ratio. Catena, 90(3), 47-52.
Flanagan, D. C., & Nearing, M. A. (1995). USDA-Water
Erosion Prediction Project, hillslope profile and
watershed model documentation. USDA ARS: National
Soil Erosion Research Laboratory.
Kinnell, P. I. A. (1988). The influence of flow discharge on
sediment concentrations in raindrop induced flow
transport. Soil Research, 26(4), 575-582.
Kinnell, P. I. A. (1993). Runoff as a factor influencing
experimentally determined interrill erodibilities. Soil
Research, 31(3), 333-342.
Li, G., Abrahams, A. D., & Atkinson, J. F. (2015).
Correction factors in the determination of mean velocity
of overland flow. Earth Surface Processes & Landforms,
21(6), 509-515.
Luo, R. T., Zhang, G. H., & Cao, Y. (2009). Progress in the
research of hydrodynamic characteristics of sediment
laden overland flow. Progress in Geography, 28(4),
567-574.
Nearing, M. A., Norton, L. D., & Bulgakov, D. A., Larionov,
G. A., West. L. T., & Dontsova, K. M. (1997).
Hydraulics and erosion in eroding rills. Wate r
Resources Research, 33(4), 865-876.
Parson, A. J., & Abrahams, A. D. (1993). Field
investigations of sediment removal in interrill overland
flow. UK: UCL Press.
Proffitt, A. P. B., Rose, C. W., & Lovell, C. J. (1993).
Settling velocity characteristics of sediment detached
from a soil surface by raindrop impact. Catena, 20(1–
2), 27-40.
Pruski, F. F., & Nearing, M. A. (2002). Climate‐induced
changes in erosion during the 21st century for eight u.s.
locations.Water Resources Research, 38(12), 34-1–34-
11.
Wang, T. W., Yu, B., Liu, Y. J., & Li, Z. X. (2016). Impacts
of road surface shape on soil erosion of rural unpaved
road. Transactions of the Chinese Society of
Agricultural Engineering, 32(19), 162-168.
Zhang, P. C., Zhou, R., Cheng, D. B., Li, Y. L., & Xu, W. S.
(2013). Discussion on characteristics of engineering
excavated slope and rapid monitoring technology for
soil loss. Journal of Yangtze River Scientific Research
Institute, 30(9), 24-28.
Ziadat, F. M., & Taimeh, A. Y. (2013). Effect of rainfall
intensity,slope and land use and antecedent soil
moisture on soil erosion in an arid environment. Land
Degradation and Development, 24(6), 582–590.
WRE 2021 - The International Conference on Water Resource and Environment
466
