
Drought Analysis and the Characteristics of Hydro-meteorological
Changes in the Jinsha River Basin
Xing Qu
1,2
, Deng Pan
1,2
,
Junjun Huo
1,2,*
, Zhe Yuan
1,2
, and Yuanzhi Tang
1,2
1
Changjiang River Scientific Research Institute of Changjiang Water Resources Commission, Wuhan 430010, China
2
Hubei Provincial Key Laboratory of Basin Water Resources and Ecological Environment, Wuhan 430010, China
Keywords: Climate change, Drought analysis, Mann-Kendall test, Jinsha River Basin
Abstract: The Jinsha River Basin (JRB) is the most important tributary of the Changjiang River and the most ecological
vulnerable region to climate change. Therefore, to better understand the hydro-meteorology characteristics of
JRB and enhance hydrological forecasts, a temporal-spatial analysis of historical hydro-meteorological
elements and drought characteristics is required. In this study, 45 meteorological stations and 5 hydrologic
stations in JRB for the last 60 years of historical data were utilized for analyze the temporal-spatial distribution
and trends of hydro-meteorological elements, while drought characteristics in this basin were assessed using
SPI values at six-month scales (SPI-6). The results show that: (1) the three daily temperature types (minimum,
mean and maximum) and precipitation of the JRB all show an increase from the upper to lower reaches. (2)
the Mann-Kendall test analysis of hydro-meteorological elements’ annual values reveals that the mean
temperature of 42 stations is rising, while precipitation is rising at 25 stations. The runoff at all five hydrologic
stations is increasing. The temperature and precipitation in the upper reaches are the areas with the greatest
increase in the JRB, while the precipitation in the lower reaches is the only one that is on a downward trend.
(3) In the drought analysis based on SPI-6, the downstream of JRB, which is located in Sichuan and Yunnan
provinces, is the region with the most severe drought. There is no visible trend in drought duration at most
stations, and the drought magnitude analysis is dominated by a decreasing trend. However, the drought
intensity analysis is dominated by an uptrend, especially in the mid- and lower streams.
1 INTRODUCTION
Drought, the most complex natural phenomena, is
characterized by strong progressivity, a wide range of
influence, and large losses, which have attracted
widespread attention (Keyantash & Dracup, 2020).
For example, some areas in southern China, including
Yunnan, Guangdong, Guangxi, and Shanxi,
experienced heavy drought conditions in the winter of
2020 and spring of 2021, and a total of 470,000 rural
residents experienced drinking water difficulties as a
result of the drought. Generally, droughts can be
classified into three major types based on its cause:
meteorological, agricultural and hydrological
droughts (Wang et al., 2016). Meteorological drought
is mainly caused by poor precipitation and
atmospheric circulation anomalies (van Loon et al.,
2015); agricultural drought, also known as soil
moisture drought, is defined by a lack of soil water
(Van Hateren et al., 2020); and hydrological drought
is associated with water shortage in rivers, lakes,
groundwater and other water bodies (van Loon,
2015). To assess the drought characteristics, several
drought indices are the most widely used (McKee et
al., 1993; Welford et al., 1993; Shukla et al., 2008),
including the standardized precipitation index (SPI)
(McKee et al., 1993), the soil moisture drought index
(SMDI) and the standardized runoff index (SRI). In
recent decades, numerous research based on various
drought indicators, including drought duration and
drought severity, have been carried out in some
watersheds of China. For example, Xu et al. (2015a)
based on the 3-month scale SPI constructed a
multidimensional clustering method to assess drought
risk of China during 1961-2012. The findings show
that two of the most extreme drought swept through
more than half of China's non-arid regions, occurring
from 1962 to 1963 and from 2010 to 2011. Zhai et al.
(2010) used monthly scale degree data to calculate
annual average SPI and PDSI values for
approximately five hundred meteorological stations
in China over the last 50 years. They discovered that
426
Qu, X., Pan, D., Huo, J., Yuan, Z. and Tang, Y.
Drought Analysis and the Characteristics of Hydro-meteorological Changes in the Jinsha River Basin.
In Proceedings of the 7th International Conference on Water Resource and Environment (WRE 2021), pages 426-434
ISBN: 978-989-758-560-9; ISSN: 1755-1315
Copyright
c
2022 by SCITEPRESS – Science and Technology Publications, Lda. All rights reserved
the upper and lower Changjiang River or the
mountainous northwest region have significant
positive trends in these indices. Xiang et al. (2020)
combined a multidimensional Copula function
hydrological approach that can applied in
hydrological drought risk assessment, especial.
According to the findings, mild to moderate
hydrological droughts dominated the study area from
1961 to 2018.
China is suffering from severe water scarcity, with
per capita water resources that are only one-third of
the global average. Extreme weather is becoming
more common due to the climate change and the
intensification of human activities, which makes
extreme droughts the most serious disaster in terms of
impact (Schubert et al., 2016; Mishra et al., 2010), and
has resulted in significant economic losses in the
affected regions. According to statistics, during the
period of 1997-2009, the affected areas and economic
losses in the country were clearly above the average of
the last 30 years, with a mega-drought occurring
almost every two years (Leng et al., 2015). According
to the data from the Ministry of Water Resources'
Water and Drought Disaster Bulletin, the loss of cash
crops due to drought in 2003 amounted to RMB 53.8
billion, while 33 million people were suffering from
drinking water shortages. Other examples include, the
2006 mega-drought in provinces of Sichuan and
Chongqing (Yu et al., 2014), at the same time the most
severe meteorological drought event since
meteorological records were kept in the southwest
from 2009 to 2012, which had disastrous and far-
reaching consequences for agriculture, society and the
economy. Extreme weather has become more
common in recent years, with the intensification of
global warming and the impact of human activities,
and drought disasters will continue to pose a
significant threat to China's food security, human and
animal drinking water safety, and ecological
environment security. Therefore, relevant departments
and scientific research institutions need to pay more
attention to drought disasters and conduct more in-
depth research (Xu et al., 2015a; Xu et al., 2015b).
The Jinsha River Basin (JRB) is abundant in
hydroelectric resources and is China's largest planned
hydropower base. This basin has significant spatial
and temporal differences in climate and is susceptible
to climate change (Wang et al., 2013), as well as
drought disasters have been frequented in recent
years, causing significant losses to local economic
and social development. However, the awareness of
drought in this basin is still insufficient, and the
ability of drought management and forecasting
capabilities are still limited. Therefore, research on
the hydro-meteorological changes’ spatiotemporal
features and droughts in the JRB is essential for
strengthening drought control and prevention in this
basin. In this paper, 45 meteorological stations and 5
hydrologic stations of JRB for the last 60 years of
historical data were utilized to clarify the
spatiotemporal distribution and trends of hydro-
meteorological elements, while drought
characteristics, including meteorological and
hydrological drought, in the basin were assessed
using SPI values at six monthly scales.
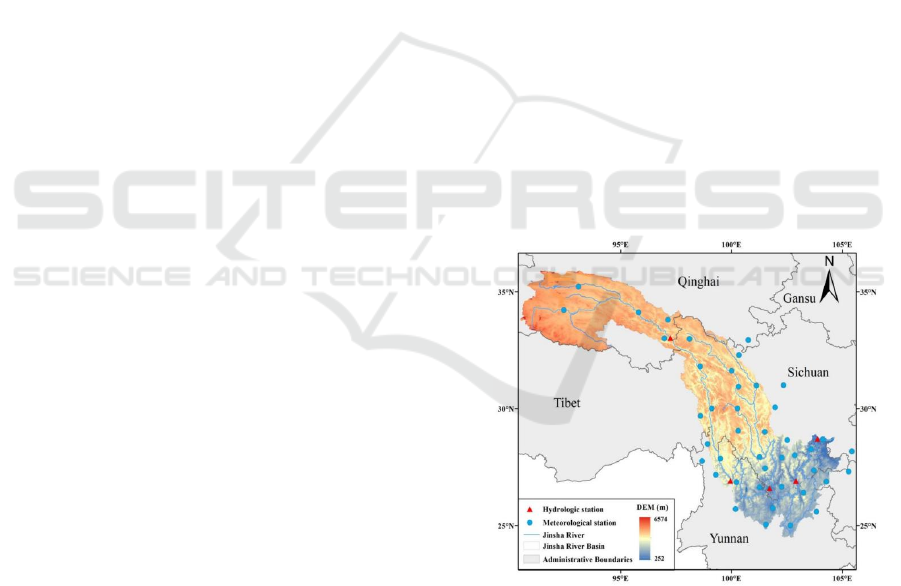
2 STUDY AREA
The JRB is the section of the Yangtze River from its
headwaters to Yibin (Figure 1). It includes the
Tongtian River and Tuotuo River, is located on the
western edge of China's Qinghai-Tibet Plateau,
Yunnan-Guizhou Plateau, and the Sichuan Basin, and
spanning five provinces (regions): Qinghai, Tibet,
Sichuan, Yunnan, and Guizhou. The area of JRB is
about 500,000 km
2
, accounting for 27.8% of the total
area of the Yangtze River Basin; the length of the
river is approximately 3,500 km, accounting for
55.5% of the Yangtze River's total length; and the
drop is approximately 5,100 m, which is rich in
hydropower energy.
Figure 1: The map of Jinshajiang River Basin (JRB), where
blue dots are meteorological stations and red triangles are
hydrologic stations.
Influenced by the landform and terrain, the
climate characteristics of JRB has clear distinct
distribution. A plateau climate dominates the basin's
upper and middle regions, while the lower portion of
the main stream from Qiaojia to Pingshan is the warm
temperate climate. The temperature increases
Drought Analysis and the Characteristics of Hydro-meteorological Changes in the Jinsha River Basin
427
progressively from upstream to downstream, from
northwest to southeast. It is cold in the Qinghai-Tibet
Plateau, where the average temperature is below 0°C
for 7 months of the year. And for more than 65% of
the regions, the annual average temperature is below
0°C. The general precipitation distribution in JRB
also increases gradually from northwest to southeast.
From June to October is the flooding season of JRB
when 75%-85% precipitation happens.
3 DATA AND METHODS
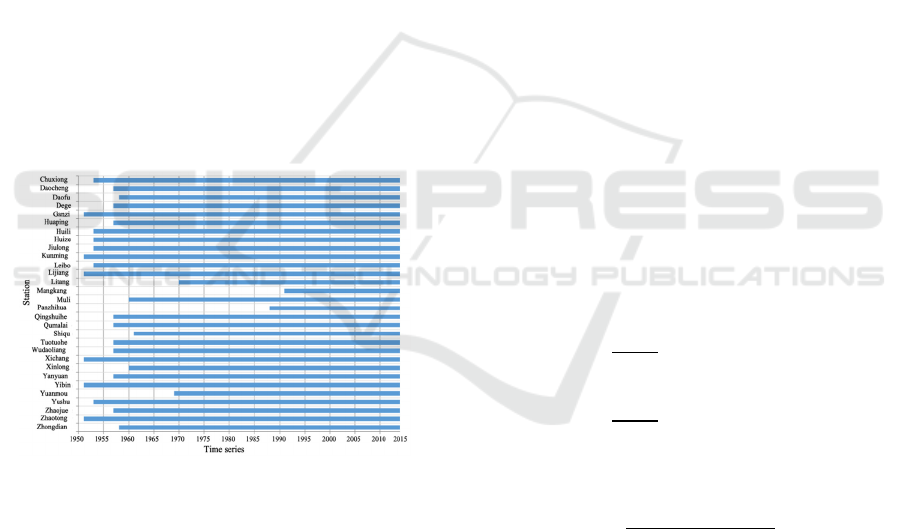
3.1 Data
The meteorological dataset was obtained from the
China Meteorological Data Sharing Service System
(He et al., 2020). There are 45 meteorological stations
within and around the watershed, among which only
34 stations are located within the JRB. The data series
range from 1950 to 2014, with 27 stations having time
series spanning more than 50 years, and data gaps for
some stations being filled with interpolation. Figure 2
shows the data series statistics for 30 stations in the
watershed.
Figure 2: Period of recorded meteorological daily data for
each of the 30 stations located within the JRB.
The five hydrological stations are Zhimenda,
Pingshan, Shigu, Panzhihua, and Huatan. Except for
a few empty values at Huatan station, the time series
of the other four stations were complete. These vacant
values were also filled by interpolation.The copyright
form is located on the authors’ reserved area.
3.2 Methods
3.2.1 Mann-Kendall Test
The Mann-Kendall (M-K) test (Kendall, 1975;
Bjerklie, 2007) is used to determine whether the
variable of interest has a monotonic upward or
downward trend over time. Compared to parametric
linear regression analysis, it is not necessary to
consider whether the sequence under consideration
follows a specific probability distribution. The M-K
test is best seen as an exploratory technique,
especially useful for evaluating hydro-meteorological
data (McLeod et al., 1990), and is most useful for
identifying stations that have obvious or significant
changes and quantifying these findings (Hirsch et al.,
1982).
According to the null hypothesis H
0
, these sample
sequences are all independent and therefore have:
𝐻
:𝑃𝑟𝑜𝑏𝑌
𝑌
=0.5,
𝑤ℎ𝑒𝑟𝑒 𝑇
𝑇
(1
)
𝐻
:𝑃𝑟𝑜𝑏𝑌
𝑌
0.5 (2 − 𝑠𝑖𝑑𝑒𝑑 𝑡𝑒𝑠𝑡)
(2
)
The M-K test statistic S is formulated by equation
(3) (Yue et al., 2002):
𝑆=𝑠𝑔𝑛𝑥
−𝑥
(3
)
𝑠𝑖𝑔𝑛
(
𝑥
)
=
+1 𝑖𝑓 𝑥0
0 𝑖𝑓 𝑥=0
−1 𝑖𝑓 𝑥<0
(4
)
The M-K test statistic Z is calculated using the
equation(5):
𝑍=
⎩
⎪
⎨
⎪
⎧
𝑆−1
𝜎
𝑆0
0 𝑆=0
𝑆+1
𝜎
𝑆<0
(5
)
where the variance σ
is defined as:
𝜎
=
𝑛
(
𝑛−1
)(
2𝑛+ 5
)
18
(6
)
where, n represents the length of the time series x
1
, x
n
;
x
i
and x
k
are the values for the years i and k,
respectively.
A positive (negative) of Z value indicates that the
test time series has an upward (downward) monotone
trend. Z is a test statistic that is used to determine the
significance of a trend. The null hypothesis, H
0
, is
tested using this test statistic. If, the expression has a
significance level, then it indicates that the null
hypothesis is invalid, i.e., the trend is significant.
Where α represents the significance level. Other
WRE 2021 - The International Conference on Water Resource and Environment
428
significance levels (e.g., 0.01 or 0.05) can usually be
used, but most previous studies set the significance
level at 0.05 before collecting the data (Wang et al.,
2020; Ahmad et al., 2015). In the following analyses,
a significance level of 0.05 with a Z
0.025
=1.96 has
been fixed for the corresponding tests.
3.2.2 Drought Analysis
Mckee (McKee et al., 1993; Shukla et al., 2008)
developed the SPI in 1993 to quantify the precipitation
deficit over multiple time scales. On time scales less
than a year, precipitation does not follow a normal
distribution. As a result, the variable is changed to give
the SPI has a Gaussian distribution. The following
expressions are used to calculate this index.
𝑆𝑃𝐼
=+𝑡−
𝑐
+𝑐
∗𝑡+𝑐
∗𝑡
1+𝑑
∗𝑡+𝑑
∗𝑡
+𝑑
∗𝑡
(7)
𝑡=
𝑙𝑛
1
𝐻(𝑃)
(8)
𝑓
𝑜𝑟 0<𝐻
(
𝑃
)
<0.5
𝑆𝑃𝐼
=−𝑡−
𝑐
+𝑐
∗𝑡+𝑐
∗𝑡
1+𝑑
∗𝑡+𝑑
∗𝑡
+𝑑
∗𝑡
(9)
𝑡=𝑙𝑛
1
1 − 𝐻
(
𝑃
)
(10)
𝑓
𝑜𝑟 0.5<𝐻
(
𝑃
)
<1
Where P denotes the total precipitation that
happend in the given time-scale, H(P) denotes the
cumulative probability of the observed precipitation
during this period, while c
,c
,c
,d
,d
,d
are
mathematical constants.
The interpretation of the SPI's
possible values is depicted in Table 1.
Table 1: Period classification based on the values of the
standardized precipitation index (SPI).
SPI Description
≥ 2.0 Extremely wet
(1.5, 2.0] Very wet
(1.0, 1.5] Moderately wet
(−1.0, 1.0] Near normal
(−1.5, −1.0] Moderately dry
(-2.0, -1.5] Severely dry
≤ -2.0 Extremely dry
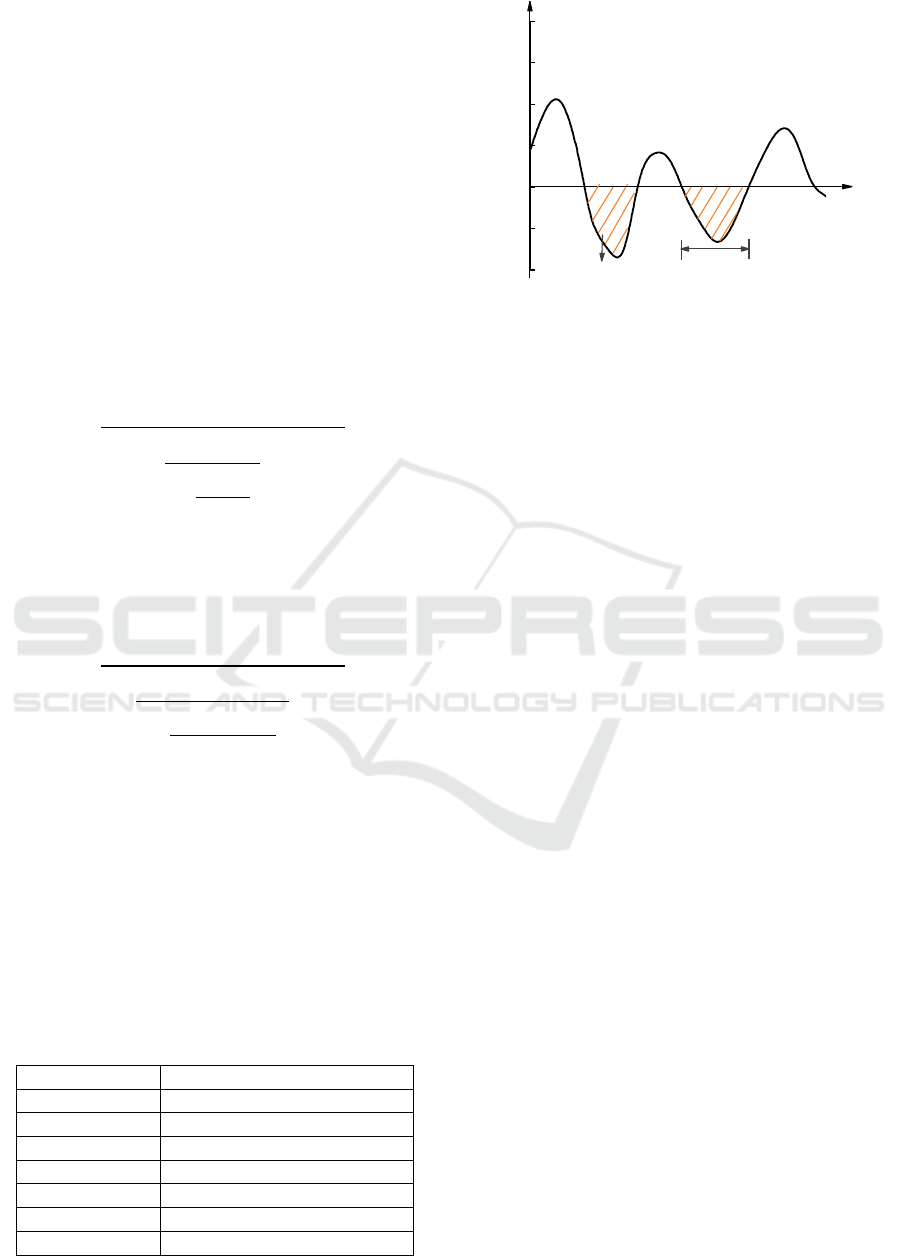
Figure 3: Diagram of the run theory, where Dd was defined
as the number of months in order with SRI values less than
the threshold x
0
, and Ds was the sum of the absolute values
of all SRIs during the drought. (
Guttman, 1999).
As noted previously, the SPI is intended to assess
the precipitation deficit for multiple timescales,
which can effectively measure the regional drought
conditions. Meteorological and soil moisture
conditions (agriculture) respond to anomalies in
precipitation on relatively short time scales (1-6
months), while water bodies such as streams and
reservoirs respond to precipitation anomalies on
longer time scales.
SPI on 1-month scale (SPI-1): the SPI values at
the 1-month scale map can show the percentage of
normal precipitation over a 30-day period. It is
relatively short in duration, but can more clearly
reflect the subtle changes of drought than other time
scales.
SPI on 3-month scale (SPI-3): SPI-3 is calculated
by counting precipitation over a three-month period,
which primarily reflects short- and medium-term
moisture conditions and assesses precipitation's
seasonal status. At the same time ,it also is the most
commonly used of several time scales and can
accurately reflect seasonal variations in drought.
SPI on 6-month scale (SPI-6): SPI-6 represents
the precipitation trend over the medium term. It can
be very useful in displaying precipitation over time.
SPI-6 drought information can also be expressed on a
stream or reservoir level, depending on geological
conditions and the timing of unusual precipitation in
the area.
SPI on 12-month or 24-month scale (SPI-12 or
SPI-24): These long-term precipitation patterns are
reflected in these time-scale SPIs. These time-scale
SPIs are also linked to stream and reservoir levels, as
well as longer-term groundwater levels.
-3
Ds
-2
0
3
1
2
x
0
Dd
Drought events
SPI
Drought Analysis and the Characteristics of Hydro-meteorological Changes in the Jinsha River Basin
429
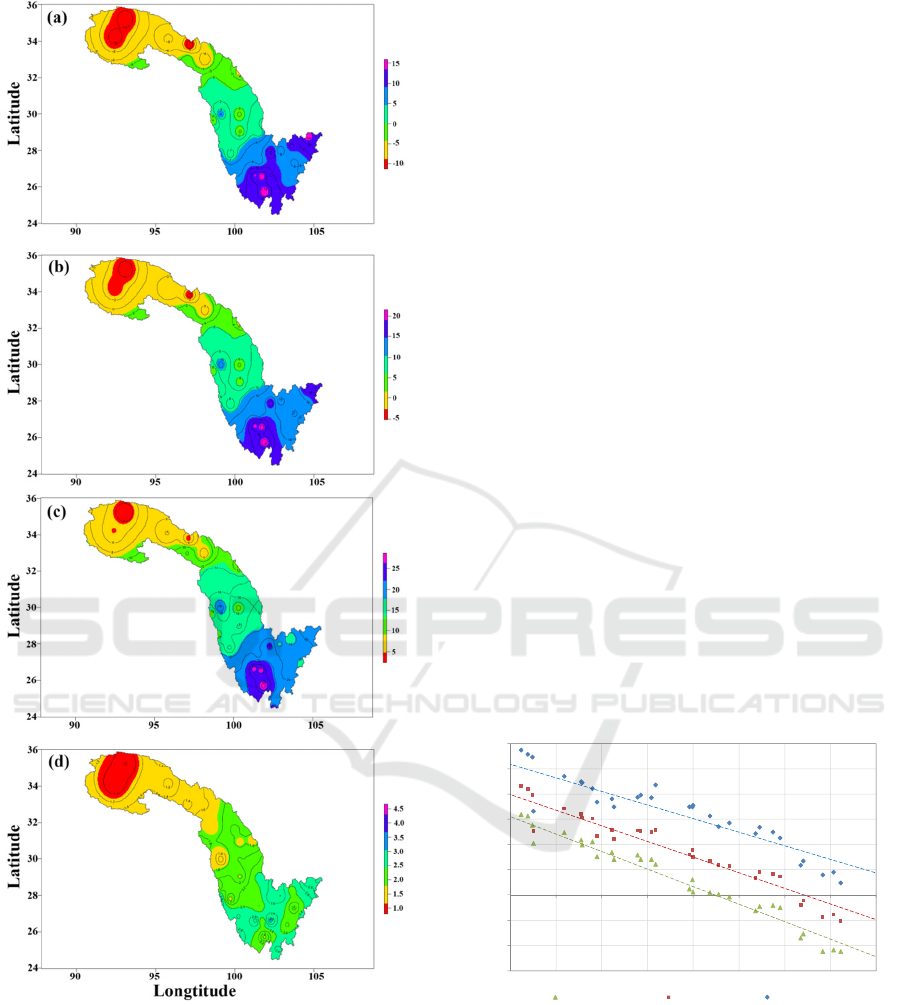
Figure 4: Spatial distribution of the average of (a) daily
minimum temperature, (b) mean temperature, (c) maximum
temperature and (d) precipitation in the JRB over the period
1951-2014.
In this paper, the SPI-6 values are used to define
drought occurrence. According to run theory (Figure
3) (Zelenhasić & Salvai, 1987), three drought
characteristic indicators exist: drought duration (Dd),
drought severity (Ds), and drought intensity (Di).
Previous studies used a threshold value of -0.5
(McKee et al., 1993; Wu et al., 2019) or -1.0 (Kwak
et al., 2016) to statistics drought events. The threshold
value in this paper was set at -1.0.
4 RESULTS AND DISCUSSION
4.1 Basic Statistical Analysis of
Hydro-meteorological Series
The statistical analysis of the daily minimum
temperature, mean temperature, maximum
temperature and precipitation time series has been
performed on the basis of the 34 meteorological
stations data within the JRB. As shown in Figure 4,
the three temperature types and daily precipitation of
the JRB all show a phenomenon of increasing from
the upper to lower reaches. The average daily
temperature in the Yangtze River source region is
below 0 °C all year, with a maximum temperature of
no more than 10 °C. The Yunnan administrative
region of JRB has the highest average daily
temperature, with temperatures reaching 15 °C or
higher. In Figure 5, the graphical relationship
between the elevation of each meteorological station
and the values of the daily minimum, mean and
maximum temperature series is presented, and a
linear regression has been established between those
variables. According to the high values of the
coefficient R
2
, which are all greater than 0.8, the fit of
the models can be considered suitable.
Figure 5: Relation between the daily minimum, mean and
maximum temperatures and elevation of the 34
meteorological station.
4.2 Trends Analysis of
Hydro-meteorological Series
The annual values of hydro-meteorological elements
were first extracted for each station, and then the M-
K test was performed (Figure 6). The results show
y = -0.0069x + 22.45
R² = 0.953
y = -0.0062x + 26.031
R² = 0.9115
y = -0.0054x + 31.26
R² = 0.8144
-15
-10
-5
0
5
10
15
20
25
30
100015002000250030003500400045005000
Expected temperature, T (°C)
Elevation, Z (m a.s.l.)
Minimum T Mean T Maximum T
WRE 2021 - The International Conference on Water Resource and Environment
430
that the mean temperature of 42 out of 45 stations has
an increasing trend, with 37 stations exhibiting a
significant increase. Meanwhile, for precipitation, 25
stations, which are mainly found in the mid- and
upper regions, have an upward trend, while 20
downstream stations have a downward trend, where
only 8 of them are significant. For runoff, all five
hydrologic stations have an increasing trend, but only
Huatan station is significant.
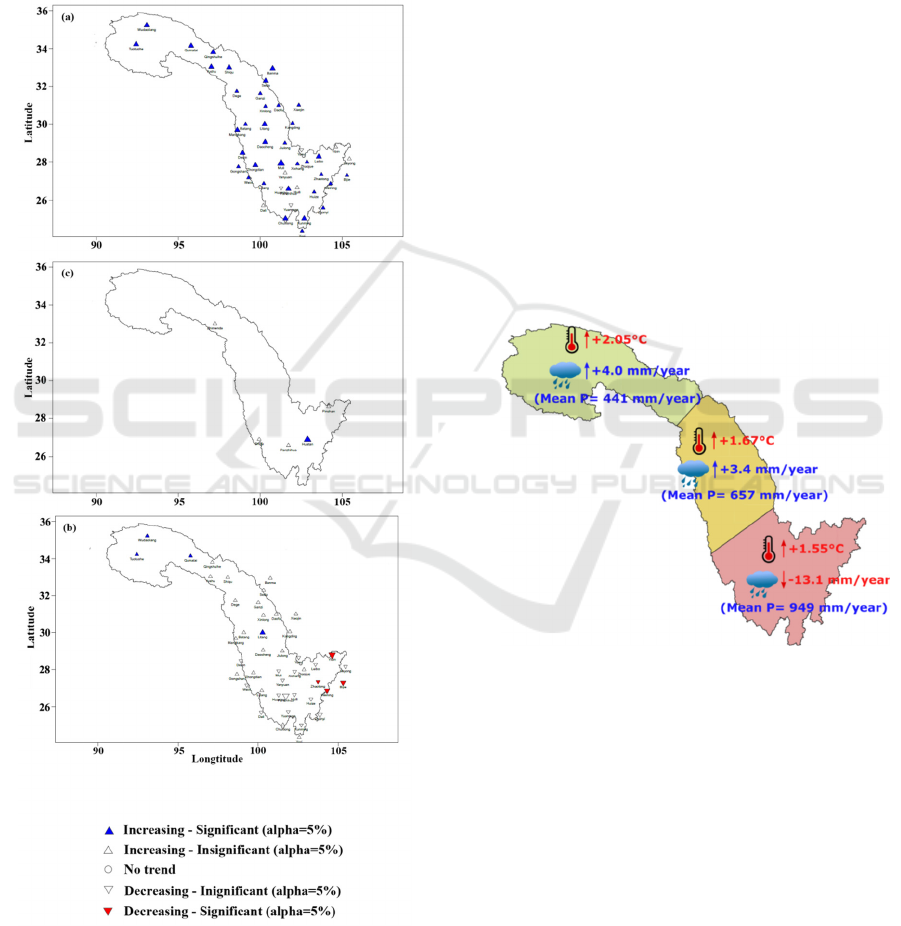
Figure 6: Trend results in daily (a) mean temperature, (b)
precipitation and (c) runoff from 1951 to 2014 using the
Mann-Kendall test and with a significance level of 5%, the
size of the triangles is proportional to the slope of the
detected trend.
The increasing(decreasing) trend of temperature
or precipitation detected in each part of the basin
(upper, middle and lower) over the 64 years of the
analysis period are also represented in Figure 7 (only
significant trends have been taken into account). The
average volume of annual precipitation is presented
as well. The temperature and precipitation in the
upper reaches are the areas with the greatest increase
in the JRB, while the precipitation in the lower
reaches is the only one that is on a downward trend.
4.3 Drought Analysis
The SPI-6 is calculated for 45 stations within the JRB,
and then according to these values to assess the
drought event and the drought characteristics. The
spatial distribution of drought characteristics based
on SPI-6 values in December 2011 is illustrated in
Figure 8, which the Figure 8b is obtained by spatial
interpolation on the basis of Figure 8a. From this, it is
clear that the downstream of JRB, where is located in
the provinces of Sichuan and Yunnan, is the region
with the most severe drought in December 2011.
Figure 7: The increasing (or decreasing) trend of the
temperature and precipitation over the entire period (1951-
2014) in the upper (green), middle (yellow) and lower
(pink) parts of JRB.
Several studies (Xu et al., 2015
b
; Zhang et al.,
2012; Li et al., 2011) have concluded that the
southwestern region of China, as well as the mid- and
upper streams of the Changjiang River (including the
lower Jinsha River), are the most frequent drought
hazard regions in China, causing enormous losses to
the ecology and agricultural economy each year. For
example, Yunnan was hit by a once-in-a-century
drought in 2010, and western Guizhou and
northwestern Guangxi have reached mega-drought
status, with over 200,000 rural residents facing water
shortages (Zhang et al., 2012; Li et al., 2011).
Drought Analysis and the Characteristics of Hydro-meteorological Changes in the Jinsha River Basin
431
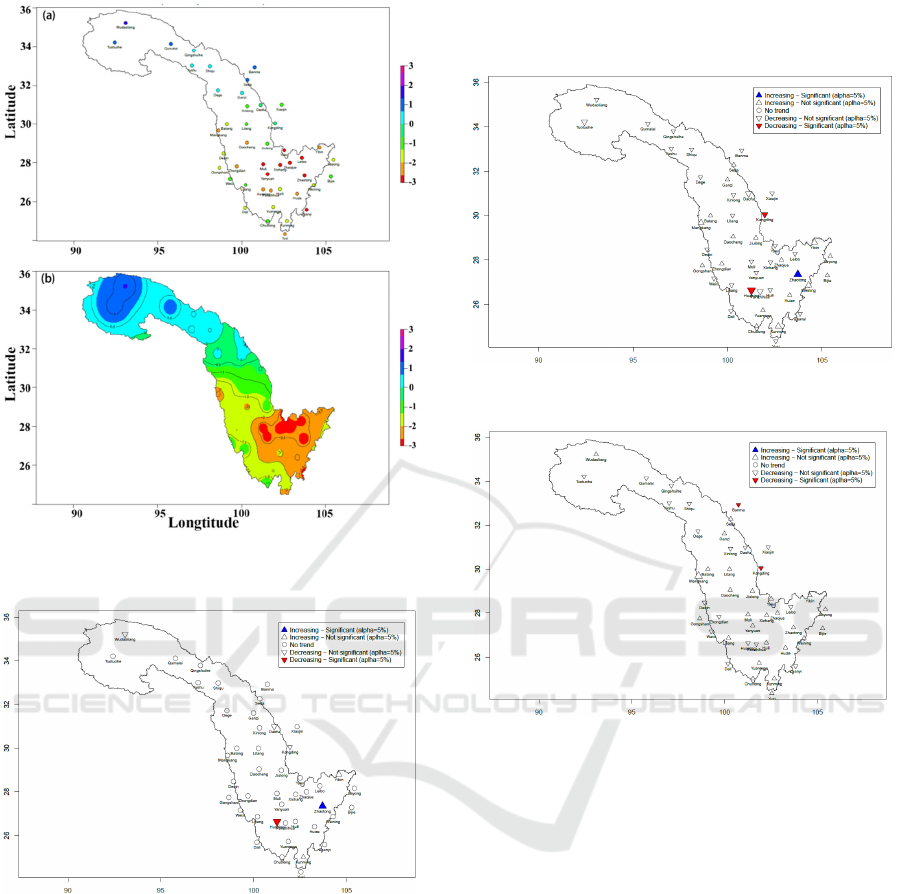
Figure 8: The spatial distribution of drought characteristics
of the JRB based on SPI-6 values in December 2011.
Figure 9: Trends in the drought duration based on SPI-6
using Mann-Kendall test with a 5% significance level.
Figures 9 to 11 show the trends of the drought
characteristics (drought duration, drought magnitude
and drought intensity) at 45 meteorological stations
within and near the JRB based SPI-6 values using M-
K test. There is no visible trend in drought duration at
38 of 45 stations, 4 with a decreasing trend and 1 with
an increasing trend. The drought magnitude analysis
is dominated by a decreasing trend, with 27 of the 45
stations showing a decreasing trend, but only 2 are
significant. The drought intensity analysis, on the
other hand, is dominated by an increasing trend, with
26 out of 45 stations in a increasing trend, while the
middle and lower regions of the JRB is more visible.
Figure 10: Trends in the drought magnitude based on SPI-
6 using Mann-Kendall test with a 5% significance level.
Figure 11. Trends in the drought intensities based on SPI-6
using Mann-Kendall test with a significance level of 5%.
5 CONCLUSIONS
Based on the multi-year data series of meteorological
and hydrologic stations within and around the basin,
the temporal-spatial variations of hydro-
meteorological elements in the JRB were analyzed,
and the basin drought characteristics were also
assessed using SPI-6 values. The following
conclusions are drawn:
The three temperature types (minimum, mean and
maximum) and daily precipitation of the JRB all
show a increasing from the upper to lower reaches.
The relationship between temperature and station
elevation is significantly negative linear, and the
coefficient of determination R
2
is greater more than
0.8.
The M-K test of annual values of mean
temperature, precipitation, and runoff reveals that the
WRE 2021 - The International Conference on Water Resource and Environment
432

mean temperature of 42 of 45 stations is rising, while
precipitation is rising at 25 of them.The runoff at all
five hydrologic stations is increasing. The
temperature and precipitation in the upper reaches are
the areas with the greatest increase in the JRB, while
the precipitation in the lower reaches is the only one
that is on a downward trend.
In the drought analysis based on SPI-6, the
downstream of JRB, where is sited in the provinces
of Sichuan and Yunnan, is the region with the most
severe drought in December 2011. There is no
significant trend in drought duration at 38 of 45
stations, and the drought magnitude analysis is
dominated by a decreasing trend. There is, however,
a statistically significant increase trend of drought
intensity the middle and lower reaches.
ACKNOWLEDGEMENTS
This study was supported by [National Natural
Science Foundation of China] under the grant number
[41890824] and [National Public Research Institutes
for Basic R&D Operating Expenses Special Project]
under the grant number [CKSF2019433/SZ].
REFERENCES
Ahmad, I., Tang, D., Wang, T., Wang, M., & Wagan, B.
(2015). Precipitation Trends over Time Using Mann-
Kendall and Spearman’s rho Tests in Swat River Basin,
Pakistan. Advances in Meteorology, 2015, 1-15.
Bjerklie, D. M. (2007). Estimating the bankfull velocity and
discharge for rivers using remotely sensed river
morphology information. Journal of Hydrology, 341,
144-155.
Guttman, N. B. (1999). Accepting the Standardized
Precipitation Index: A calculation algorithm. Journal of
the American Water Resources Association, 35, 311-
322.
He, J., Yang, K., Tang, W., Lu, H., Qin, J., Chen, Y., & Li,
X. (2020). The first high-resolution meteorological
forcing dataset for land process studies over China.
Scientific Data, 7, 25.
Hirsch, R. M., Slack, J. R., & Smith, R. A. (1982).
Techniques of trend analysis for monthly water quality
data. Water Resources Research, 18, 107-121.
Keyantash, J., & Dracup, J. A. (2002). The quantification
of drought: An evaluation of drought indices. Bulletin
of the American Meteorological Society, 83, 1167-
1180.
Kendall, M. G. (1975). Rank Correlation Methods. (UK:
London)
Kwak, J., Kim, S., Jung, J., Singh, V.P., Lee, D.R., & Kim,
H.S. (2016). Assessment of meteorological drought in
Korea under climate change. Advances in Meteorology,
2016, 1-13.
Leng, G., Tang, Q., & Rayburg, S. (2015). Climate change
impacts on meteorological, agricultural, and
hydrological droughts in China. Global Planet. Change.
126, 23-34.
Li, Y., Xu, H., & Liu, D. (2011). Features of the extremely
severe drought in the east of Southwest China and
anomalies of atmospheric circulation in summer 2006.
Acta Meteorologica Sinica, 25, 176-187.
Mishra, A. K., & Singh, V. P. (2010). A review of drought
concepts. Journal of Hydrology, 391, 202-216.
McLeod, A. I., Hipel, K. W., & Bodo, B. A. (1990). Trend
analysis methodology for water quality time series.
Environmetrics, 2, 169-200.
McKee, T. B., Doesken, N. J., & Kieist, J. (1993). The
relationship of drought frequency and duration to time
scales. Eighth Conference on Applied Climatology.
Anaheim, California, 1993, 17-22.
Schubert, S. D., Stewart, R. E., Wang, H., Barlow, M.,
Berbery, E. H., Cai, W., Hoerling, M. P., Kanikicharla,
K. K., Koster, R. D., & Lyon, B. et al. (2016). Global
meteorological drought: A synthesis of current
understanding with a focus on SST Drivers of
precipitation deficits. Journal of Climate, 29, 3989-
4019.
Shukla, S., & Wood, A. W. (2008). Use of a standardized
runoff index for characterizing hydrologic drought.
Geophysical Research Letters, 35(2), L02405.
van Loon, A. F., Ploum, S. W., Parajka, J., Fleig, A. K.,
Garnier, E., Laaha, G., & Van Lanen, H. A. J. (2015).
Hydrological drought types in cold climates:
quantitative analysis of causing factors and qualitative
survey of impacts. Hydrology and Earth System
Sciences, 19, 1993-2016.
Van Hateren, T. C., Chini, M., Matgen, P., & Teuling, A. J.
(2020). Ambiguous agricultural drought: characterising
soil moisture and vegetation droughts in Europe from
earth observation. Hydrology and Earth System
Sciences, 13(10), 1990.
van Loon, A. F. (2015). Hydrological drought explained.
Wiley interdisciplinary reviews. Water, 2, 359-92.
Wang, S., Zhang, X., Liu, Z., & Wang, D. (2013). Trend
Analysis of Precipitation in the Jinsha River Basin in
China. Journal of Hydrometeorology, 14, 290-303.
Wang, W., Ertsen, M. W., Svoboda, M. D., & Hafeez, M.
(2016). Propagation of Drought: From Meteorological
Drought to Agricultural and Hydrological Drought.
Advances in Meteorology, 2016, 1-5.
Wang, F., Shao, W., Yu, H., Kan, G., He, X., Zhang, D.,
Ren, M., & Wang, G. (2020). Re-evaluation of the
Power of the Mann-Kendall Test for Detecting
Monotonic Trends in Hydrometeorological Time
Series. Frontiers in Earth Science, 8, 1-12.
Wu, R. N., Zhang, J. Q., Bao, Y. H., & Guo, E. L. (2019).
Run theory and Copula-based drought risk analysis for
Songnen Grassland in northeastern China.
Sustainability, 11, 6032.
Drought Analysis and the Characteristics of Hydro-meteorological Changes in the Jinsha River Basin
433

Welford, M., Hollinger, S., & Isard, S. (1993). A new soil
moisture drought index for predicting crop yields.
Eighth Conference on Applied Climatology, 187-90.
Xu, K., Yang, D., Yang, H., Li, Z., Qin, Y., & Shen, Y.
(2015a). Spatio-temporal variation of drought in China
during 1961–2012: A climatic perspective. Journal of
Hydrology, 526, 253-64.
Xu, K., Yang, D., Xu, X., & Lei, H. (2015b). Copula based
drought frequency analysis considering the spatio-
temporal variability in Southwest China. Journal of
Hydrology, 527, 630-40.
Xiang, Y., Wang, Y., Chen, Y., Bai, Y., Zhang, L., &
Zhang, Q. (2020). Hydrological drought risk
assessment using a multidimensional Copula function
approach in arid inland basins, China. Water-Sui, 12,
1888.
Yu, M., Li, Q., Hayes, M. J., Svoboda, M. D., & Heim, R.
R. (2014). Are droughts becoming more frequent or
severe in China based on the Standardized Precipitation
Evapotranspiration Index: 1951–2010. International
Journal of Climatology, 34, 545-58.
Yue, S., Pilon, P., Phinney, B., & Cavadias, G. (2002). The
influence of autocorrelation on the ability to detect
trend in hydrological series. Hydrological Processes,
16, 1807-29.
Zelenhasić, E., & Salvai, A. (1987). A method of
streamflow drought analysis. Water Resources
Reacher, 1, 156.
Zhai, J., Su, B., Krysanova, V., Vetter, T., Gao, C., & Jiang,
T. (2010). Spatial variation and trends in PDSI and SPI
indices and their relation to streamflow in 10 large
regions of China. Journal of Climate, 23, 649-63.
Zhang, J., Jiang, L., Feng, Z., & Li, P. (2012). Detecting
effects of the recent drought on vegetation in
southwestern China. Journal of Resources and
Ecology, 3, 43-9.
WRE 2021 - The International Conference on Water Resource and Environment
434
