
Study on Influencing Factors of Flushing Time of Puyang River in the
Upper Tributary of Qiantang River
Hongqing Zhang
1, 2,*
, Yilong Lou
3
and Zhen Wang
4
1
Zhejiang Institute of Hydraulics & Estuary, Hangzhou 310020, China
2
Zhejiang Institute of Marine Planning and Design, Hangzhou 310020, China
3
Quzhou water resources and soil and water conservation management center, Quzhou 324000, China
4
College of Harbor, Coastal and Offshore Engineering, Hohai University, Nanjing 210098, China
Keywords: Tidal river, Flushing time, Influencing factors, Hydrodynamic model
Abstract: Aiming at the prevention and control of the water environment of the Puyang River in the upper reaches of
the Qiantang River, two-dimensional hydrodynamic model was established to study the influence factors of
flushing time of Puyang River in the upper tributary of Qiantang River. The goal is to provide a new way to
solve the problem of river water quality. The research results show that under the action of different
influencing factors, the flushing time of the Xijiang and Dongjiang has a gradual increase trend from upstream
to downstream. However, due to the supporting effect of the Fuchun River flow on the Puyang River outlet,
the flushing time of area below Meichi increased first and then decreased from the upstream to the downstream.
At the same time, the influence of discharge of Fuchun River on the flushing time roughly extends to the
middle and lower reaches of the Xijiang and Dongjiang River. The discharge of Fengqiao River has little
effect on the flushing time in the Xijiang River and area below Meichi, and the influence of the discharge of
Fengqiao River on the flushing time of the Dongjiang River Basin is roughly 18km~25km away from the
entrance of the Dongjiang River. The influence of the discharge of tidal intensity of Qiantang River on the
flushing time of the area below Meichi is within 5km of downstream exit. The initial water level and the
discharge of the Puyang River are the main factors affecting the flushing time of the river basin, and the
discharges of the Fuchun River and the Fengqiao River also have a significant effect on the flushing time.The
research results can provide technical support for the prevention and control of the water environment of tidal
rivers.
1 INTRODUCTION
The Puyang River is a first-level tributary of the upper
reaches of the Qiantang River. The quality of the
water environment in the basin not only affects the
production and life of the people along the river, but
also affects the drinking water safety of millions of
people in the lower reaches of the Qiantang River.
With the rapid economic development, there are more
and more industrial enterprises around the Puyang
River, and industrial wastewater and domestic
sewage are directly discharged into the river. At the
same time, the Puyang River is a tidal channel, and its
water environment is affected by both upstream
runoff and the tidal effect of the Qiantang River,
resulting in complex water quality issues (Wu et al.,
2003). Although the Puyang River Basin has
continuously increased its pollution control efforts in
recent years, there are still water quality problems.
Since the end of the last century, the process of
material transport has become an important issue in
the water environment system. When the polluted
water body is exchanged with a clean water body, the
pollutant is diluted, its concentration is reduced, and
the water quality of the water body is improved.
Therefore, many scholars express the exchange
capacity of water bodies inside and outside the system
through the transmission time scale (Takeoka, 1984;
Monsen et al, 2002; Sandery & Kämp, 2007). Among
them, flushing time is a kind of transmission time
scale. Dilute time can explore the law of material
transport between the system and the external
environment and the characteristics of the material
exchange within the system itself (Takeoka, 1984;
Monsen et al, 2002). In recent years, scholars have
Zhang, H., Lou, Y. and Wang, Z.
Study on Influencing Factors of Flushing Time of Puyang River in the Upper Tributary of Qiantang River.
In Proceedings of the 7th International Conference on Water Resource and Environment (WRE 2021), pages 419-425
ISBN: 978-989-758-560-9; ISSN: 1755-1315
Copyright
c
2022 by SCITEPRESS – Science and Technology Publications, Lda. All rights reserved
419
carried out a series of studies on the water
environment using flushing time (Ding et al., 2003;
Wang et al., 2004; Wan, 2009; Zhu, 2011) including
using the flushing time to study the migration of
pollutants in the estuary and assess the quality of the
water environment. Therefore, carrying out relevant
research on the flushing time of tidal rivers can
provide guidance for the harmonious development of
water conservancy projects and the water ecological
environment of the river basin, the establishment of a
long-term mechanism for river water environment
improvement, and the management of sewage
discharge along the river.
This paper takes Puyang River as the research
object and establishes a two-dimensional
hydrodynamic model to study the influence factors of
flushing time of Puyang River in the upper tributary
of Qiantang River, such as discharge of Puyang River
, discharge of Fuchun River , discharge of Fengqiao
River , tidal intensity of Qiantang River , and initial
water level . The research results provide guidance for
the prevention and control of water environment in
tidal rivers.
2 METHODS
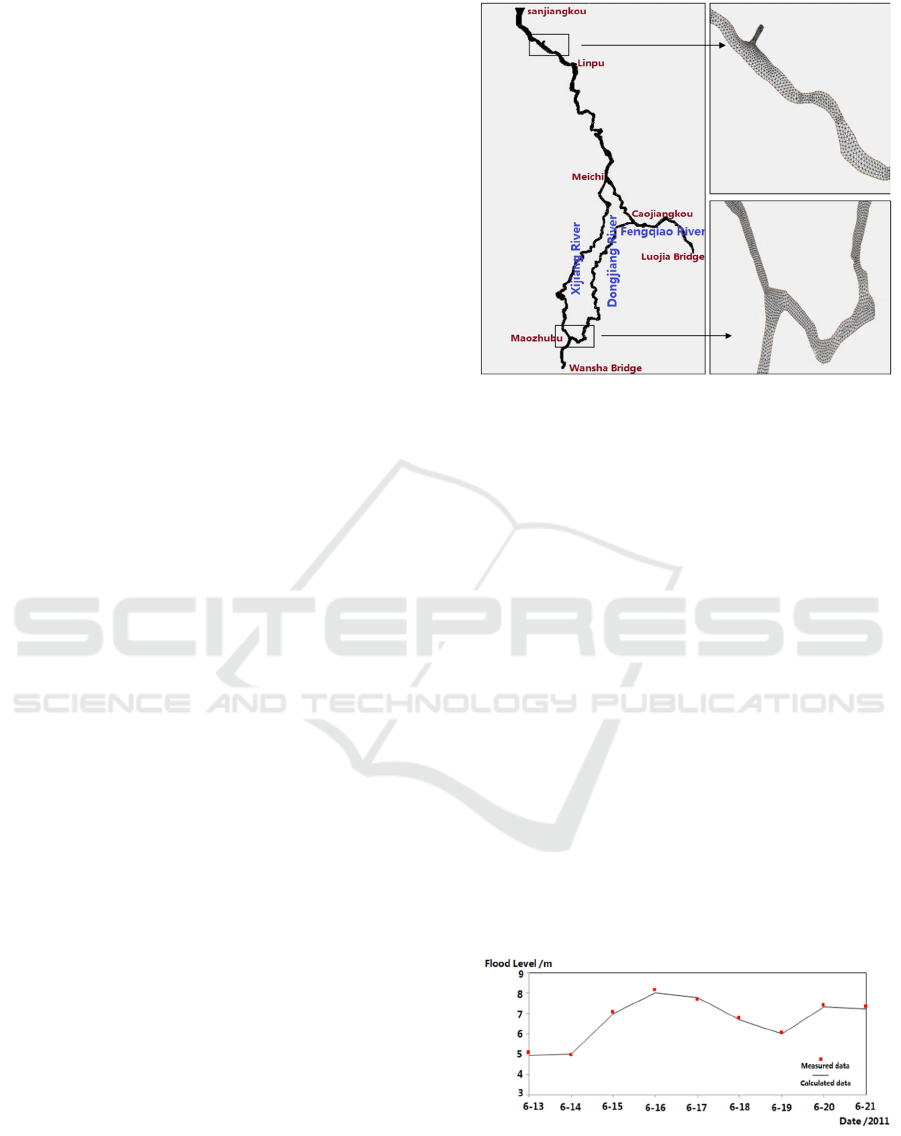
2.1 Model Establishment
In this paper, the two-dimensional hydrodynamic
model of Puyang River Basin is constructed by using
mike21hydrodynamic module developed by DHI.
Maps of study area and model grid are shown in
Figure 1. The research objects in the Zhuji section of
the Puyang River are divided into Xijiang River,
Dongjiang River and area below Meichi. Among
them, from Wansha Brige to Caojiangkou to Meichi
is called Dongjiang River. And Fengqiao River is the
main tributary of Puyang River, which meet at
Caojiangkou.
The entrance boundary of the mathematical model
is located inWansha Bridge of Puyang River and
Luojia Bridge of Fengqiao River. The exit boundary
islocated in Sanjiangkou. Among them,Puyang Jiang-
WanSha Bridge and Fengqiaojiang-Luojia Bridge are
the flow import boundary, and the measured flow data
of Zhuji Station and Fengqiao Station were adopted
respectively. Sanjiangkou is the water level
boundary, and the exit water level is calculated based
on the one-dimensional model of the Qiantang River
by coupling the flow of the Fuchun River and the tidal
intensity of the Qiantang River.
Figure 1: Map of study area and model grid.
2.2 Model Verification
The flood level verification was carried out on the
model using the measured data of each boundary
during the flood period from June 13 to June 21,
2011. During the model debugging process, the
Manning coefficient has a certain influence on the
model. Default value (0.020 m1/3/s.), the relative
error interval between the calculated water level and
the measured water level is -7.2%-10.2%. The final
debug value of the manning coefficient in the model
is 0.035 m1/3/s, and the verification results of Linpu,
Meichi and Zhuji along the Puyang River are shown
in Figures 3-5. It can be seen from the Figures 2-4
that: (1) The relative error interval between the
calculated water level and the measured water level is
-1.2%-3.2%, the highest flood level error is controlled
within 4cm; (2) The calculated and measured flood
level process changes are basically the same. The
model’s rate parameter is basically reasonable and
can be used for the analysis and study of the
distribution of the flushing time of Puyang River.
Figure 2: Comparison of measured and calculated data of
Linpu station.
WRE 2021 - The International Conference on Water Resource and Environment
420
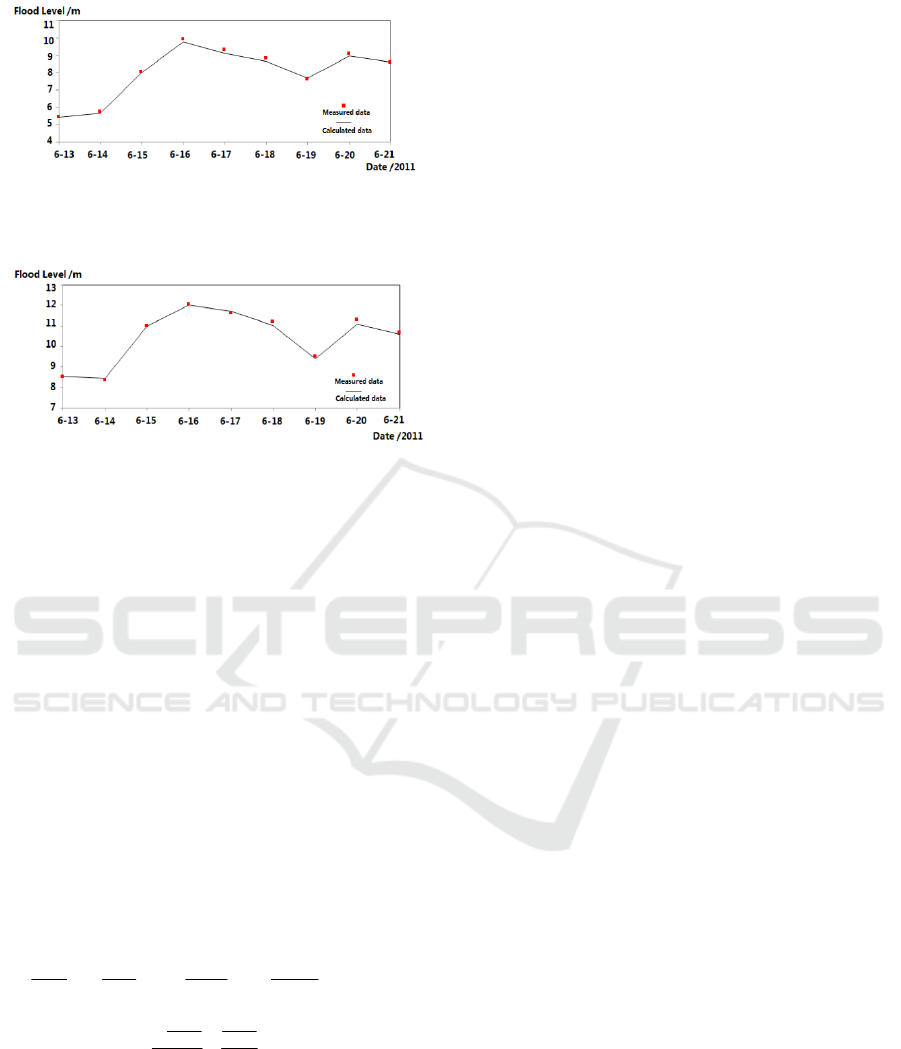
Figure 3: Comparison of measured and calculated data of
Meichi station.
Figure 4:
Comparison of measured and calculated data of
Zhuji station.
2.3 Calculation Method of Flushing
Time in the Model
Based on two-dimensional hydrodynamic model, the
tracer is selected as the substance in the Puyang
River, and the initial value of the tracer mass
concentration is set to 1 kg/m
3
, and the inlet and outlet
boundary water bodies are assumed to be clear water,
that is, the mass concentration of the tracer is 0. After
setting the boundary conditions in the hydrodynamic
model, the conservative tracer in the Puyang River
gradually diffuses under the action of hydrodynamics,
and the change function of regional material quality
with time is obtained, see formula (1) for details.
Then, substituting formula (1) into the flushing time
definition expression, get the formula for calculating
the water dilution time, see formula (2) for details.
This section must be in one column.
1
33
22
3
12 2 1 3
() ()
1+ ( )
'-
t
Mt CtV
ee Ct
MCV
ββ
β
β
ββ β β
−
⋅
==
−⋅
2
-t
(
) +=
(1)
22
12 12
21
1
t
F
β
β
β
βββ
ββ
+
−−
=−
(2)
In the formula: M
3
(t) and C
3
(t) are the function of
the tracer mass and mass concentration in the Puyang
River, respectively; β
1
and β
2
are the exponential
terms in the tracer concentration curve according to
the double exponential law; V is the volume of water
at any point in the Puyang River; M' is the initial
amount of dissolved substances.
This article takes 16 equidistant calculation points
along the central line of the main channel in the
Xijiang River, the Dongjiang River and area below
Meichi. According to the aforementioned calculation
method, calculate the flushing time of each
calculation point, and then discuss the distribution
characteristics of the flushing time of the main
channel in each region under the different factors.
2.4 Boundary Condition
The simulation conditions of this paper are based on
the daily average flow of Zhuji Hydrological Station,
the daily average discharge flow of Fuchun River, the
daily average flow of Fengqiao River Hydrological
Station, the daily average tidal range of Wenyan
Station, and the daily average water depth of Zhuji
Hydrological Station from 1991 to 2012. The range is
determined, namely discharge of Puyang River
condition, discharge of Fuchun River condition,
discharge of Fengqiao River condition, tidal intensity
of Qiantang River condition and initial water level
conditions. Among them, the simulation of each
factor includes 5 groups, and the other factors in each
group are unchanged, which are shown in Table 1
below.
3 RESULTS AND ANALYSIS
3.1 The Influence of Discharge of
Puyang River on the Flushing Time
The distribution of the flushing time under different
discharge of the Puyang River conditions are shown
Figure 5. It can be seen that the flushing time of the
Xijiang and Dongjiang has a gradual increase trend
from upstream to downstream. However, due to the
supporting effect of the Fuchun River flow on the
Puyang River outlet, the flushing time of area below
Meichi increased first and then decreased from the
upstream to the downstream. From the perspective of
the distribution curve spacing of the flushing time
under the different discharge of Puyang River
conditions, when the discharge of Puyang River
increases from 150 m
3
/s to 300 m
3
/s, The impact of
the Puyang River flow on the flushing time of the
Xijiang River, the middle and lower reaches of the
Dongjiang River and area below Meichi is more
significant than when the discharge of Puyang River
increases from 300m
3
/s to 750m
3
/s.In general, the
flushing time of the Xijiang River, Dongjiang River
and area below Meichi decreases with the increase of
discharge of Puyang River .
Study on Influencing Factors of Flushing Time of Puyang River in the Upper Tributary of Qiantang River
421
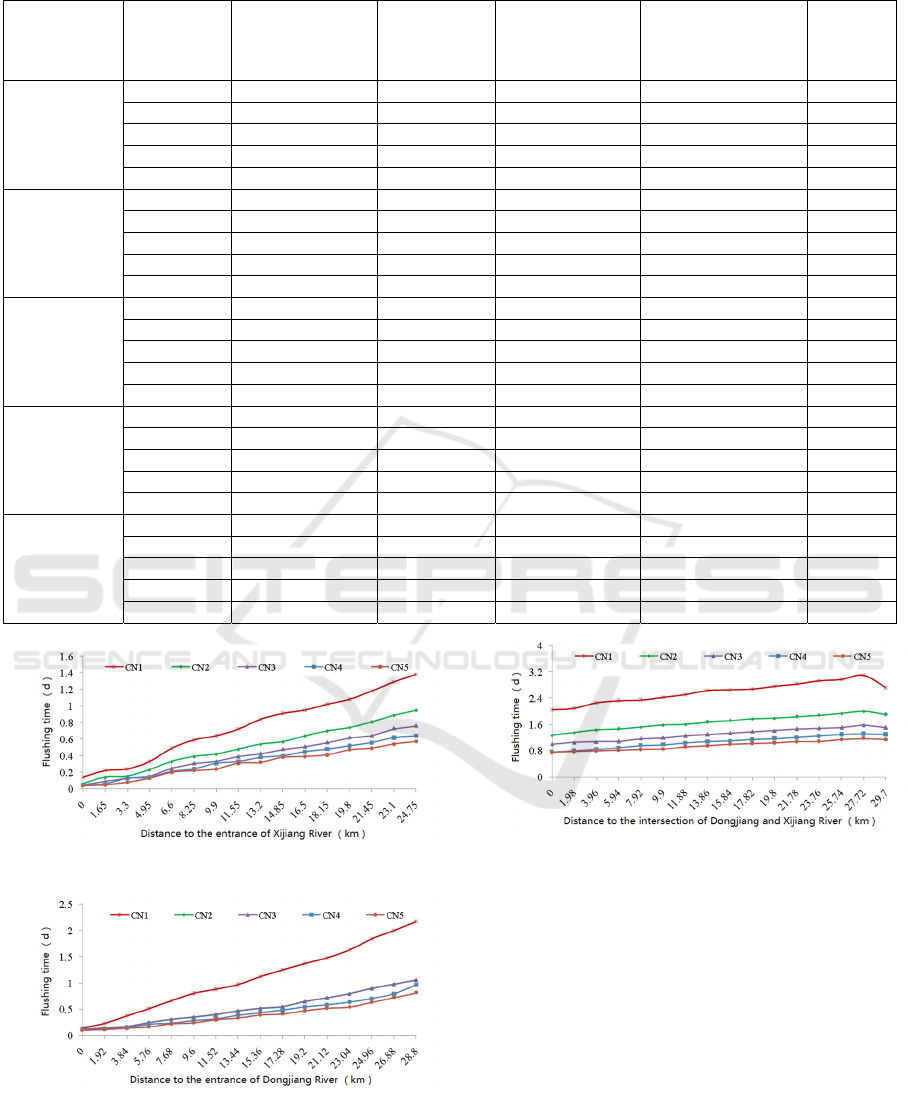
(1) Xijiang River
(2) Dongjiang River
(3) Area below Meichi
Figure 5: The distribution of the flushing time under
different discharge of the Puyang River conditions.
3.2 The Influence of Discharge of
Fuchun River on the Flushing Time
The distribution of the flushing time under different
discharge of the Fuchun River conditions are shown
Figure 6. It can be seen that the variation law of the
flushing time along the three regions is the same as
the aforementioned discharge of Puyang River factor.
In general, the flushing time of the Xijiang River,
Dongjiang River and area below Meichi increases
with the increase of discharge of Fuchun River.
Table 1: The simulation conditions.
Impact factor
Condition
No.
Discharge of
Puyang
River(m
3
/s)
Initial water
level (m)
Discharge of
Fuchun
River(m
3
/s)
Discharge of
Fengqiao
River(m
3
/s)
Tidal
range
(%)
Discharge of
Puyang
River
CN1 150 9.3 1600 15 50
CN2 300 9.3 1600 15 50
CN3 450 9.3 1600 15 50
CN4 600 9.3 1600 15 50
CN5 750 9.3 1600 15 50
Discharge of
Fuchun
River
CN6 300 8.8 1600 20 50
CN7 300 8.8 3200 20 50
CN8 300 8.8 4800 20 50
CN9 300 8.8 6400 20 50
CN10 300 8.8 8000 20 50
Discharge of
Fengqiao
River
CN11 150 7.35 1600 10 50
CN12 150 7.35 1600 20 50
CN13 150 7.35 1600 30 50
CN14 150 7.35 1600 40 50
CN15 150 7.35 1600 50 50
Qiantang
River tidal
intensity
CN16 300 8.8 4050 20 10
CN17 300 8.8 4050 20 30
CN18 300 8.8 4050 20 50
CN19 300 8.8 4050 20 70
CN20 300 8.8 4050 20 90
Initial water
level
CN21 300 7.3 1600 20 50
CN22 300 8.8 1600 20 50
CN23 300 10 1600 20 50
CN24 300 10.5 1600 20 50
CN25 300 11 1600 20 50
WRE 2021 - The International Conference on Water Resource and Environment
422
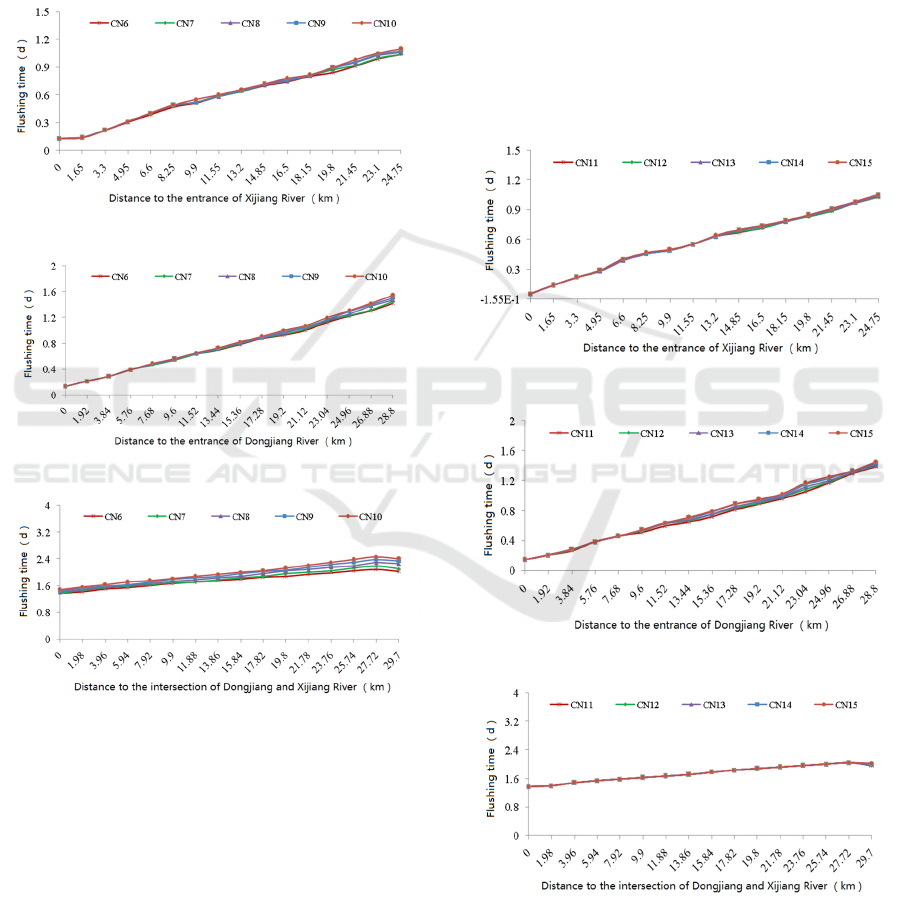
From the perspective of the distribution curve
spacing of the flushing time under the different
discharge of Fuchun River conditions, the influence
of discharge of Fuchun River on the flushing time
roughly extends to the middle and lower reaches of
the Xijiang and Dongjiang River. At the same time,
the discharge of Fuchun River has a smaller impact
on the flushing time of the Puyang River than the
discharge of Puyang River.
(1)Xijiang River
(2) Dongjiang River
(3) Area below Meichi
Figure 6: The distribution of the flushing time under
different discharge of the Fuchun River conditions.
3.3 The Influence of Discharge of
Fengqiao River on the Flushing
Time
The distribution of the flushing time under different
discharge of the Fengqiao River conditions are shown
Figure 7. It can be seen that the variation law of the
flushing time along the three regions is the same as
the aforementioned discharge of Puyang River factor,
also. In general, the flushing time of the Xijiang
River, Dongjiang River and area below Meichi
increases with the increase of discharge of Fengqiao
River.
From the perspective of the distribution curve
spacing of the flushing time under the different
discharge of Fengqiao River conditions, the
distribution curves of the flushing time along the
Xijiang River and area below Meichi under different
conditions basically coincide, that is, the discharge of
Fengqiao River has little effect on the flushing time
in these two regions. And the influence of the
discharge of Fengqiao River on the flushing time of
the Dongjiang River Basin is roughly 18km~25km
away from the entrance of the Dongjiang River.
(1)Xijiang River
(2) Dongjiang River
(3) Area below Meichi
Figure 7:
The distribution of the flushing time under
different discharge of the Fengqiao River conditions.
Study on Influencing Factors of Flushing Time of Puyang River in the Upper Tributary of Qiantang River
423
3.4 The Influence of Discharge of Tidal
Intensity of Qiantang River on the
Flushing Time
The distribution of the flushing time under different
tidal intensity of Qiantang River conditions are shown
Figure 8. It can be seen that the variation law of the
flushing time along the three regions is the same as
the aforementioned discharge of Puyang River factor,
also. In general, the flushing time of the Xijiang
River, Dongjiang River and area below Meichi
increases with the increase of discharge of tidal
intensity of Qiantang River.
(1) Xijiang River
(2) Dongjiang River
(3) Area below Meichi
Figure 8:
The distribution of the flushing time under
different tidal intensity of Qiantang River conditions
From the perspective of the distribution curve
spacing of the flushing time under the different tidal
intensity of Qiantang River conditions, the
distribution curves of the flushing time along the
Xijiang and Dongjiang River under different
conditions basically coincide, that is, the tidal
intensity of Qiantang River has little effect on the
flushing time in these two regions. And the influence
of the discharge of tidal intensity of Qiantang River
on the flushing time of the area below Meichi is
within 5km of downstream exit.
(1) Xijiang River
(2) Dongjiang River
(3) Area below Meichi
Figure 9:
The distribution of the flushing time under
different initial water level conditions.
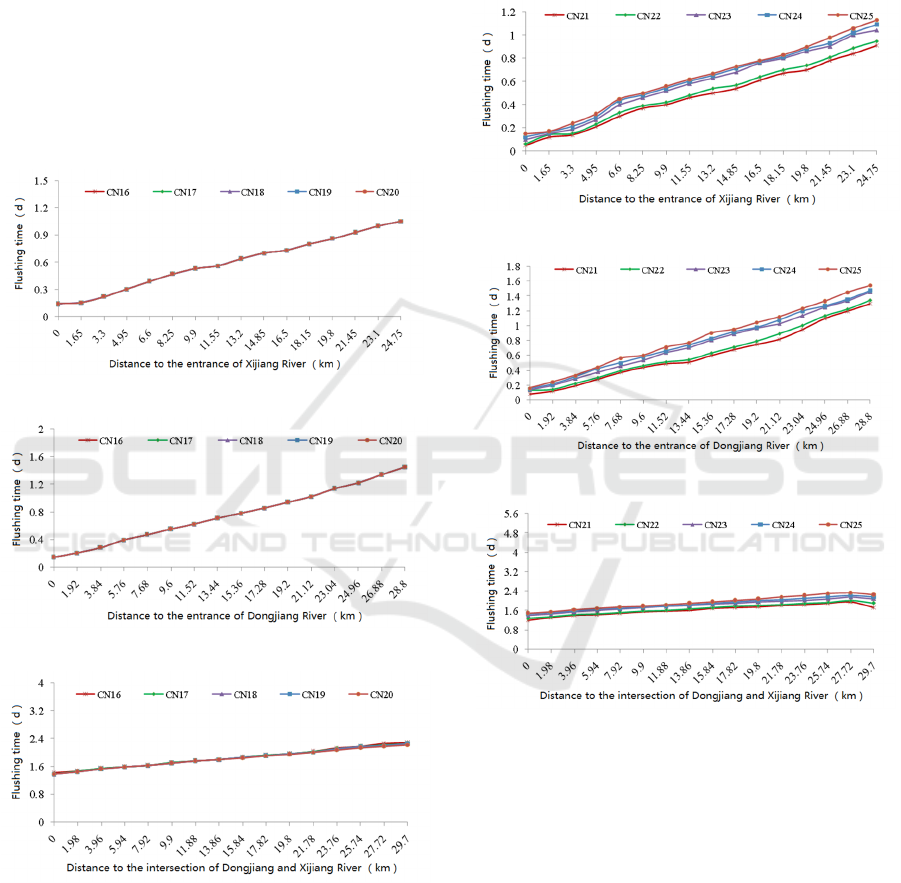
3.5 The Influence of Discharge of
Initial Water Level on the Flushing
Time
The distribution of the flushing time under different
initial water level conditions are shown Figure 9. It
can be seen that the variation law of the flushing time
along the three regions is the same as the
aforementioned discharge of Puyang River factor,
also. In general, the flushing time of the Xijiang
River, Dongjiang River and area below Meichi
increases with the increase of initial water level.
WRE 2021 - The International Conference on Water Resource and Environment
424

From the perspective of the distribution curve
spacing of the flushing time under the different initial
water level conditions, when the initial water level
increased from 7.3m to 8m, the impact of the flushing
time in the three regions was small; When the initial
water level increased from 8.8m to 10m, the impact
of the flushing time in the three regions increased
significantly. Among them, the Xijiang River and
Dongjiang River have a relatively large range of
changes, and area below Meichi is relatively small.
The reason is related to the topography of the cross-
section of the river bed in each region. The bottom
slopes of the Xijiang River and Dongjiang River are
steeper and the upper parts of the Xijiang River and
Dongjiang River are gentler, while the riverbed of
area below Meichi is wider, and the slope changes at
the bottom and upper part of both banks are smaller
than those of the Dongjiang River and Xijiang River.
When the initial water level increased from 10m to
10.5m and then increased to 11m, the flushing time
curves of the three regions also changed evenly.
4 CONCLUSIONS
This paper takes Puyang River as the research object
and establishes a two-dimensional hydrodynamic
model to study the influence factors of flushing time
of Puyang River in the upper tributary of Qiantang
River. The research results provide guidance for the
prevention and control of water environment in tidal
rivers,got the following conclusions:
(1) Under the action of different influencing
factors, the flushing time of the Xijiang and
Dongjiang has a gradual increase trend from upstream
to downstream. However, due to the supporting effect
of the Fuchun River flow on the Puyang River outlet,
the flushing time of area below Meichi increased first
and then decreased from the upstream to the
downstream. At the same time, the influence of
discharge of Fuchun River on the flushing time
roughly extends to the middle and lower reaches of
the Xijiang and Dongjiang River. The discharge of
Fengqiao River has little effect on the flushing time
in the Xijiang River and area below Meichi, and the
influence of the discharge of Fengqiao River on the
flushing time of the Dongjiang River Basin is roughly
18km~25km away from the entrance of the
Dongjiang River. The influence of the discharge of
tidal intensity of Qiantang River on the flushing time
of the area below Meichi is within 5km of
downstream exit.
(2) Except for the negative correlation between
the discharge of Puyang River and the flushing time
of Puyang River Basin, and between the discharge of
Fengqiao River and the flushing time of the Fengqiao
River, each factor has a positive correlation with the
flushing time of the Puyang River Basin.
(3) The initial water level and the discharge of the
Puyang River are the main factors affecting the
flushing time of the river basin, and the discharges of
the Fuchun River and the Fengqiao River also have a
significant effect on the flushing time.
The results of this research can provide the basis
for the prevention and control of the water
environment of tidal rivers, and also provide technical
support for the ecological regulation of tidal rivers.
ACKNOWLEDGEMENTS
This experiment was supported by the Dean's Fund of
Zhejiang Institute of Hydraulics & Estuary. Thank
you here.
REFERENCES
Ding, M. W., Huan, T. S., & Jian, R. Z., (2003). Flushing
time of the Yangtze estuary by discharge, a model
study. Journal of hydrodynamic, 15(3), 63-71.
Monsen, N. E., Cloern, J. E., Lucas, L. V., & Monismith, S.
G. (2002). A comment on the use of flushing time,
residence time and age as transport time scales.
Limnology& Oceanography, 47(5), 1545-1553.
Sandery, P. A., & Kämpf, J. (2007). Transport time scales
for identifying seasonal variation in Bass Strait, south-
eastern Australia. Estuarine Coastal and Shelf Science,
74, 684-696.
Takeoka, H. (1984). Fundamental concepts of exchange
and transport time scales in a coastal sea. Continental
Shelf Research, 3(3), 311-326.
Wan, Y. P. (2009). Determination of Hydrodynamic Time
of Deep Bay and Evaluation of Effect on Leading
Nutrient Reduction. Beijing, Tsinghua University.
Wang, C. F., Hsu, M. H., & Kuo, A. Y. (2004). Residence
time of the Danshuei River estuary, Taiwan. Estuarine,
Coastal and Shelf Science, 60(3), 381-393.
Wu, X. H., Chen, F., Jin, J. X., & Du, G. Y. (2003). 2003.
Analysis on Water Quality Change of Tidal River under
Tide Conditions. Water Resources and Hydropower
Express, 3, 18-19.
Zhu, B. (2011). Numerical Study on The Flushing Time in
Qiantang Estuary. Hangzhou: Zhejiang University.
Study on Influencing Factors of Flushing Time of Puyang River in the Upper Tributary of Qiantang River
425
