
Application of PSO_BP Neural Network Model based on Influence
Factor Correlation for Phreatic Water Depth Prediction
Xia Wei, Ni Wang
*
and Fangxu Peng
State Key Laboratory of Eco-hydraulics in Northwest Arid Region, Xi’an University of Technology, Xi’an, Shaanxi 710048,
China
Keywords: Particle swarm algorithm, BP neural network, Phreatic water depth, Prediction
Abstract: The lack of groundwater level data will lead to untimely water resources management and control. Using
groundwater phreatic depth influencing factors to predict the water level can provide a basis for the rational
use of water resources. This paper took Xianyang city as the study area, used correlation analysis to identify
the correlation between population, gross regional product, meteorological factors and phreatic water depth,
established PSO_BP neural network model to predict the phreatic water depth in Xianyang city according to
the correlation, and analyzed the prediction results and evaluates the applicability of the model. The results
show that the relative error of the PSO_BP neural network prediction model does not exceed 2.5%, the
minimum error is 1.65%, and has the same changing trend as the measured value, which indicates that the
prediction model has high accuracy and good feasibility. The model can provide an effective prediction
method for phreatic water depth of burial research and has good application prospects.
1 INTRODUCTION
With the rapid development of national economy,
water resources extraction is increasing. In the arid
northwest of China, surface water resources can
hardly meet people's daily water demand, and
groundwater extraction has become the main way of
water resources utilization. The change of
groundwater level is a very complex natural process,
which is a comprehensive effect of the groundwater
system stimulated by a variety of inputs (Chi et al.,
2008). There are many influencing factors and
complex structure of the groundwater system,
topography and geomorphology, meteorology,
human activities, etc. can cause the change of
subsurface phreatic water depth (Li et al., 2018). In
some places where no or little information is
available, it is difficult to obtain direct data on
phreatic water depth, and the lack of information not
only restricts the reasonable control of groundwater
resources, but also indirectly limits the economic
development of cities by blindly exploiting
groundwater beyond the carrying capacity of regional
water resources. Therefore, exploring the factors
influencing the phreatic water depth and establishing
a phreatic water depth prediction model to predict the
phreatic water depth can provide a scientific basis for
the development and utilization of groundwater
resources, which is of great significance to the
rational control and sustainable utilization of water
resources.
Groundwater systems are complex and the
process of water level change is difficult to predict.
From the early deterministic methods such as
analytical methods and physical simulation (Ping et
al., 2006) to the current uncertain methods by
building stochastic models (Wang et al., 2015), there
are more and more methods for water level prediction
with higher and higher accuracy. A BP artificial
neural network model with a mapping relationship
between the groundwater level and its influencing
factors was established and used for the dynamic
prediction of the groundwater level (Zhao et al.,
2002). In recent years, BP artificial neural network
method has been widely used and promoted in
groundwater dynamic prediction because of its
powerful ability to deal with nonlinear dynamical
systems, but it also has its own limitations, it has
problems such as long training time when predicting
groundwater level, falling into local minimum when
solving and slow speed when converging (Chi et al.,
2008). A combination term of learning rate adaption
and increasing momentum was used to improve the
Wei, X., Wang, N. and Peng, F.
Application of PSO
B
PNeuralNetworkModelbasedonIn f luenceFactorCorrelationforPhreaticWaterDepthPrediction.
InProceedings of the 7th International Conference on Water Resource and Environment (WRE 2021), pages369−376
ISBN : 978−989−758 −560 −9;ISSN : 1755−1315
Copyright
c
2022bySCITEPRESS˘ScienceandTechnologyPublications, Lda.Allrightsreserved
369

BP neural network and a simulation prediction model
of groundwater depth in western Jilin was
established, the model simulation and prediction
accuracy were high (Lu et al., 2007). Then genetic
algorithm was used to optimized the BP neural
network, a short-term prediction of groundwater level
was made in the study area, results showed that the
improved neural network model is a more ideal
prediction model for predicting short-term
groundwater level (Chi et al., 2008). Next wavelet
analysis function was introduced to improve the node
calculation of the traditional neural network model,
the improved BP neural network model was applied
in groundwater prediction in Xinjiang region, the
prediction results were higher than the prediction
accuracy of the traditional BP neural network model
(Xie, 2016). Afterwards, an improved particle swarm
algorithm was proposed to optimize the thresholds
and weights of BP networks, a tailings dam
groundwater level prediction model was established,
the results showed that the model improved the
prediction accuracy (Zhen et al., 2019). However,
most of these groundwater prediction methods
establish groundwater level prediction models
considering only groundwater level autocorrelation
or perform groundwater level prediction at a single
monitoring station, which makes it difficult to obtain
data directly affecting groundwater level changes
when prediction is performed in a larger area and
causes difficulties in prediction work. In order to
solve the above problems, this paper proposes a BP
neural network model based on particle swarm
optimization to address the problems of slow
convergence of BP neural network, easy to fall into
local minimum and low prediction accuracy. The
global search ability of the particle swarm algorithm
is used to optimize the topology, connection weights
and thresholds of the neural network, and the good
global search ability of the particle swarm algorithm
is combined with the good local search ability of the
BP algorithm to improve the generalization ability
and learning performance of the neural network, thus
improve the overall search efficiency of the neural
network.
In this paper, taking Xianyang city of Shaanxi
province as an example, collecting meteorological
data, socio-economic data and measured phreatic
water depth data, then calculating the correlation
between the three types of data, while establishing BP
neural network based on PSO improvement .And the
influencing factor with good correlation is selected as
the input of groundwater phreatic water depth
prediction, the groundwater depth of the current
month is taken as the output to establish a phreatic
water depth prediction model, and use this model to
realize the prediction of phreatic water depth in
Xianyang city.
2 OVERVIEW OF THE STUDY
AREA
Xianyang City is located at the middle of the
Guanzhong Basin, between 107°38′ and 109°10′ E
longitude and 34°11′ and 35°32′ N latitude, and is a
medium industrial city in Shaanxi Province with
textile, electronic, and mechanical industries, which
not only has a long history and culture, but also has a
leading economic position in the province. Figure 1 is
the geographic location map of the study area. The
groundwater level in Xianyang City is in constant
change, and it is most affected by human factors
mainly extraction (Zhen, 2012). The water used for
industrial and agricultural production, lives of urban
and rural residents in Xianyang mainly comes from
exploration of groundwater (He et al., 2012), and the
groundwater has always accounted for more than
80% of the total water supply in the city, which is the
most important source of water supply in Xianyang
City (He et al., 2015). The long-term massive
exploitation of groundwater has led to a continuous
decline in the groundwater level, ground subsidence,
ground fractures and other environmental geological
problems, which have seriously affected city’s
industrial and agricultural production, even affect the
lives of the people. Before the mid-1980s, the amount
of groundwater mining in Fengdong general over-
mining area of Qindu District was about
2500×10
4
m
3
/a. Since the water source in the
northwest suburbs of Qindu District was put into
construction in 1989, the amount of groundwater
mining in the area reached 3000×10
4
m
3
/a, resulting in
a sharp decline in the groundwater level. From 1987
to 1999, the water level of local lots had dropped from
8.10 m to 27.00 m, reaching the lowest water level in
history. Ground subsidence in the urban area of
Xianyang, the central part of the accumulated
subsidence 13.4 ~ 25.7 mm, has formed 0.3 ~ 0.8 mm
ground cracks in the north- east or nearly east-west
direction, causing cracks in more than 20 buildings
with width of the cracks 1.0 ~ 10.0 cm (Zhai, 2020).
If the management of groundwater exploitation is not
strengthened, the ground settlement, ground cracks,
and building cracks will further deteriorate.
WRE 2021 - The International Conference on Water Resource and Environment
370
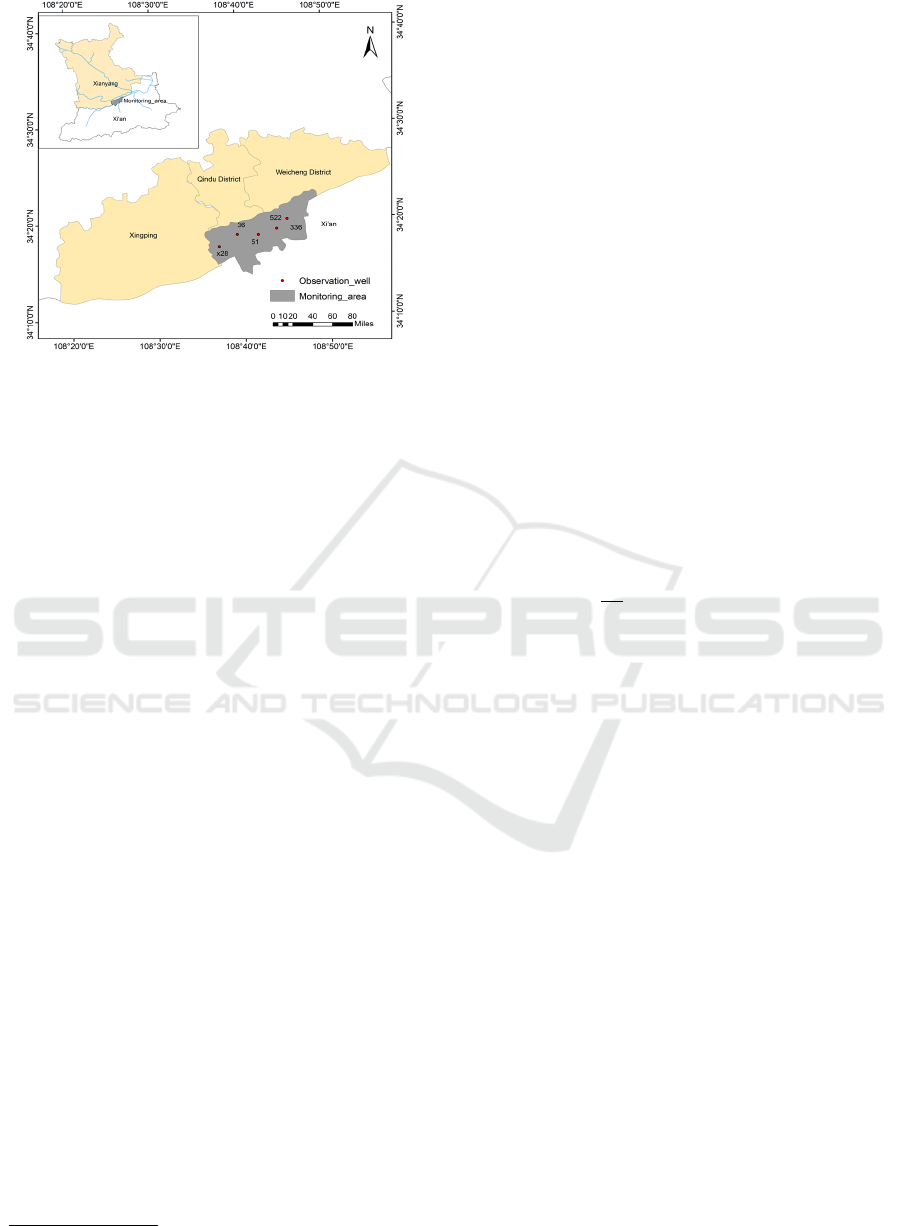
Figure 1: Location map of the study area.
3 MATERIALS AND METHODS
From the results of previous studies, it can be seen
that the depth of phreatic water in the study area is
mainly influenced by three major factors:
meteorological factors, hydrological factors and
human factors (Zhen, 2012), with hydrological
factors as direct influencing factors, meteorological
factors and human factors as indirect influencing
factors. The direct influence factors of phreatic water
depth were used to predict the phreatic water depth
with high accuracy, but in some special cases, the
actual condition to predict phreatic water depth will
not ideal, there may be a lack of some runoff
information, or the amount of groundwater extraction
is difficult to obtain, increasing the difficulty of
phreatic water depth prediction to some extent. In this
paper, the correlation between non-direct influence
factors and phreatic water depth is considered,
established stochastic model by using uncertainty
method according to correlation coefficient. The data
materials used in this paper are socio-economic data,
meteorological data and phreatic water depth data of
Xianyang city (Tao et al., 2013). The socio-economic
data include gross regional product and population
data was obtained from the National Economic and
Social Development Statistical Bulletin of Xianyang
City from 2000-2015. The meteorological data
include daily precipitation, sunshine hours, average
air pressure, average temperature and average relative
humidity of Xianyang City meteorological station
(Qindu 57048) from 2000-2015 was selected from the
national meteorological network
(http://data.cma.cn/). The phreatic water depth data of
Xianyang city was obtained from Shaanxi Province
Groundwater Level Almanac. First used correlation
analysis to identify the correlation between
population, gross regional product, meteorological
factors and phreatic water depth, then established
PSO_BP neural network model, the influencing
factor with good correlation is selected as the input of
groundwater phreatic water depth prediction, the
groundwater depth of the current month is taken as
the output. The model is continuously trained, and the
model parameters are saved when the output error
reaches the set value. The model is the final predictive
model and use this model to predict depth of phreatic
water.
Due to the long-time span of the collected data,
there are a number of missing data problems, and in
addition, some of the collected data scales are not
consistent with the required data scales. Therefore,
scale conversion and interpolation of the collected
data are needed to ensure data integrity and
consistency. The gross production value is converted
from annual to monthly scales using a simple
arithmetic average method; the population data are
interpolated according to the change trend, and the
interpolation formula is:
𝑃𝑜
𝑃𝑜
1
12
12 𝑖
𝑃𝑜
𝐿𝑃𝑜
1
In the formula, 𝑃𝑜
is the population in month 𝑖 of
the year, 𝐿𝑃𝑜
is the population of the previous
month of December. Unlike socioeconomic data,
meteorological data are daily data, which are
converted from small to large scales. The conversion
of meteorological data from daily to monthly scales
can be achieved with a simple statistical aggregation.
Among the 5 elements of meteorological data,
precipitation and sunshine hours can be converted by
simply summing the daily values of each month; the
remaining 3 elements need to be averaged over the
months. The transformed and interpolated data are
used as training data for the prediction model.
The dynamic groundwater monitoring in
Xianyang City has been started since 1985, and the
monitoring area is bounded by a line from Yanwang
Village to Changxing Village East in the east, Xi'an
City in the south, Xingping City in the west, and the
Gao Gan Canal in the north, covering an area of about
160 km
2
. 44 groundwater resource level monitoring
points are available in the city, including 20 diving
monitoring points, and the monitoring wells that meet
the requirements are selected. x28, 36, 336, 51, and
522. 36, 336, 51, and 522 have complete observation
data from 2000-2015, and the time interval of
observation can also meet the requirements, so the
Application of PSO
B
PNeuralNetworkModelbasedonIn fluenceFactorCorrelation forPhreaticWaterDepthPrediction
371

phreatic water depth data of these five groundwater
level observation wells are used for model validation.
4 CORRELATION ANALYSIS
In this paper, the prediction model is established
using the uncertainty method, and the correlation
between the depth of phreatic water and other factors
is analyzed using the Spearman correlation analysis
based on the advantages of current big data and
considering the influence of other indirect factors on
the depth of phreatic water. Table 1 is the analysis
result of the correlation The correlation between the
depth of phreatic water and other factors in Xianyang
city varies, with the correlation coefficients of the five
observation wells being larger than those of gross
regional product (-0.838), population (0.742),
precipitation (0.205), mean air pressure (-0.268), and
mean air temperature (0.268). The correlation with
precipitation (correlation coefficient of 0.205), mean
air pressure (correlation coefficient of -0.268) and
mean air temperature (correlation coefficient of
0.228) is small, and the correlation with mean relative
humidity (correlation coefficient of 0.049) is very
small and close to none. In general, the correlation
between phreatic water depth and population and
gross regional product is large, and the correlation
with average relative humidity is small. The results of
the correlation analysis are consistent with the actual
situation of Xianyang City.
Table 1: Analysis result of the correlation.
p
hreatic wate
r
de
p
th well36 well51 well336 wellx28 well522
Population (ten thousand)
-0.498
**
-0.068 0.742
**
-0.433
**
.532
**
Gross regional product ( 100 million yuan)
-0.838
**
-0.536
**
0.417
**
-0.374
**
0.188
**
Precipitation (mm)
0.106 0.123 0.198
**
0.205
**
0.194
**
Sunshine hours (hours)
0.018 0.019 0.032 0.145
*
0.074
Mean air pressure (hPa)
-0.082 -0.176
*
-0.190
**
-0.234
**
-0.268
**
Average temperature (℃)
0.077 .0145
*
0.179
*
0.261
**
0.228
**
Average relative humidity (%) 0.049
0.001 -0.009 -0.011 0.003
*. At the 0.05 level (two-tailed), the correlation is significant.
**. At 0.01 level (two-tailed), the correlation is significant.
5 MODEL ESTABLISHMENT
5.1 BP Neural Network based on PSO
Improvement
It has been mathematically demonstrated that BP
neural networks have a strong nonlinear mapping
capability, do not require an exact mathematical
model, and are easy to utilize for implementation and
computation. Let the input pattern of the network be
𝑥𝑥
,𝑥
,..,𝑥
, the implicit layer has 𝑞 cells,
The output of the implicit layer is 𝑧𝑧
,𝑧
,..,𝑧
,
the output layer has 𝑚 cells, their output is 𝑦
𝑦
,𝑦
,..,𝑦
, the target output is 𝑡
𝑡
,𝑡
,..,𝑡
, the transfer function from the implicit
layer to the output layer is 𝑓, the transfer function of
the output layer is 𝑔 (Zhou
& Tao, 2015), This leads
to the formula :
𝑧
𝑓𝑤
𝑥
𝜃𝑓𝑤
𝑥
2
In the formula, 𝑧
denotes the output of the 𝑗-th
neuron of the hidden layer, 𝑤
0, 𝑥
=-1.
𝑦
𝑔𝑤
𝑧
3
In the formula, 𝑦
denotes the output of the 𝑘-th
neuron of the output layer. The error between the
network output and the target output at this point is:
𝜀
1
2
𝑡
𝑦
4
Particle swarm algorithm can converge to the
global optimal solution with higher probability, with
WRE 2021 - The International Conference on Water Resource and Environment
372
faster computation speed and better global search
capability (Gao & Li, 2012). Suppose there are N
particles forming a cluster in a D-dimensional target
search space, where the 𝑖-th particle is represented as
a D-dimensional vector:
𝑋
𝑥
,𝑥
,…,𝑥
,i1,2,…N
5
The "flight" velocity of the𝑖-th particle is also a D-
dimensional vector, denoted as:
𝑉
𝑣
,𝑣
,…,𝑣
,𝑖1,2,…𝑁
6
The optimal position searched by the 𝑖-th particle
so far is called the individual extreme value, denoted
as:
𝑃
𝑃
,𝑃
,…,𝑃
,𝑖1,2,…,𝑁
7
The optimal position searched by the whole particle
swarm so far is the global extremum, denoted as:
𝐺
𝑝
,𝑝
,…,𝑝
8
𝑐
,𝑐
is the learning factor, also known as
acceleration constant; 𝑣
is the velocity of particle 𝑖,
𝑣
∈
𝑣
,𝑣
; 𝑥
is the position of particle
𝑖, 𝑥
∈
𝑣
,𝑣
.
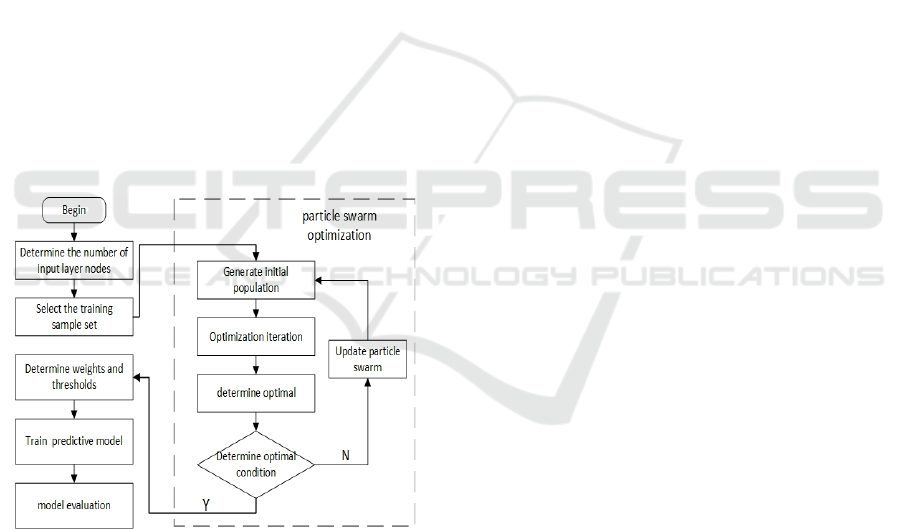
Figure 2: Flowchart of PSO optimized BP neural network
algorithm.
The principle of PS0 to improve BP neural
network is to use the global search ability of PSO to
get the optimal individual to assign the initial weights
and thresholds to the BP neural network. The output
error of the training sample set through the neural
network is passed to PSO to establish the adaptation
function, and the adaptation function is used to
calculate the adaptation values of the population and
individuals, and when the adaptation value reaches
the optimal adaptation value, the search is stopped
and the optimal value is input to the BP neural
network part, and finally the neural network
prediction is performed by the optimal initial
threshold and weights.
The neural network construction is divided into 3
parts, which are network structure determination,
particle swarm algorithm optimization, and neural
network prediction. The flow chart is as follows
(Figure 2).
5.2 Model Building
As previous experience, bp neural network generally
chooses one input layer and one output layer.
According to the results of the correlation analysis in
section 4, six elements with greater correlation,
namely, regional gross product, population,
precipitation, average air pressure, sunshine hours
and average temperature data were selected as the
input of the model, i.e., one layer of network input,
the number of nodes was 6, and the output result is
the phreatic water depth data. The collected data is
divided into 2 groups, these data of each month from
2000 to 2013 were used to train the model called
training sample sets, and the 2014-2015 data for each
month were used to test the model called the test
sample set. And the final PSO-BP neural network
model was constructed through repeated training
sample set data. Here are the data of 5 observation
wells, so there are 5 sample sets ,the training sample
set of five observation wells was repeatedly trained,
and the training was stopped when the predicted
phreatic water depth variation process of the model
was consistent with the measured value and the
relative percentage error was less than 5%, and the
population size of the PSO algorithm was finally
determined to be 20, the number of evolution was
100, and the convergence factor was selected as the
empirical value 𝑐
𝑐
1.49445 The number of
hidden layer nodes for BP network training is 10, the
number of iterations is set to 40, and the learning rate
is 0.1.
6 MODEL PREDICTION
RESULTS AND DISCUSSION
The trained PSO-BP neural network model will
simulate the variation of the burial depth of the 5
observation wells and the changes between the
elements, and then obtain the predicted data of each
observation well and output the results, in order to
Application of PSO
B
PNeuralNetworkModelbasedonIn fluenceFactorCorrelation forPhreaticWaterDepthPrediction
373
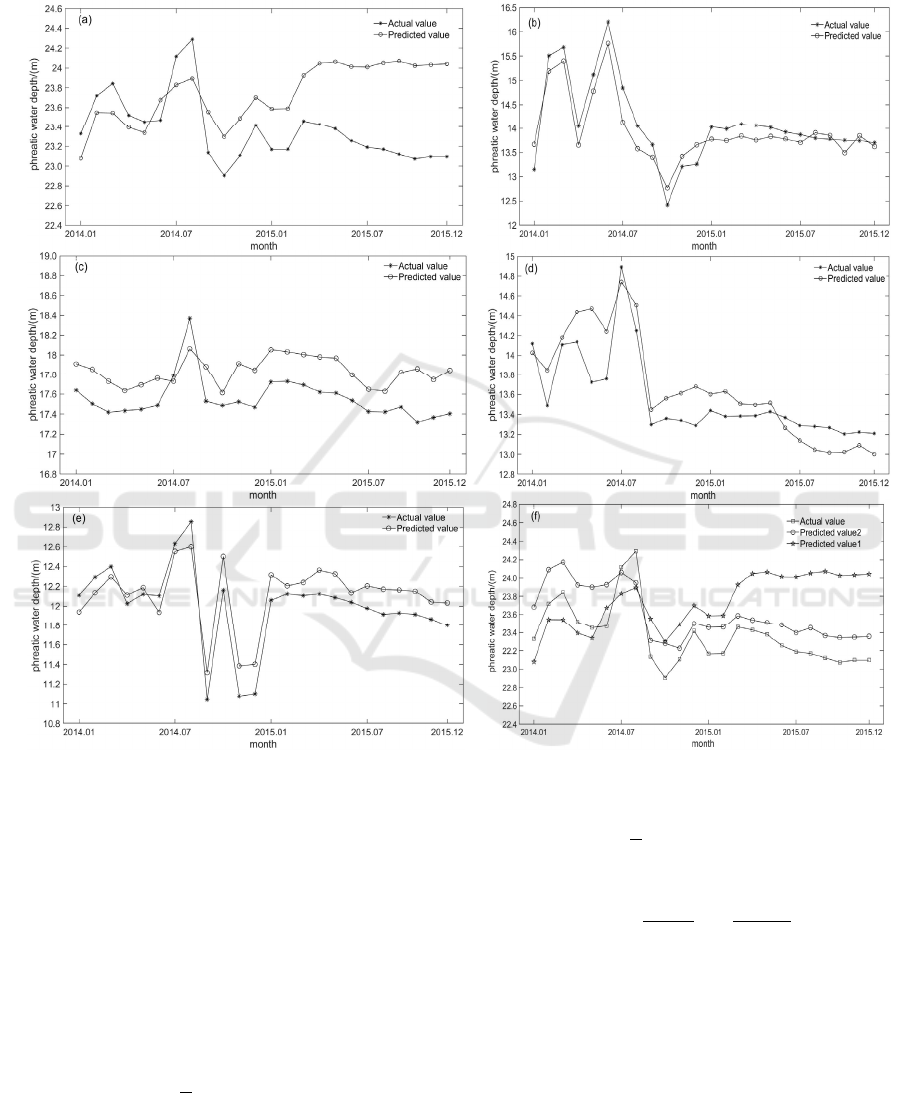
visually display the prediction results of the 5
observation wells, the prediction result data is
displayed in the form of a line graph, and for the
convenience of comparison, the measured data is also
displayed together. The comparison results between
the predicted and measured values are shown in
Figure 3(a-e).
Figure 3: Comparison of measured and simulated values from observation wells.
In order to quantify the accuracy of the model in
groundwater diving burial simulation, three
evaluation metrics were used in this study, namely
root mean square error RMSE, mean absolute error
MAE mean absolute percentage error MAPE. RMSE
reflects the deviation between the predicted value and
the measured value. MAE is the average of the
absolute error, which can reflect the actual situation
of the prediction value error. MAPE is the mean
absolute percentage error. The specific calculation
formula is as follows:
𝑅𝑀𝑆𝐸
1
𝑛
𝑦
𝑦
/
9
𝑀𝐴𝐸
1
𝑛
|
𝑦
𝑦
|
10
𝑀𝐴𝑃𝐸
100%
𝑛
𝑦
𝑦
𝑦
11
In the formula, 𝑛 is the total number of samples,
𝑦
is the actual value of the 𝑖-th sample, and 𝑦
is the
predicted value of the 𝑖-th sample. The results are
shown in Table 2.
The model was used to predict the phreatic water
depth of five observation wells in Xianyang City, and
it can be seen from Figure 3(a-e) that the model can
output complete prediction data of phreatic water
WRE 2021 - The International Conference on Water Resource and Environment
374

depth, and the prediction results are generally
consistent with the trend of the measured values of
phreatic water depth of five observation wells. On the
whole, although the model has some relative errors, it
can predict the trend of phreatic water depth more
accurately. The relative percentage error between the
prediction results and the measured values was no
more than 2.5%, and the largest error was in
observation well 36(Figure 3a), with a relative
percentage error of 2.18%. The best prediction results
were obtained for observation well x28(Figure 3d)
and observation well 522(Figure 3f), with relative
percentage errors of 1.69% and 1.65%, respectively,
which is consistent with the correlation analysis of the
six factors with the phreatic water depths of
observation wells x28(Figure 3d) and 522(Figure 3f).
Observation well 36(Figure 3a) and observation well
51(Figure 3b) showed poorer predictions than the
other observation wells, which may be due to the poor
correlation between the selected input factors and the
subsurface phreatic water depths.
Table 2: Simulation evaluation results.
RMSE MAE MAPE
well36 0.58007 0.50764 2.18%
well51 0.32285 0.28605 2.02%
well336 0.32120 0.30588 1.74%
wellx28 0.27284 0.22866 1.69%
well522 0.21226 0.19682 1.65%
The main influencing factors of phreatic water
depth of each observation well are different, and the
prediction with too many unrelated factors as training
models does not get better prediction results. Since
observation well 36 is only significantly correlated
with population and gross regional product, for
observation well 36, the model is adjusted to select
population, gross regional product, precipitation, and
mean air pressure as model inputs, and the model
training parameters are adjusted to predict the
variation pattern of observation well 36, as shown in
Figure 3(f), and the RMSE of the model is 0.35297
and the MAE is 0.33711, with an average absolute
error of 1.45%. This is 0.73% less than the average
absolute error of using the previous six factors as
model inputs, and the trend of phreatic water depth
variation is more accurately portrayed. The five
monitoring wells are all in the same hydrogeological
unit, and the distance between all the wells is not large,
if only based on the hydrogeological conditions, the
input variables of the PSO_BP model for the five
monitoring wells are the same, but the significant
factors selected by correlation analysis are input to the
model, and a better prediction effect is achieved.
Therefore, the model should be combined with
quantitative methods to achieve better prediction
results.
7 CONCLUSION
This paper studied the prediction of phreatic water
depth in the absence of subsurface phreatic water
depth information, takes Xianyang City as the study
area, analyzed the correlation between phreatic water
depth and other factors, selects factors with
significant correlation such as population, gross
regional product and precipitation to build a phreatic
water depth prediction model, and uses PSO-BP
neural network for prediction, the main conclusions
are as follows:
The correlation between phreatic water
depth, socio-economic factors and
meteorological factors was analyzed by
Spearman's correlation analysis, and the
results showed that the correlation between
phreatic water depth and population and
gross regional product in Xianyang City was
the most significant, and the correlation with
average temperature and precipitation was
small, and the correlation with average
relative humidity was extremely small.
The groundwater burial depth prediction
model based on correlation combined with
PSO_BP neural network was established to
predict the test samples, and the prediction
results have the same trend with the actual
measured data, and the model has high
accuracy and good stability.
In the prediction of phreatic water depth, the
accuracy of the predicted results is higher for
the influence factors with high correlation
input, and it is extremely important to
consider different influence factors on the
prediction of phreatic water depth.
ACKNOWLEDGMENTS
This work was supported by National Natural Science
Foundation of China (Grant No. 51979221) and
Natural Science Basic Research Program of Shaanxi
(Program No. 2021JLM-45, 2019JLZ-15). The
authors thank the editor for their comments and
suggestions.
Application of PSO
B
PNeuralNetworkModelbasedonIn fluenceFactorCorrelation forPhreaticWaterDepthPrediction
375

REFERENCES
Chi, B. M., Lin, L., & Ding, Y. F. (2008). Application of
BP neural network model based on genetic algorithm in
groundwater dynamic prediction. Geotechnical
Investigation & Survey, 9, 36-41.
Gao, Z., & Li, X. Z. (2012). The hybrid adaptive particle
swarm optimization based on the average speed.
Control and Decision Making, 1, 152-155+160.
He, L. X., Zhou, M. J., & Luo, X. W. (2012). Analysis of
factors influencing multi-year groundwater level
dynamics in Xianyang City, Shaanxi Province. Journal
Of Water Resources and Architectural Engineering,
4 ,160-164.
He, X. B., Tao, F. P., Tao, H., Ding, J., & Li, H. (2015).
Analysis of groundwater level change patterns and
influencing factors in the Guanzhong Plain. Ground
Water, 3, 52-54.
Li, M. Q., Xiao, C. L., Liang, X. J., & Hu, B. (2018).
Analysis of dynamic characteristics and drivers of
groundwater burial depth under changing environment.
Water Resources and Hydropower Engineering, 11, 1-
7.
Lu, W. X., Yang, Z. P., Li, P., & Yang, W. (2007). Dynamic
groundwater prediction model based on improved BP
algorithm. Water Resources Protection, 23(3), 5-8+59.
Ping, J. H., Li, S., Qin, L. J., & Jiang, J. X. (2006). A
Review and Perspective of Groundwater Dynamic
Prediction Models. Water Resources Protection, 4, 11-
15.
Tao, H., Tao, F. P., & Liu, W. B. (2013). A study of 50-year
groundwater dynamics and influencing factors in the
Guanzhong urban agglomeration. Hydrogeology &
Engineering Geology, 6, 37-42+61.
Wang, Y. B., Liang, X. J., Qiao, Y., & Wang, Z. K. (2015).
Comparative analysis study of groundwater level
prediction models. Water Saving Irrigation, 7, 58-61.
Xie, Y. Q. (2016). Application of improved BP neural
network model in groundwater prediction. Water
Resources Planning and Dsign, 7, 45-47+67.
Zhai, J. (2020). Calculation of underground water
resources in urban areas of Xianyang City and study of
over-exploitation management plan. Master's thesis,
Xi'an University of Technology.
Zhao, S. L., Liu, Y.& Li, S. Q. (2002). Predicting
Groundwater Dynamics with BP Neural Networks.
Journal of Hebei Agricultural University, 4, 205-207.
Zhen, D. K., Xu, T. L., & Yin, S. J. (2019). Improved PSO-
BP neural network for prediction of underground water
level in tailings dams. Journal of Shandong University:
Engineering Science, 3, 108-113.
Zhen, X. Y. (2012). Groundwater response to climate
change in the Guanzhong Basin. Master's thesis,
Chang'an University.
Zhou, C., &Tao, J. C. (2015). Adaptive combination
forecasting model for China’s logistics freight volume
based on an improved PSO-BP neural network.
Kybernetes, 44,
4.
WRE 2021 - The International Conference on Water Resource and Environment
376
