
Analysis of the Impact of Water Conservancy Investment on
High-quality Economic Development in Western China
Jiwei Zhu
1,2
, Wenxing Fang
1,2,*
, Xining Jing
1,2
and Jianmei Zhang
1,2
1
State Key Laboratory of Eco-hydraulics in Northwest Arid Region, Xi’an University of Technology, Xi’an, China
2
Research Center of Eco-hydraulics and Sustainable Development, The New Style Think Tank of Shaanxi Universities,
Xi’an, China
Keywords: Water conservancy investment, Economic development, Influence relationship, Influence path
Abstract: Water conservancy is the lifeblood of the national economy and is of great significance to the high-quality
development of the region. In order to maximize the economic benefits of water conservancy investment
(WCI), this article focuses on panel data from 2005 to 2018 in 12 provinces in western China, and constructs
an economic development evaluation index system from five dimensions: innovative development,
coordinated development, environmental development, opened development and shared development, and
uses dynamic panel model to explore the influence relationship and path of western WCI on economic
development. The results indicate that: there is a significant non-linear effect between WCI and economic
growth, and show an inverted U-shaped relationship. This shows that with the expansion of WCI, economic
growth has risen first and then declined. At present, the impact of WCI in the western region on high-quality
economic development is in the promotion stage of positive and sustained growth. The results of this paper
help to control the scale of water resources input and improve the effectiveness of water resources investment
in the western region to support decision-making.
1 INTRODUCTION
Investment in water conservancy construction, as a
controlling factor that promotes national economic
growth, protects the lives of the people and the
ecological environment, occupies a very important
position in the economically backward western
regions. After the 19th National Congress of the
Communist Party of China, the central government's
investment in water conservancy infrastructure has
reached a new level. The western region has seized
the opportunity to substantially increase the scale of
investment in water conservancy infrastructure. On
the one hand, it is to promote economy development
and improve people’s livelihood, on the other hand, it
is also to solve the prominent contradiction between
economic and social development and water supply
and demand, and to achieve sustainable development
of water resources and economic society (Qiu, 2020).
Therefore, studying the impact of water resources
investment on economic growth is of great
significance for optimizing the structure of water
conservancy construction investment and maximizing
the economic benefits of water resources investment.
Many scholars have launched many discussions
on the relationship between water resources
investment and economic growth. Xu and Li (2012)
measured the contribution of water conservancy
construction investment to economic growth and
found that water conservancy construction investment
has the most direct impact on the primary industry. Ge
and Yan (2015) used the general Solow production
function to estimate that water conservancy
construction investment has a 10% stimulating effect
on GDP growth. Chen Yuanyuan (2019) analyzed the
relationship between economic development and
water conservancy construction investment in the
western region from 2002 to 2016, and found that
economic development has a significant long-term
positive impact on investment in water resources
construction. Wang et al. (2019) established a
dynamic multiplier analysis model and concluded that
the contribution rate of Guangdong's WCI to GDP
from 2000 to 2017 was 0.65%-2.40%. Chen and
Wang (2019) found that the investment in water
conservancy construction has a long-term co-
integration relationship with the total output value of
agriculture, forestry, animal husbandry and fishery. In
Zhu, J., Fang, W., Jing, X. and Zhang, J.
Analysis of the Impact of Water Conservancy Investment on High-quality Economic Development in Western China.
In Proceedings of the 7th International Conference on Water Resource and Environment (WRE 2021), pages 333-340
ISBN: 978-989-758-560-9; ISSN: 1755-1315
Copyright
c
2022 by SCITEPRESS – Science and Technology Publications, Lda. All rights reserved
333
summary, the existing research mainly focused on
analyzing the direct relationship between WCI and
GDP, and lacks a comprehensive consideration of
economic development, that is, analyzing its
relationship with high-quality economic
development. Therefore, based on panel data, this
article uses a dynamic model to study the impact of
WCI on high-quality economic development in the
western region, and quantifies the contribution of
WCI to economic and social development. This helps
to understand the current situation of investment in
water conservancy construction in the western region
and promote high-quality economic and social
development in the western region.
2 GENERAL SITUATION OF WCI
AND ECONOMY IN THE
WESTERN REGION
2.1 Data Sources
The data in this article are mainly derived from the
2005-2018 China Water Conservancy Yearbook,
China Water Conservancy Statistical Yearbook,
China Statistical Yearbook, National Economic and
Social Development Statistical Bulletin, and
statistical yearbooks of 12 provinces in the western
region and their portal websites public information.
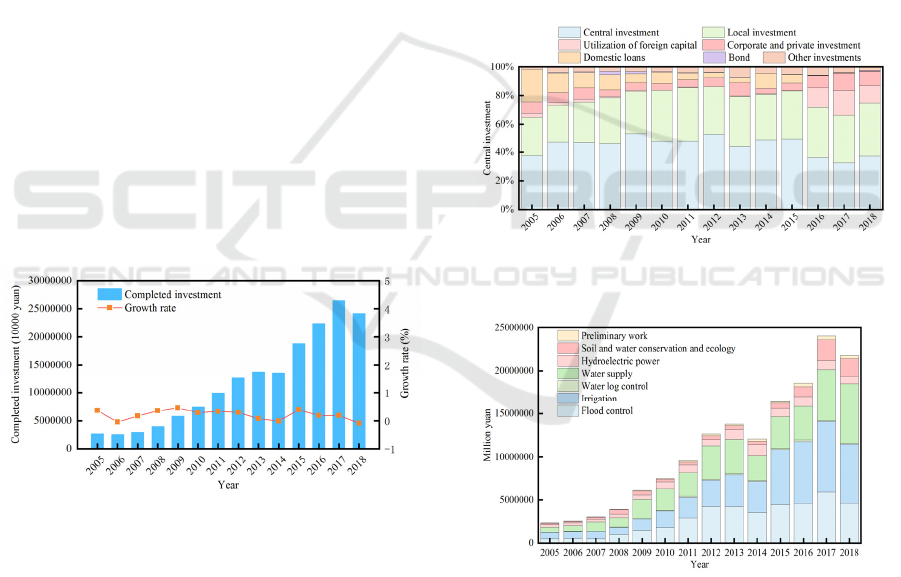
Figure 1: Completed amount and growth rate of WCI
in the western region.
2.2 WCI in the Western Region
2.2.1 Analysis of WCI Scale
Water conservancy construction, as a key support
area of national infrastructure construction, is one of
the key investment directions of government financial
funds (Wang, 2017). In terms of investment
arrangements, the state pays attention to the central
and western regions, especially the western regions.
The details of the completion of the western WCI are
shown in Figure 1.
2.2.2 Analysis of Sources of WCI
With the continuous expansion of WCI, the sources
of WCI have gradually shown diversified
characteristics. By categorizing the amount of WCI
completed in 2005-2018 according to the source of
funds, it is found that government investment has
always occupied the main position, of which the
central government has the largest proportion.
Enterprise and private investment, and domestic
loans, as new forces,
also account for about one-
seventh of each year. The use of foreign capital,
others, and bonds account for a relatively small
proportion, with an annual share of less than 10%.
Figure 2 shows the proportion of different sources of
funds in each year.
Figure 2: Distribution of WCI sources in the western region.
Figure 3: Distribution map of WCI by purpose in the
western region.
2.2.3 Analysis of WCI Use
Based on the data of WCI completed in the western
region from 2005 to 2018, it is divided into flood
control engineering, water supply engineering,
irrigation engineering, soil and water conservation
and ecological engineering, water logging
WRE 2021 - The International Conference on Water Resource and Environment
334
engineering, hydropower engineering and
preliminary work according to purpose. The specific
situation is shown in Figure 3.
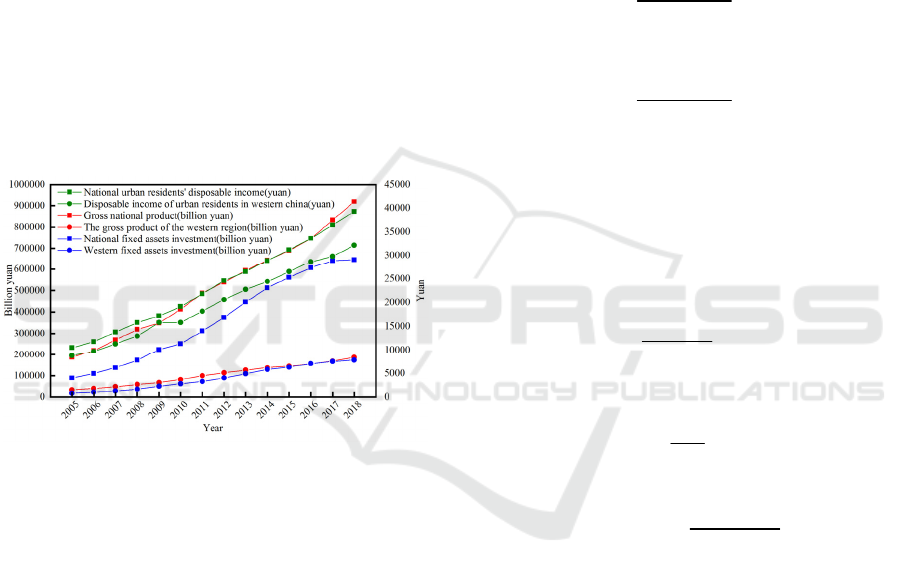
2.3 Economic Development in the
Western Region
With the implementation of the western development
strategy, new historical achievements have been made
in the economic and social development of the
western region, which has played an important
supporting role in national development (Wang &
Wang, 2019). The western region has entered a period
of rapid development, and some provinces have been
in the forefront of the country in economic indicators
for many years. However, compared with the eastern
region, the overall level of economic development in
the western region is relatively backward, with its
GDP accounting for only one-fifth of the country, and
investment in fixed assets is relatively small.
Figure 4: The economic development of the western region
from 2005 to 2018
Although the disposable income of urban
residents has been growing, there is still a large gap
between the national average and the disposable
income, as shown in Figure 4. Therefore, in the future,
the western region should still be the main target of
national policy support and investment tilt.
3 MODELS AND METHODS
3.1 Variable Selection
3.1.1 The Explained Variable
The explained variable is the level of economic
development. This article quantifies the economic
level of the western provinces from five dimensions:
innovative development, coordinated development,
green development, open development, and shared
development, and establishes an indicator system
(Pan & Luo, 2020), the results are shown in Table 1.
It can be seen from the table that the indicator system
consists of 5 first-level indicators, 12 second-level
indicators, and 20 third-level indicators.
In order to eliminate the differences in dimension,
order of magnitude, and orientation among the
various indicators, this paper adopts the entropy
method to standardize the selected indicator data. The
forward index is processed by formula (1), and the
reverse index is processed by formula (2).
min
max min
-
=
-
ij
ij
xx
u
x
x
(1)
max
max min
-
=
-
ij
ij
x
x
u
x
x
(2)
Among them, x
represents the value in the i-th
row and j-th column in the original data, x
represents the maximum value in the j-th column in
the original data, and x
represents the minimum
value in the j-th column in the original data. See (3),
(4), (5) for specific calculation formulas, and it is
stipulated that when q
0, limq
ln q
0.
1
ij
ij
n
ij
j
u
q
u
(3)
1
1
ln
ln
n
iijij
j
s
qq
n
(4)
i
i
m
i
i=1
1s
w=
1-s
()
(5)
Among them, q
represents the proportion of
u
in the comprehensive sum of the data; s
represents the index information entropy; w
represents the index weight, the number of columns
n=14, and the number of indicators m=20. Based on
the entropy weighting method, the weights of each of
the indicators are calculated to obtain the
comprehensive economic development level of each
province.
Analysis of the Impact of Water Conservancy Investment on High-quality Economic Development in Western China
335
Table 1: Indicator system of economic development level.
Object level
Primary
targets
Secondary
indicators
Three-level indicators Unit Direction
Economic
development
Innovation
and
Development
Innovation
Input
Research and experimental
development expenditures (Liu,
2020; Qiao, 2021)
billion yuan +
Full-time equivalent of research and
ex
p
erimental develo
p
ment
p
ersonnel
Ten thousand
p
eo
p
le
y
ea
r
+
Innovation
Outputs
Number of domestic patent
a
pp
lications acce
p
ted
(
Li & Ju, 2021
)
item +
Technical turnover (Cao, 2021) billion yuan +
Coordinated
Development
Industrial
development
coordination
Industry rationalization index (Peng
& Zhu, 2020)
% -
Industrial Structure Advanced Index
(
Qiao, 2021; Pen
g
& Zhu, 2020
)
% +
Urban-rural
economic
harmonious
Consumption ratio of urban and rural
residents (Cao, 2021; Peng & Zhu,
2020)
- -
Income ratio of urban and rural
residents (Liu, 2020) (Peng & Zhu,
2020)
- -
Green
Development
Green Life
Forest coverage (Ma & Chen, 2020;
Wan et al., 2020
)
% +
Harmless treatment rate of domestic
g
arba
g
e
(
Liu, 2020; Cao, 2021
)
% +
Energy
consumption
Total city natural gas supply (Liu,
2020)
billion cubic
meters
-
Environmental
management
Urban green area (Liu, 2020; Peng &
Zhu, 2020; Wan et al., 2020)
million hectares +
Open
Development
Foreign trade
The proportion of total import and
export in GDP (Liu, 2020; Duan et
al., 2020)
% +
Utilize foreign
capital
The proportion of foreign direct
investment in GDP (Ran & Zheng,
2021)
% +
Tourism
openness
International tourism receipts (Cao,
2021)
One hundred
million dollars
+
Shared
Development
Economic
shared
development
per capita GDP (Liu, 2020; Duan et
al., 2020; Ma & Chen, 2020; Wan et
al., 2020)
yuan/people +
Urbanization rate (Peng & Zhu,
2020)
% +
Social shared
development
Staff in health institutions (Cao,
2021
)
million people +
Education funding (Liu, 2020) million yuan +
Volume of passenger traffic (Liu,
2020)
million people +
3.1.2 Core Explanatory Variables
The core explanatory variables are the WCI and the
square item of WCI in 12 provinces, municipalities,
and autonomous regions in the western region.
3.1.3 Control Variables
In order to better describe the explained variables, this
article selects human capital, government
intervention, urbanization rate, and degree of opening
to the outside world as the control variables of this
model. The main variables involved in this article
WRE 2021 - The International Conference on Water Resource and Environment
336

include: economic development (Eco), WCI (Water),
WCI square item (Waterq); intermediary variables
include: industrial structure (Ind), technological
progress (Rd) and resource allocation (Diskl); control
Variables include: human capital (Hum), urbanization
level (Urb), government intervention (Gov), and
degree of openness (Imp). To ensure the stability of
the data, the logarithmic value of the WCI and the
degree of openness are taken, and the square term of
the WCI is obtained by taking the logarithmic value
of the WCI and then square (Sun & Zhou, 2019).
3.2 Model Construction
Based on the endogenous economic growth model,
combined with the economic development indicator
system, this paper studies the impact of WCI on
economic development and establishes a basic model,
as shown in formula (6).
it 0 1 2
Eco = + + + +
it it i it
ββW β Xuε
(6)
Among them, Eco
represents the level of
economic development of place i in period t, W
is
the amount of WCI completed in place i in period t,
X
is other factors that affect economic development
in the same period and the same place, u
is the
individual disturbance term, and ε
is random
disturbance items.
β
is the intercept term of the model, β
is the
variable coefficient of WCI, the positive and negative
coefficients represent the direction of the influence of
WCI on economic development, and the magnitude
indicates the degree of influence. To improve the
accuracy and scientific character of the model, this
article optimizes the above basic model as follows:
3.2.1 Dynamic Panel Model
In order to assess whether there is a difference in the
impact of WCI on economic development under
different investment scales, this paper introduces the
square term of WCI. Economic development is a
process of dynamic changes in the economic
structure. The impact of the previous level on the
current development cannot be ignored. In order to
better explore the impact of water investment on
economic development, a dynamic Panel model is
constructed by introducing third-order lagged
variables of the explanatory variables. The optimized
model is shown in (7).
Eco
it
𝛽
𝛽
𝐸co
𝛽
𝐸𝑐𝑜
𝛽
𝐸𝑐𝑜
𝛽
𝑊
𝛽
𝑊
𝛽
𝑋
𝑢
𝜀
(7)
In the formula, Eco
, Eco
, Eco
,
respectively represent the first, second, and third-
order lagging terms of the economic development
level, and W_q
is the square term of WCI, and the
meaning of other variables is the same as equation (6).
3.2.2 Model Robustness Test
The robustness of the model has an important impact
on the accuracy of the measurement results, and index
replacement is a common method to test the
robustness of the model. The development level of the
tertiary industry is one of the important indicators that
reflect the level of productivity development of a
country or region (Zhao, 2013). This article uses the
added value of the tertiary industry as a test index for
the replacement economic development level.
4 RESULTS AND ANALYSIS
4.1 Analysis of Benchmark Results
Considering that the relationship between the
explained variable and the core explanatory variable
may be mutual: WCI will promote economic
development, and economic development will in turn
affect the scale of WCI, so the model may be
endogenous. The results of LR test and Wald test both
concluded that there is heteroscedasticity between the
model disturbance items. In order to improve the
accuracy of the regression results, the system GMM
method is used to regress the model after the second-
order difference of the variables.
The test results of AR (1) and AR (2) in Table 2
show that the model has first-order autocorrelation,
but no second-order autocorrelation and no
autocorrelation of the disturbance terms. Meanwhile,
the p-values of the Sargan test are both greater than
0.1, indicating that the instrumental variables are
effectively chosen. Therefore, it is feasible to use the
systematic GMM method to estimate the model.
It can be seen from the results that the regression
coefficients of the economic development of the three
lagging periods are all very significant, indicating that
the economic development of the western region will
be affected by the previous development level.
Further observation of the regression coefficient of
WCI, we found that regardless of the introduction of
control variables, the regression coefficient of WCI
on economic development are all positive,
Analysis of the Impact of Water Conservancy Investment on High-quality Economic Development in Western China
337

respectively 0.3276*, 0.2949**, 0.2028*, 0.2535*
and 0.3297***, and the P values are all within their
respective ranges, so they have also passed the
significance test. The significance test shows that in
the transitional stage of economic growth in the west
of our country, strengthening WCI to promote
economic development is a viable path choice. For the
square term of WCI in Table 2, the coefficients are all
significantly negative, which shows that with the
increase of WCI, the economy shows a trend of first
increase and then decrease, that is, there is an inverted
U-shaped relationship between WCI and economic
development. It shows that the role of WCI in
promoting economic growth is conditionally limited,
and a reasonable investment scale is the key to giving
full play to the economic benefits of WCI. Once it
exceeds the best advantage, it will hinder economic
growth.
Table 2: Analysis of the impact of WCI on economic development.
(1) (2) (3) (4) (5) Robustness test
Eco(-1)
-
0.6685***
-0.6551*** -0.5778*** -0.5808***
-
0.6119***
-0.4524***
(0.000) (0.000) (0.000) (0.000) (0.000) (0.000)
Eco(-2)
-0.2502** -0.2468** -0.2872*** -0.2710** -0.2794** -0.2285***
(0.013) (0.004) (0.001) (0.001) (0.009) (0.000)
Eco(-3)
-
0.2686***
-0.2745** -0.2524* -0.2279* -0.1943* -0.1448
(0.001) (0.001) (0.016) (0.015) (0.033) (0.053)
Water
0.3276* 0.2949** 0.2028* 0.2535* 0.3297*** 0.3615***
(0.012) (0.008) (0.018) (0.013) (0.001) (0.000)
Waterq
-0.0117* -0.0106* -0.0073* -0.0090*
-
0.0119***
-0.0129***
(0.015) (0.011) (0.024) (0.015) (0.001) (0.000)
Urb
1.1795* 1.2354* 1.1501* -3.6883 1.5548*
(0.021) (0.017) (0.036) (0.847) (0.042)
Imp
0.0159*** 0.0159*** 0.0363 0.0060*
(0.000) (0.000) (0.700) (0.022)
Gov
0.0315 1.0521 0.2879*
(0.729) (0.052) (0.017)
Hum
0.0165*** -45.5774*
(0.001) (0.027)
_cons
0.0136*** 0.01318838*** 0.0116*** 0.0119*** 0.0121*** -0.0079*
(0.000) (0.000) (0.000) (0.000) (0.000) (0.011)
AR(1)
-3.0243 -2.9216 -2.9193 -2.8952 -2.9031 -2.5414
(0.0025) (0.0035) (0.0035) (0.0038) (0.0037) (0.0110)
AR(2)
-0.0652 0.3596 0.5131 0.5373 0.7738 1.2505
(0.9480) (0.7191) (0.6079) (0.5911) (0.4390) (0.2111)
Sargan test 84.47629 102.6454 107.5081 115.7045 132.7714 136.2922
(0.6722) (0.7886) (0.9489) (0.9483) (0.8405) (0.7817)
Note: * p<0.05, ** p<0.01, *** p<0.001; The P value of the corresponding statistic is in parenthes
WRE 2021 - The International Conference on Water Resource and Environment
338

However, judging from the WCI coefficient, the
western region is still far from the best point at this
stage, and it is still at a stage where it is necessary to
continue to increase investment. The rapid
development of the western region still requires
government investment and policy support. As far as
the control variables are concerned, the regression
coefficients of human capital, degree of development,
and urbanization are all significantly positive,
indicating that higher levels of human capital, degree
of openness, and urbanization rate are all conducive
to economic development. Although the coefficient of
government intervention on economic development is
positive, However, the reliability is not high due to its
low significance.
4.2 Robustness Analysis
Re-regression the value added of the tertiary industry
as the explained variable, and the results are shown in
Table 2. The significance and direction of the
regression coefficients did not change substantially,
but only the magnitude of the coefficients changed.
The estimated results still support the conclusion that
WCI can effectively improve economic development
and the relationship between the two is inverted U-
shaped, indicating the regression of the model The
result is robust.
5 SUMMARY AND CONCLUSION
Using descriptive data statistics, analyzing from the
three aspects of GDP, investment in fixed assets, and
people’s living standards, it is concluded that the
social and economic development of the western
region is in a state of continuous growth, but there is
a certain gap compared with the eastern region. Some
indicators have not reached the national average.
Analyzing the current situation and evolution trend of
WCI in the western region from three perspectives of
investment scale, investment source and investment
purpose, it can be found that the total amount of water
investment in the western region has been increasing
in the past 14 years. Mainly for irrigation projects, soil
and water conservation, ecology, and preliminary
work have gradually become the focus of investment.
The results show that there is a significant non-linear
effect between WCI and economic growth, showing
an inverted U-shaped relationship, that is, as the scale
of WCI expands, economic growth shows a trend of
rising first and then falling. It shows that the
expansion of WCI scale before reaching the optimal
scale has a positive impact on economic growth, and
exceeding the optimal investment scale will hinder
economic development.
The scale of WCI should match the local
economic development, population size, and natural
conditions. We should not blindly pursue scale
expansion. It is necessary to reasonably control the
scale of investment according to specific needs. At
this stage, the western region is still at a stage where
it is necessary to continue to increase investment in
water conservancy, and we must continue to pay
attention to investment in weak links in water
conservancy infrastructure construction. Pay attention
to the gradual transformation of WCI from traditional
power generation and irrigation to water conservation
and ecological and water conservancy informatization
construction, and continue to accelerate the pace of
water conservancy modernization.
ACKNOWLEDGMENTS
This research was funded by Project of National
Natural Science Foundation of China (71774132),
Shaanxi Water Conservancy Science and Technology
Project (2020SLKJ-22), Shaanxi Provincial
Department of Education Key Scientific Research
Project (20JT053).
REFERENCES
Cao, X. C. (2021). Research on Evaluation of High-quality
Economic Development of Heilongjiang Province
Based on Entropy Method. Business Economics, 3, 27-
28+75.
Chen, L., & Wang, Q. (2019). Research on the relationship
between China's water conservancy facility investment
and agricultural economic growth. Development
Research, 5, 39-46.
Chen, Y. Y. (2019). Research on the relationship between
economic development and investment in water
conservancy construction in the western region. Xi’an:
Xi'an University of Technology.
Duan, X., Ren, Q. L., & Li, M. R. (2020). Social capital,
industrial structure optimization and high-quality
economic development——Based on the empirical test
of provinces along the Silk Road Economic Belt in
China. Journal of Lanzhou University of Finance and
Economics, 36(05), 1-20.
Ge, J. Y., & Yan, G. J. (2015). Mathematical model of the
contribution of water conservancy investment to
national economic growth. Water Conservancy
Economics, 1, 36-37.
Li, J. W., & Ju, Z, J. (2021). Research on the Evaluation of
the Quality of Marine Economic Development in
Analysis of the Impact of Water Conservancy Investment on High-quality Economic Development in Western China
339

Guangdong Province. Journal of Henan University of
Technology (Social Sciences Edition), 37(01), 14-21
Liu, Z. X. (2020). Evaluation of China's economic
development quality based on new development
concepts. Times Finance, 29, 1-3+12.
Ma, G. Q., & Chen, F. (2020). Study on the evaluation of
regional economic development quality of prefecture-
level cities in Shandong Province. Journal of Qingdao
University (Natural Science Edition), 33(04), 110-114.
Pan, Y. R., & Luo, L. W. (2020). The impact of
infrastructure investment on high-quality economic
development: a study on mechanism of action and
heterogeneity. Reform, 6, 100-113.
Peng, D. Y., & Zhu, M. T. (2020). Priority analysis and
measurement of factors affecting high-quality
economic development. Ecological Economy, 36(12),
50-56+76.
Qiao, M. H. (2021). Environmental Regulation, Spatial
Spillover and High-quality Economic Development: An
Empirical Study Based on the Dubin Model of
Provincial Panel Space in China. Ecological Economy,
37(04), 147-155.
Qiu, H. W. (2020). Research on the Measurement Method
of Shaanxi Water Conservancy Infrastructure
Investment Scale Considering the Congestion Effect.
Shaanxi Water Resources, 2, 192-193+196.
Ran, Z., & Zheng, J. H. (2021). Innovative Ability and
High-quality Development of Regional Economy-An
Analysis Based on the Perspective of Technological
Differences. Shanghai Economic Research, 4, 84-99.
Sun, X. X., & Zhou, X. L. (2019). Transportation
infrastructure investment, factor market distortion and
economic growth. Transportation System Engineering
and Information, 19(01), 13-18.
Wan, Y. Y., Su, H. Y., and Liu, J. (2020). Regional
coordination evaluation of ecological civilization
construction and high-quality economic development.
Statistics and Decision, 36(22), 66-70.
Wang, Y., Ni, P. T., & Wei, J. B. (2019). Research on the
contribution rate of water conservancy investment to
the economy in Guangdong Province. Guangdong
Water Resources and Hydropower, 4, 76-78+83.
Wang, Y. (2017). Research on Rural Water Conservancy
Investment in Hanjiang District, Yangzhou City. China:
Yangzhou University.
Wang, Y. B., & Wang, Y. Y. (2019). Taking multiple
measures simultaneously to promote high-quality
industrial development in the western region. People's
Forum, 35
, 90-91.
Xu, B., & Li, W. (2012). Analysis of the promotion effect
of water conservancy investment on economic growth.
Water Conservancy Development Research, 12(03), 11-
15+31.
Zhao, D. (2013). Research on the optimization of the
internal structure of the tertiary industry in my country.
Dalian: Dalian Maritime University.
WRE 2021 - The International Conference on Water Resource and Environment
340
