
Evaluation and Spatial Distribution of Soil and Water Conservation
Efficiency in Shaanxi Province based on DEA Model
Zhonghao Wang, Ni Wang
*
, Yuan Xiu, Jie Hou, Anfeng Qiang and Haodong Wang
State Key Laboratory of Eco-Hydrologic Engineering in Northwest Arid Region, Xi'an University of Technology, Xi'an
710048, China
Keywords: Benefits of soil and water conservation, Efficiency evaluation, Data Envelopment Analysis (DEA), Spatial
distribution pattern
Abstract: Soil and water conservation is an effective measure to ensure the sound operation of ecology, economy and
society. The correct evaluation of the efficiency of soil and water conservation and its regional differences is
an important prerequisite for optimizing soil and water conservation policies and measures. Taking Shaanxi
Province as the research object, after counting and calculating the investment and total income of soil and
water conservation from 2018 to 2019, the efficiency and spatial distribution of soil and water conservation
in Shaanxi Province are analyzed by using the method of data envelopment analysis. The results show that
the comprehensive technical efficiency of 18.2% of administrative regions in the province reached the best
state, among which 82% of pure technical efficiency reached the optimal state and the gap between individuals
was not large. Scale efficiency was the leading factor leading to the low comprehensive technical efficiency.
There were obvious differences among cities (districts), showing the spatial distribution characteristics of
high in the middle and low on both sides, high in the north and low in the south, high in the Yellow River
Basin, and low in the Yangtze River Basin. Tongchuan was a key area to optimize the efficiency of soil and
water conservation.
1 INTRODUCTION
Since the implementation of the western development
strategy, Shaanxi provincial government has paid
more attention to soil and water conservation. The
whole province has thoroughly implemented the
thought and concept of ecological civilization, firmly
established the concept that "green water and green
mountains are golden mountains and silver
mountains", adopted preventive protection,
comprehensive treatment and ecological restoration
measures, and adhered to the comprehensive
treatment of mountains, rivers, forests, fields, lakes
and grasses with small watersheds as a unit.
Significant achievements have been made in water
and soil conservation, and promoted its economic and
social development. Therefore, the corresponding
evaluation work is particularly important.
In recent years, as the government attaches great
importance to ecological construction, the research on
the benefits of soil and water conservation has
attracted extensive attention from the society. The
change of soil organic matter content in different
vegetation after rainfall is used to evaluate the
ecological benefit of soil and water conservation by
Hernandez et al. (2005). According to 11 economic
and social indicators, market price method was used
to evaluate the benefits of soil and water conservation
measures by Balana et al. (2012). The GBAT toolkit
was used to assess the feasibility of water
conservation measures based on five upstream and
downstream indicators of the watershed by Hunink et
al. (2012). Mishra & Rai (2014) quantified the main
costs and benefits of various soil and water
conservation measures implemented in the study area
through six indicators such as economy and
environment. Based on the existing evaluation
indexes and methods, Kang et al. (2002) used analytic
hierarchy process to evaluate and analyze the soil and
water conservation benefits of Typical Small
Watersheds in the Loess Plateau. Yang et al. (2010)
evaluated the benefits of water and soil conservation
of hillside ditch, grass ditch and other technologies in
red soil area. The CCR model and BBC model in data
Envelopment analysis (DEA) are used to analyze and
evaluate the efficiency of soil and water conservation
322
Wang, Z., Wang, N., Xiu, Y., Hou, J., Qiang, A. and Wang, H.
Evaluation and Spatial Distribution of Soil and Water Conservation Efficiency in Shaanxi Province based on DEA Model.
In Proceedings of the 7th International Conference on Water Resource and Environment (WRE 2021), pages 322-332
ISBN: 978-989-758-560-9; ISSN: 1755-1315
Copyright
c
2022 by SCITEPRESS – Science and Technology Publications, Lda. All rights reserved
in Changzhi Project in Sichuan by Wu Detao (2011).
Jin Shilai (2012) analyzed the significance of
monetization of soil and water conservation benefits,
and tried to use the advantages of economics and
ecology to explore a systematic scheme for
monetization evaluation of soil and water
conservation benefits. DEA method was used to
analyze and evaluate the technical efficiency of soil
and water conservation of black land in Heilongjiang
Province from 2003 to 2012, and Tobit model was
used to test and analyze it by Yang et al. (2015).
Based on the accounting of ecological benefits of soil
and water conservation, Qin et al. (2015) used DEA
model to evaluate the efficiency of eleven counties
and districts of San Jiangyuan and put forward the key
points and relevant suggestions for future treatment
work. Zheng et al. (2016) quantitatively evaluated the
ecological, economic, social, flood control and
disaster reduction benefits of small watersheds in
Guangdong Province under water and soil
conservation measures. As a social project, soil and
water conservation is closely related to the
development of social economy. Throughout the past
research, more scholars tend to evaluate the benefits
of soil and water conservation measures through
various indicators, ignore the relevant research on the
evaluation of their efficiency.
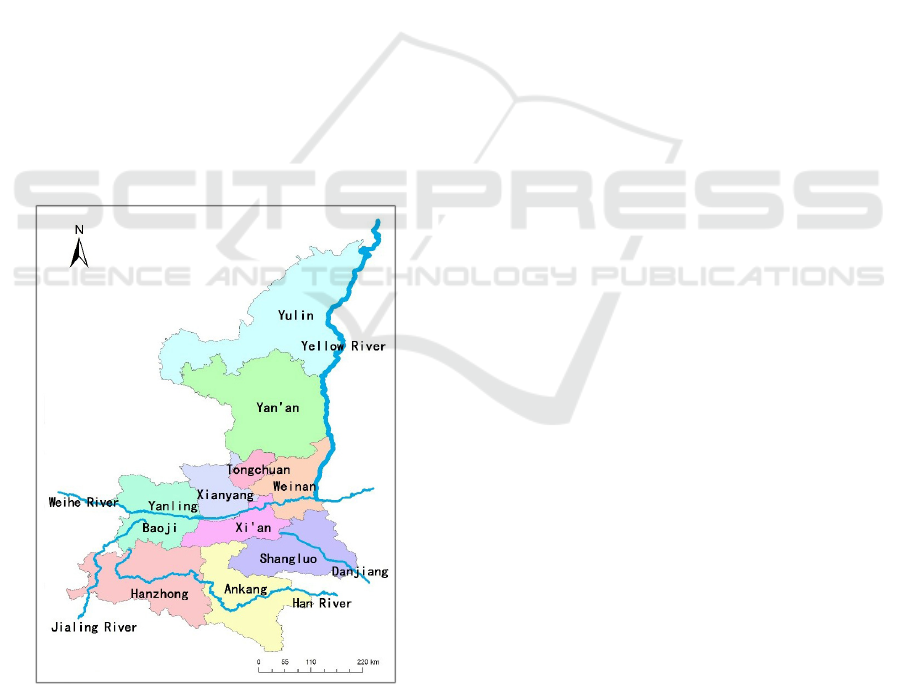
Figure 1: Schematic diagram of Shaanxi Province.
This paper studies the efficiency of soil and water
conservation management and finds out the
advantages and disadvantages of each region by
scientifically and reasonably evaluating the benefits
of soil and water conservation measures and
comparing and analyzing the benefits of soil and
water conservation among different regions, which
can provide data support for the government to
summarize the experience of soil and water
conservation management in the past. It is also helpful
to rationally adjust the planning and investment
decision of soil and water conservation in the future.
Therefore, taking Shaanxi Province, a key province of
soil and water conservation, as an example, this study
evaluated the efficiency of comprehensive soil and
water loss control and analyzed the spatial
distribution pattern of soil and water conservation
efficiency of each city (district) in Shaanxi Province
with the help of DEA model on the basis of
calculating the benefits generated by soil and water
conservation measures in 2018-2019. The research
results are of significance for improving the quality of
soil and water conservation in Shaanxi Province.
2 STUDY AREA AND DATA
2.1 Overview of the Study Area
Shaanxi Province is mainly divided into three regions:
Northern Shaanxi (Yulin City and Yan'an City),
Guanzhong (Xi'an City, Xianyang City, Baoji City,
Weinan City, Tongchuan City and Yangling District)
and southern Shaanxi (Hanzhong City, Ankang City
and Shangluo City), and spans the Yangtze River and
the Yellow River. As shown in the figure 1. Among
them, Northern Shaanxi and Guanzhong belong to the
Yellow River Basin and southern Shaanxi belongs to
the Yangtze River Basin. At the same time, Shaanxi
Province has complex terrain and various types of soil
erosion, which is one of the most serious areas of soil
and water loss in China. The Yellow River has less
water and more sediment, and 90% of the coarse
sediment deposited in the middle and lower reaches
comes from Shaanxi. This undoubtedly makes soil
and water conservation and ecological restoration in
Shaanxi very important (Xiu et al., 2018). Since the
21st century, Shaanxi Province has comprehensively
promoted the comprehensive control of soil and water
loss, strengthened the ecological restoration of soil
and water conservation, effectively controlled the soil
and water loss in the Loess Plateau, pushed the green
territory of Shaanxi northward by 400km, reduced the
sediment entering the Yellow River by 5.9 billion
tons, and realized the fundamental transformation of
the regional ecological environment from "overall
Evaluation and Spatial Distribution of Soil and Water Conservation Efficiency in Shaanxi Province based on DEA Model
323
deterioration and local improvement" to "overall
improvement and local virtuous circle".
By the end of 2019, the total area of water and soil
loss in 11 cities (districts) in the province had been
reduced to 64747.96 square kilometers, accounting
for 31.49% of the land area of the province. From
2018 to 2019, eleven cities (districts) in the province
completed a total area of 5935.89 square kilometers
of comprehensive control and ecological restoration
of water and soil loss, 54 new water and soil
conservation science and technology demonstration
parks, 126.90 square kilometers of clean small
watershed control area, and 56 water and soil
conservation monitoring stations covering the
province, with a total investment of 3.511 billion
yuan.
2.2 Research Data
Collect and sort out the data related to water and soil
conservation of cities (districts) in Shaanxi Province
from 2018 to 2019.The main sources are the bulletin
of soil and water conservation of Shaanxi Province
(2018-2019) (http://sthjt.shaanxi.gov.cn/) and the
statistical yearbook of Shaanxi Province
(http://tjj.shaanxi.gov.cn/).
3 RESEARCH METHODS
3.1 Benefit Accounting of Water and
Soil Conservation
Soil and water conservation has achieved remarkable
results in Shaanxi Province, and its benefits mainly
include water storage and soil conservation benefits,
economic benefits, ecological benefits and social
benefits. The relationship between the four is as
follows: based on the benefits of water storage and
soil conservation, economic benefits, social benefits
and ecological benefits are generated (General
Administration of Quality Supervision, Inspection
and Quarantine of the People's Republic of China &
China National Standardization Administration
Committee., 2009). At the same time, in order to
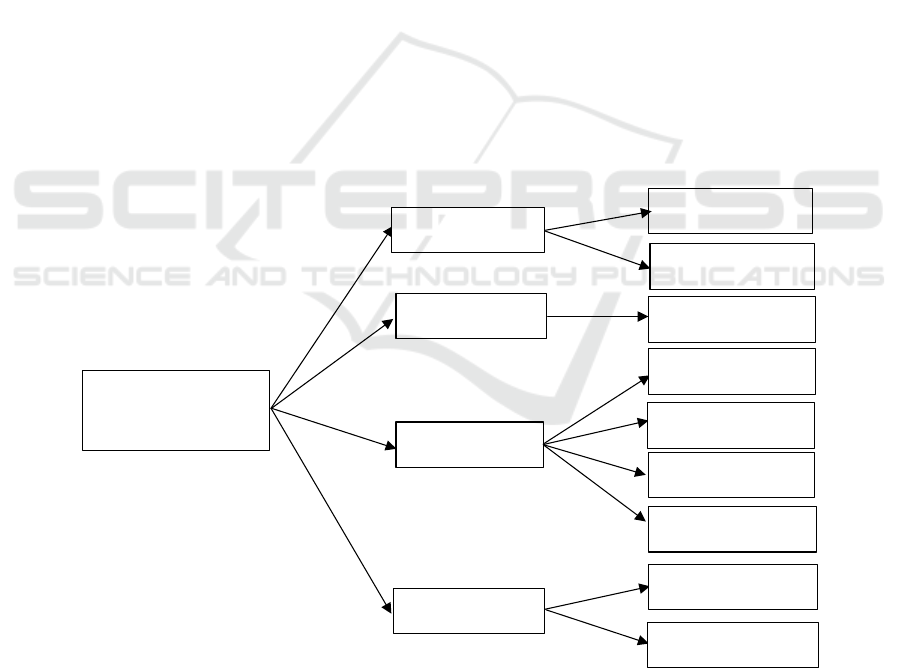
comprehensively quantify the benefits of soil and
water conservation in Shaanxi Province, nine indexes
are selected according to the principles of objectivity,
independence, hierarchy, operability and
quantification. The detailed indicator system is shown
in Figure 2.
Benefits of soil and water
conservation in Shaanxi
Province
Water storage and soil
conservation benefits
Economic benefits
Ecological benefits
Social benefits
Water storage benefits
Conservation benefits
Economic benefits
Soil fertilizer
conservation benefits
Carbon sequestration
benefits
Oxygen release benefits
Air purification benefits
Reduce abandoned land
Reduce sedimentation
Figure 2: Index system of soil and water conservation benefit in Shaanxi Province.
WRE 2021 - The International Conference on Water Resource and Environment
324

3.1.1 Benefits of Water Storage and Soil
Conservation
There are two main methods to calculate the benefits
of water storage and soil conservation: water
conservation and hydrology. The water conservation
method refers to the comprehensive calculation of soil
and water conservation benefits of the whole basin by
using single measures of soil and water conservation.
Hydrological method is based on rainfall, runoff and
sediment data measured at hydrological stations or
runoff stations, and uses statistical correlation
analysis to calculate the efficiency of water storage
and soil conservation after the implementation of soil
and water conservation measures in the whole basin
(Xu et al., 2018). Based on the characteristics of the
above methods, this paper mainly uses the water
conservation method to calculate.
(1) Water storage benefits
𝐵
=
∑
𝑊
×𝑃
(1)
Where: 𝐵
is water storage benefit;
∑
𝑊
is
the total amount of water stored by various treatment
measures; 𝑃
is the price per unit of water storage.
Among them:
𝑊
=𝐹
×∆𝛾
(2)
Where: 𝑊
is the storage capacity of measure 𝑖;
𝐹
is the treatment area of measure 𝑖; ∆𝛾
is the
runoff modulus reduced by measure 𝑖.
(2) Conservation benefits
𝐵
=
∑
𝑆
×𝑃
(3)
Where: 𝐵
is soil conservation benefit;
∑
𝑆
is
the total amount of soil preserved by various
treatment measures; 𝑃
is the average income per
unit area. Among them:
𝑆
=𝐹
×∆𝛾
(4)
Where: 𝑆
is the soil conservation amount of
measure 𝑖 ; 𝐹
is the treatment area of
measure 𝑖 ; ∆𝛾
is the runoff modulus reduced by
measure 𝑖.
3.1.2 Economic Benefits
Based on the control area of each measure and
combined with the income per unit area, the economic
benefits of water and soil conservation are calculated
as follows:
𝐶=
∑
𝑆
×𝑃
(5)
Where: 𝐶 is economic benefit;
∑
𝑆
is the
treatment area of measure 𝑖 ; 𝑃
is the average
income per unit area of measure 𝑖.
3.1.3 Ecological Benefits
The ecological benefits of soil and water conservation
refer to the added values of soil fertilizer
conservation, carbon fixation, oxygen release and
atmospheric purification after a period of ecological
construction activities of soil and water conservation.
(1) Soil fertilizer conservation benefits
𝑉
=𝑝×ℎ×𝑆
×𝜌×𝑘 (6)
Where: 𝑉
is the soil fertilizer retention benefit;
𝑆
is the newly added woodland area; 𝜌 is soil bulk
density; ℎ is soil thickness; 𝑝 is the unit price of soil
nutrients and organic matter; 𝑘 stands for soil
organic matter content.
(2) Carbon sequestration benefits
According to the photosynthesis equation, forest
photosynthesis can fix CO
2
, that is, the system can fix
1.63g CO
2
per 1.00kg plant dry matter produced.
Namely:
𝑉
=1.63×𝑍
×𝑃
×𝑆
×𝑅
(7)
Where: 𝑉
is carbon sequestration benefit; 𝑍
is
the productivity of the protected area; 𝑃
is the carbon
tax price; 𝑆
is the newly added woodland area; 𝑅
is
the carbon content of CO
2
, which is 27.27%.
(3) Oxygen release benefits
The simultaneous release of 1.20g O
2
by forest
photosynthetic fixation of CO
2
adopts the alternative
market value method, and the calculation formula is:
𝑉
=1.19×𝑍
×𝑃
×𝑆
(8)
Where: 𝑉
is the benefit of oxygen release; 𝑍
is the productivity of protected areas; 𝑃
is the price
of producing oxygen; 𝑆
is the newly added
woodland area.
(4) Air purification benefits
The benefits of air purification mainly include the
benefits of SO
2
absorption by forest and dust retention.
The calculation formula is:
𝑉
=
∑
𝐾
×𝑆
×𝑃
(9)
Where: 𝑉
is the annual air purification benefit of
the protected area;
∑
𝐾
is the air purification
Evaluation and Spatial Distribution of Soil and Water Conservation Efficiency in Shaanxi Province based on DEA Model
325

capacity of the i-type forest; 𝑆
is the area of the i-
type forest land; 𝑃
is the price of the i-type forest
land to reduce pollutants.
3.1.4 Social Benefits
Social benefits refer to the benefits brought by the
implementation of water and soil conservation
measures, such as reducing drought and flood
disasters, improving agricultural production
conditions, improving disaster prevention and
reduction capacity, reducing siltation on rivers,
reservoirs and ponds, protecting transportation,
industrial and mining, water conservancy, electric
power, tourism facilities, urban and rural
construction, safety of people's lives and property,
and promoting regional economic development.
Therefore, this paper mainly considers the social
benefits from two aspects: reducing abandoned land
and reducing sediment accumulation.
(1) Reduce abandoned land
𝐿
=𝑆
×𝑃
/(𝜌 × ℎ) (10)
Where: 𝐿
is to reduce the value of abandoned
land; 𝑆
is the amount of soil and water conservation;
𝑃
is the average opportunity cost of abandoned land;
𝜌 is soil bulk density; ℎ is soil thickness.
(2) Reduce sedimentation
𝐿
=𝑆
×∅×𝑃
(11)
Where: 𝐿
is the value of reducing sediment
deposition; 𝑆
is the amount of soil and water
conservation; ∅ for sedimentation ratio; 𝑃
i s t h e
cost of manual cleaning of sediment deposition.
3.2 Evaluation of Soil and Water
Conservation Efficiency
DEA model is a nonparametric statistical method
proposed by Charnes et al. in 1978 to evaluate the
relative effectiveness between different decision-
making units (DMU) with the same type of multi-
input and multi-output by using mathematical
programming model (Inverno et al., 2018). It mainly
projects the input-output values of all DUM in the
efficiency space, and finds the efficiency envelope
frontier. DUM located on the frontier (its efficiency
value is 1), and the input-output combination reaches
the optimal state, that is, the minimum input under a
given output or the maximum output under a given
output. At the same time, according to the distance
between each DMU and the effective production
front, determine whether each DMU is DEA
effective, and then use the projection method to point
out the reason of DEA invalid and the direction and
degree of improvement.
DEA method includes many models. In this study,
variable scale Output-DEA-BCC model is adopted,
which takes into account the changes of Output scale
and marginal effect, and is more suitable for analyzing
the benefits of soil and water conservation. In this
model, the comprehensive technical efficiency value
(CTE) is the product of pure technical efficiency (PTE)
and scale efficiency (SE), where PTE represents the
production efficiency of DMU at a certain scale, and
SE represents the gap between the actual scale and the
optimal production scale. The form of the model is as
follows:
𝑚𝑎𝑥𝜃 (12)
∑
𝑥
𝜆
+𝑠
=𝜃𝑥
(13)
∑
𝑦
𝜆
−𝑠
=𝑦
(14)
𝑠
≥0,𝑠
≥0 (15)
∑
𝜆
=1,𝑗 =1,2,⋯𝑛 (16)
Where, 𝜃 is the efficiency value of the JTH
DMU, and it satisfies 0≤𝜃 ≤1; 𝑥
and 𝑦
are
respectively the input and output of DMU; 𝑠
is the
relaxation variable, that is, the quantity of output to be
increased; 𝑠
is the residual variable, that is, the
input amount that needs to be reduced to achieve the
optimal configuration; 𝜆 is the weight coefficient.
Taking formula (12) as the objective function and
formula (13) ~ formula (15) as the constraint function,
the 𝜃 value obtained is CTE; Formula (12) is the
objective function, formula (13) ~ formula (16) is the
constraint function, and the 𝜃 value obtained is PTE.
We can find SE by the ratio of CTE to PTE. Among
them:
When 𝐶𝑇𝐸 = 1 (DEA is valid), it indicates that
the DMU is valid in resource configuration.
When 𝐶𝑇𝐸 < 1 (DEA is invalid), if the PET is 1
and the SE is less than 1, it indicates that the scale of
DMU does not match the input and output, and the
scale needs to be increased or decreased. If the PTE
and SE are less than 1, if there is 𝑆
>0, it indicates
that the j-th input index is redundant; If there is 𝑆
>
0, the output of the i-th output index is insufficient.
WRE 2021 - The International Conference on Water Resource and Environment
326
4 RESULTS AND ANALYSIS
4.1 Benefits of Soil and Water
Conservation in Shaanxi Province
According to the bulletin of soil and water
conservation of Shaanxi Province (2018-2019) and
the statistical yearbook of Shaanxi Province, the
comprehensive control of soil and water loss in
Shaanxi Province from 2018 to 2019 is shown in
Table 1.
According to the calculation formula of the above
benefit indicators and the relevant data found on the
official website of Shaanxi Provincial Department of
ecological environment and Shaanxi Provincial
Bureau of statistics, the water and soil conservation,
economic, ecological and social benefits generated by
soil and water conservation measures in Shaanxi
Province from 2018 to 2019 are 680 million yuan, 894
million yuan, 248 million yuan and 46.004 billion
yuan respectively, with a total benefit of 47.826
billion yuan. Among them, the highest benefit is
17.723 billion yuan in Northern Shaanxi, 14.958
billion yuan in Guanzhong and 15.145 billion yuan in
southern Shaanxi. See Table 2 for detailed calculation
results.
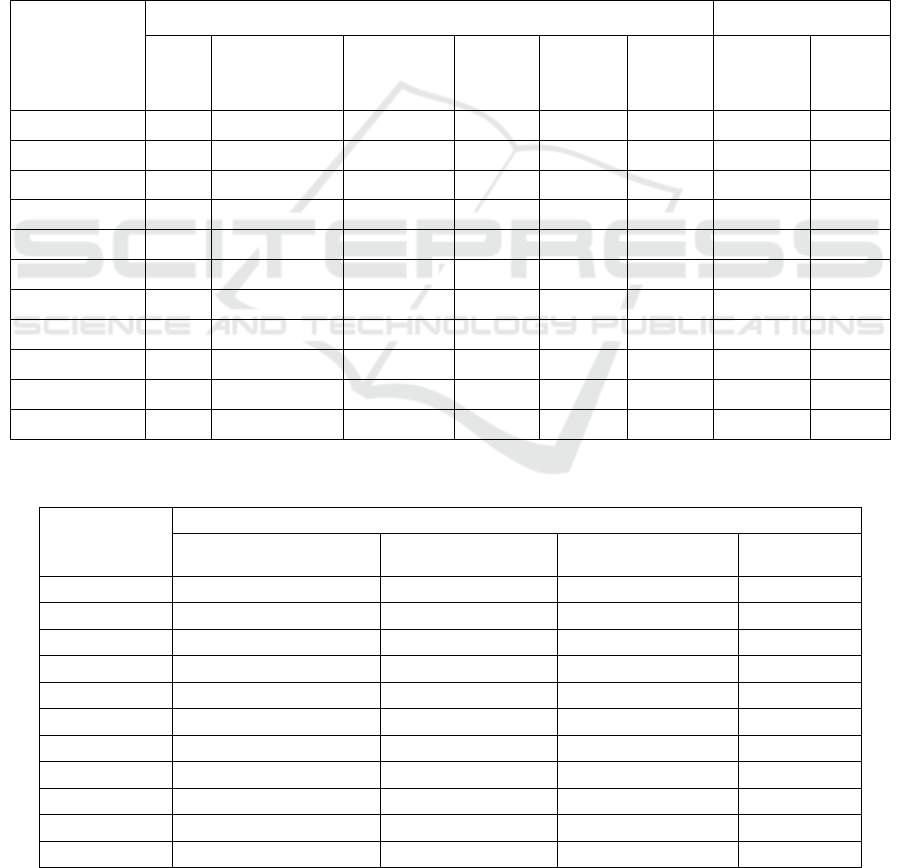
Table 1: Statistics of comprehensive control of soil and water loss in Shaanxi Province (2018~2019).
Administrative
region
Control measures(km
2
) Input(10
4
CNY)
terrace
soil and water
conservation
forest
economic
forest
artificial
grass
p
lantin
g
closed
treatment
Other
measures
Central and
provincial
Local
Xi'an 8.6 100.72 14.66 1.29 86.41 6.39 406.89 45.11
Baoji 66.62 55.14 38.83 0.14 179.25 20.01 1327.65 137.35
Xianyang 56.96 133.5 61.58 1.69 196.95 2.32 6860.22 573.78
Tongchuan 17.68 81.1 29.46 0 68.18 0.73 1627.36 137.30
Weinan
54.08 146.67 63.25 16.47 173.06 78.11 6742.04 707.96
Yan'an 86.45 479.51 111.02 10.2 349.6 53.66 15176.09 1077.91
Yulin 163.27 640.91 156.89 35.73 296.28 32.8 18692.24 1672.76
Hanzhong 67.78 182.49 138.82 5.01 193.38 25.68 5534.65 518.35
Ankang 45.42 188.06 118.45 0.03 274.04 8.24 6346.19 686.81
Shangluo 43.04 127.41 49.01 0.48 289.09 0.31 5692.24 572.76
Yangling 0 1.8 0 0 1.2 0 159.94 35.06
Table 2: Estimation of soil and water conservation benefits in Shaanxi Province (2018~2019).
Administrative
region
Benefits of soil and water conservation(10
4
CNY)
Water storage and soil
conservation benefits
Economic benefits Ecological benefits
Social
b
enefits
Xi'an 2154.04 2240.21 140862.70 203.89
Baoji 3189.81 5002.49 113624.66 516.12
Xianyang 6001.54 8041.00 517572.25 2620.28
Tongchuan 1986.63 3740.39 133485.73 392.55
Weinan 6844.98 8620.14 533334.25 3047.63
Yan'an 12110.32 15181.85 725297.43 4567.08
Yulin 16911.84 25191.68 966370.86 6622.63
Hanzhong 5779.62 5061.86 403985.75 1587.25
Ankang 6639.59 8154.87 570104.16 2665.68
Shangluo 6367.25 8012.58 493582.00 2525.22
Yangling 31.63 103.10 2173.25 50.88
Evaluation and Spatial Distribution of Soil and Water Conservation Efficiency in Shaanxi Province based on DEA Model
327
4.2 Evaluation of Soil and Water
Conservation Efficiency and Spatial
Distribution Pattern
The DMU is the object of efficiency evaluation. Each
DMU transforms a certain number of production
factors into products in the production process and
tries to achieve its own decision-making objectives.
Therefore, they all show certain economic
significance. In the performance evaluation of
benefits of soil and water conservation in Shaanxi
Province, this paper makes a horizontal comparison
of multiple regions, so 11 soil and water conservation
ecological restoration demonstration cities (districts)
in Shaanxi Province during the same period (2018-
2019) are selected as DMU to study its relative
effectiveness.
Based on the above accounting of benefits of
water and soil conservation in Shaanxi province, the
input indexes of this evaluation are determined as:
central and provincial input, local input; Output
indicators include: water storage and soil
conservation benefits, economic benefits, ecological
benefits and social benefits. The specific values of
each index are shown in Table 3.
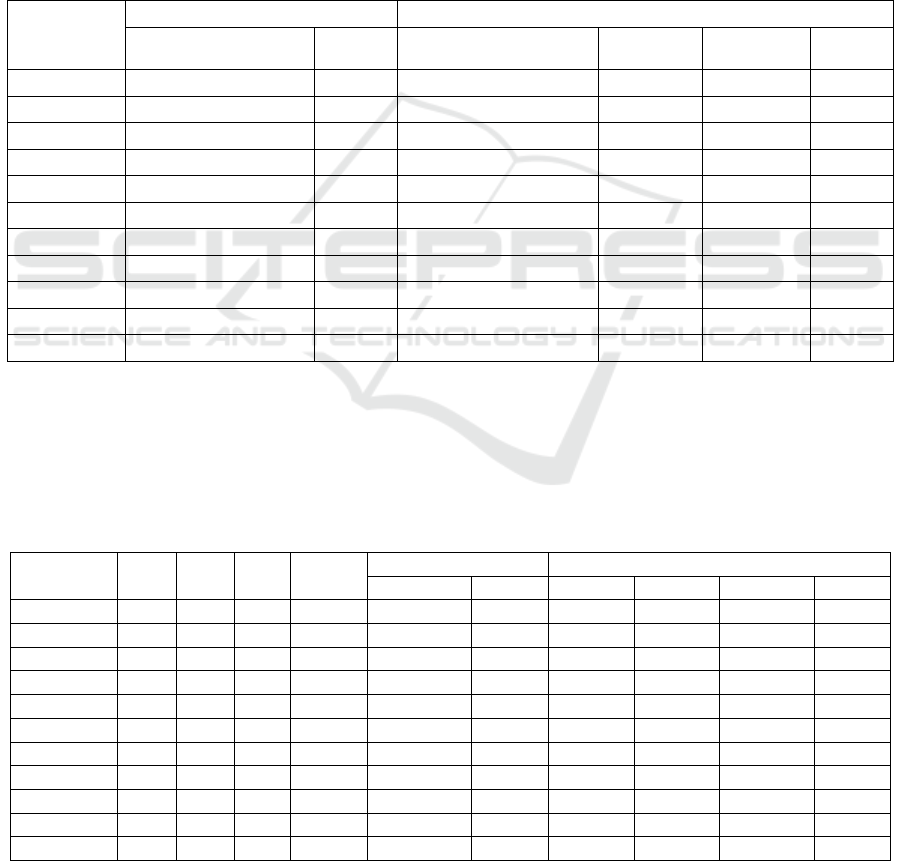
Table 3: Input/output data of soil and water conservation project (unit: 10
4
CNY).
DMU
Input index (input) Output index (benefit)
Central and provincial Local
Water storage and soil
conservation benefits
Economic
b
enefits
Ecological
b
enefits
Social
b
enefits
Xi'an 406.89 45.11 2154.04 2240.21 140862.70 203.89
Baoji 1327.65 137.35 3189.81 5002.49 113624.66 516.12
Xianyang 6860.22 573.78 6001.54 8041.00 517572.25 2620.28
Tongchuan 1627.36 137.30 1986.63 3740.39 133485.73 392.55
Weinan 6742.04 707.96 6844.98 8620.14 533334.25 3047.63
Yan'an 15176.09 1077.91 12110.32 15181.85 725297.43 4567.08
Yulin 18692.24 1672.76 16911.84 25191.68 966370.86 6622.63
Hanzhong 5534.65 518.35 5779.62 5061.86 403985.75 1587.25
Ankang 6346.19 686.81 6639.59 8154.87 570104.16 2665.68
Shangluo 5692.24 572.76 6367.25 8012.58 493582.00 2525.22
Yangling 159.94 35.06 31.63 103.10 2173.25 50.88
The special DEA model calculation software
DEAPVersion2.1 was used to solve the problem.
Table 4 and Figure 3 were obtained after sorting out
the results of program operation. In order to
reasonably evaluate the benefit performance of soil
and water conservation in 11 cities (districts), this
paper carries out effectiveness analysis and projection
value analysis in turn.
Table 4: calculation results of effectiveness of benefits of water and soil conservation.
DMU CTE PTE SE
Scale
reward
Remaining variables Slack variable
𝑆
𝑆
𝑆
𝑆
𝑆
𝑆
Xi'an 1.00 1.00 1.00 - 0.00 0.00 0.00 0.00 0.00 0.00
Baoji 0.83 1.00 0.83 drs 0.00 0.00 0.00 0.00 0.00 0.00
Xianyang 1.00 1.00 1.00 - 0.00 0.00 0.00 0.00 0.00 0.00
Tongchuan 0.63 0.88 0.72 drs 214.62 0.00 1050.58 530.52 18933.02 169.02
Weinan 0.95 1.00 0.95 drs 0.00 0.00 0.00 0.00 0.00 0.00
Yan'an 0.93 1.00 0.93 drs 0.00 0.00 0.00 0.00 0.00 0.00
Yulin 0.87 1.00 0.87 drs 0.00 0.00 0.00 0.00 0.00 0.00
Hanzhong 0.67 0.94 0.72 drs 0.00 0.00 382.54 2852.16 26738.65 629.9
Ankang 0.86 1.00 0.86 drs 0.00 0.00 0.00 0.00 0.00 0.00
Shangluo 0.97 1.00 0.97 drs 0.00 0.00 0.00 0.00 0.00 0.00
Yangling 0.64 1.00 0.64 irs 0.00 0.00 0.00 0.00 0.00 0.00
WRE 2021 - The International Conference on Water Resource and Environment
328

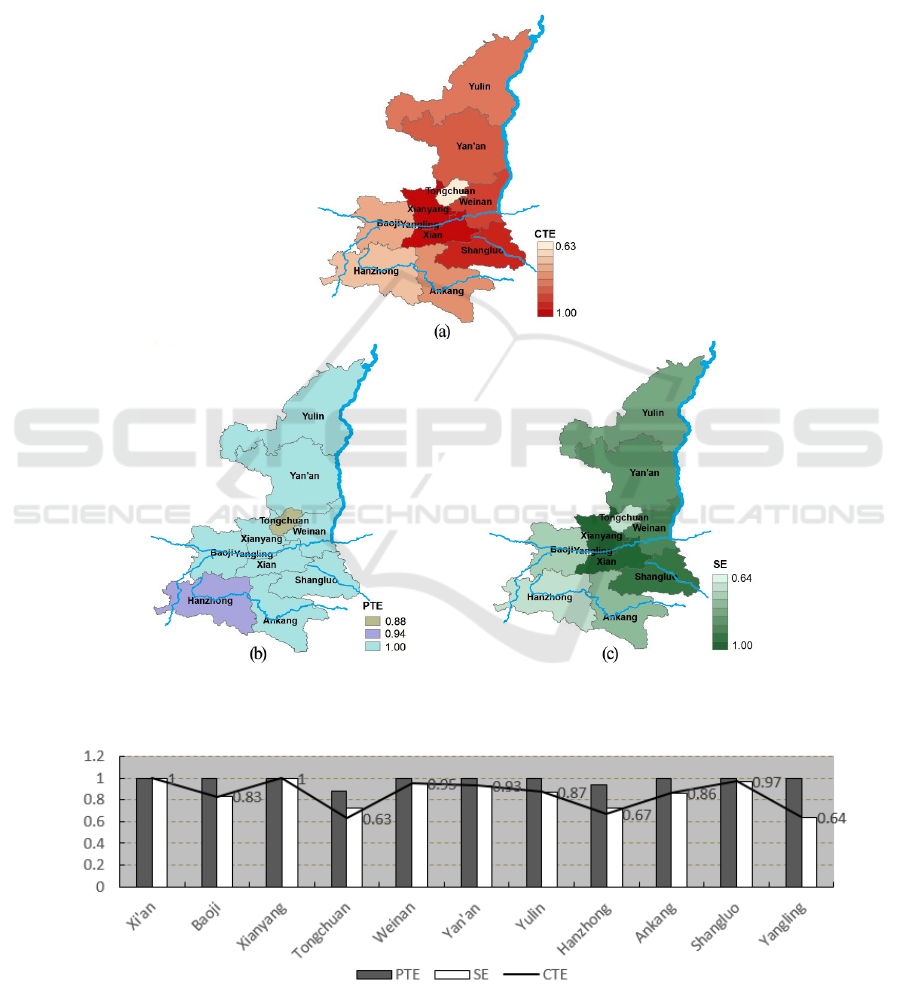
4.2.1 Pure Technical Efficiency Analysis
Through PTE analysis, the management and technical
input-output level of water and soil conservation
projects in 11 cities (districts) can be analyzed and
evaluated horizontally. It can be seen from table 3 that
except Tongchuan City and Hanzhong City, the other
9 cities (districts) are pure technology effective (is 1),
accounting for 82% of all DMU. This shows that in
the process of soil and water conservation and
ecological protection construction, the input and
output of these areas are at the forefront of production,
and their management level and technical input are
relatively reasonable. For cities (districts) where pure
technology is not effective (less than 1), the minimum
value is 0.88 of Tongchuan City, indicating that the
structure, management and technical level of
investment need to be slightly adjusted in these two
regions.
Figure 3(b) shows the distribution of PTE in
Shaanxi Province. Northern Shaanxi is the key area of
the comprehensive control of soil erosion in Shaanxi
province and even the whole country. The local
management measures and technical methods are
relatively mature, and PTE in Yan'an and Yulin are
both effective; In Guanzhong area, PTE is invalid
only in Tongchuan City; Among the three cities in
southern Shaanxi, only Hanzhong's PTE is invalid. At
the same time, it shows that the Yellow River Basin in
Shaanxi Province is better than the Yangtze River
Basin.
4.2.2 Return to Scale Analysis
As can be seen from Table 4, among the 11 cities
(districts) in Shaanxi Province, only Xi 'an and
Xianyang have effective SE (return to scale remains
unchanged), indicating that the scale of soil and water
conservation matches the comprehensive benefits of
input and output, and the scale is appropriate.
However, only Yangling District has an increasing
return to scale in SE invalid areas, which indicates
that a higher proportion of benefit output can be
brought by appropriately increasing the input on the
basis of the existing input, so the input scale of soil
and water conservation in Yangling District should be
increased. The return to scale in other regions is
regressive, indicating that if the input is appropriately
increased on the basis of the existing input in these
regions, the output of benefits will not increase by a
higher proportion.
As can be seen from the spatial distribution of SE
(Figure 3(c)), the overall distribution pattern of SE
decreases from the central part to both sides, and the
distribution pattern of SE in northern Shaanxi is better
than that in southern Shaanxi.
4.2.3 Comprehensive Efficiency Analysis
CTE reflects the effectiveness of DEA, and PTE and
SE are its influencing factors. For the convenience of
analysis and comparison, the partial running results of
DEAP software are translated here as shown in Figure
4. Among them, The CTE is 1 in Xi'an City and
Xianyang City, indicating that the relative efficiency
of soil and water conservation benefits reached the
best state. The DMU with invalid DEA includes two
types: one is caused by SE is less than 1, which
accounts for about 82% of the whole region, including
Baoji City, Weinan City, Yan'an City, Yulin City,
Ankang City, Shangluo City and Yangling District.
Their PTE is 1, and their low CTE is caused by low
SE. Therefore, it is necessary to take corresponding
measures (see return to scale analysis) to change their
SE in order to improve the CTE. Second, the PTE and
SE are less than 1, including Tongchuan City and
Hanzhong City. It shows that the scale of water and
soil conservation in these urban areas is improper and
the management technology level needs to be
improved. Each urban area can change the input scale
or input-output structure and improve the
management technology level according to its own
specific situation, so as to increase the comprehensive
benefits of soil and water conservation.
The spatial distribution pattern of CTE in Figure
3(a) also shows a gradually decreasing distribution
pattern from central to north and south, but
Tongchuan City and Yangling District with the lowest
CTE are located in Guanzhong Region. The CTE in
the Yangtze River basin of Shaanxi province is high
in the east and low in the west.
4.2.4 Projection Value Analysis
According to the calculation results of DEAP
software and the above effectiveness analysis. The
nine effective DMU of PTE constitute the enveloping
front of comprehensive benefit data of soil and water
conservation. However, the other two regions do not
reach the data envelope frontier. Through the analysis
of projection values, the causes of the problems can
be found out and the improvement methods can be
sought. As can be seen from Table 4, the two regions
with invalid DEA both have the problem of
insufficient output of comprehensive benefits, and
Tongchuan City also has input redundancy. From the
specific data, Hanzhong City needs to take relevant
measures to improve the water storage and soil
Evaluation and Spatial Distribution of Soil and Water Conservation Efficiency in Shaanxi Province based on DEA Model
329
conservation benefits of 3.8254 million yuan,
economic benefits of 28.5216 million yuan,
ecological benefits of 267.3865 million yuan and
social benefits of 6.299 million yuan, respectively, in
order to achieve the effective DEA. In order for
Tongchuan, which has diminishing returns to scale, to
achieve a relatively effective state, its central and
provincial investment needs to be reduced by RMB
2.1462 million, and its water storage and soil
conservation benefits, economic benefits, ecological
benefits and social benefits should be improved on the
basis of strengthening management and introducing
new technologies. It should increase by 10.5058
million yuan, 5.3052 million yuan, 189.3302 million
yuan and 1.6902 million yuan respectively.
Figure 3: Spatial distribution of water and soil conservation efficiency in Shaanxi Province.
Figure 4: Analysis and comparison of comprehensive efficiency of water and soil conservation in 11 cities (districts) of
Shaanxi Province.
WRE 2021 - The International Conference on Water Resource and Environment
330

5 CONCLUSIONS
(1) From 2018 to 2019, the benefits of water and soil
conservation investment in Shaanxi Province were
divided into four categories: water and soil
conservation, economy, society and ecology, which
were 680 million yuan, 894 million yuan, 248 million
yuan and 46.004 billion yuan respectively, with a total
benefit of 47.826 billion yuan.
(2) In 11 cities (districts) of Shaanxi Province, the
effective ratio of comprehensive technical efficiency
of input and output benefits of soil and water
conservation was only 18.2%;The cities (districts)
with pure technical efficiency accounted for 82%, and
the overall technical and management level of the
whole province was relatively high; Cities (districts)
with effective scale accounted for 18.2%.Based on the
analysis of three kinds of efficiency and projection
value, optimizing the investment scale and investment
structure was the focus of soil and water conservation
in the province in the future. Tongchuan City should
not only optimize the investment scale and structure,
but also improve the management means and
technical level of soil and water conservation.
(3) The comprehensive technical efficiency and
scale efficiency of soil and water conservation in
Shaanxi Province showed the spatial distribution
characteristics of high in the middle and low on both
sides, high in the north and low in the south, high in
the Yellow River Basin and low in the Yangtze River
Basin; There was little difference in pure technical
efficiency among cities (districts), and the level of the
Yellow River Basin was slightly higher than that of
the Yangtze River Basin.
(4) This paper tried to analyze the situation of soil
and water conservation management in Shaanxi
Province by means of efficiency evaluation.
Compared with the previous evaluation methods, the
evaluation results of this method were more intuitive
and more adaptable to the changes of governance
factors.
(5) In this paper, DEA model was used to construct
the evaluation system of soil and water conservation
efficiency in Shaanxi Province. The research
conclusion was basically consistent with the
monitoring situation of soil and water conservation in
shaanxi province, which had certain theoretical and
practical significance. The evaluation results not only
confirmed the achievements of soil and water
conservation management in Shaanxi Province, but
also pointed out the direction for the allocation and
management of governance factors in the future.
However, there are also shortcomings in this study.
Due to the lack of existing market price and
monitoring data related to soil and water conservation,
there may be some errors in the calculation method
and results. At the same time, this study only focuses
on the efficiency of the input and output ends, without
considering the interference of process factors such as
rainfall. In the next step, a complex "input-process-
output" multi-link evaluation system will be
constructed, and the mutual influence relationship
among them will be clarified, so as to provide
reference for soil and water conservation
management in Shaanxi Province.
ACKNOWLEDGMENTS
This work was supported by National Natural Science
Foundation of China (Grant No. 51979221) and
Natural Science Basic Research Program of Shaanxi
(Program No. 2021JLM-45, 2019JLZ-15s). The
authors thank the editor for their comments and
suggestions.
REFERENCES
Balana, B., Muys, B., & Haregeweyn, N. (2012). Cost-
benefit analysis of soil and water conservation measure:
The case of exclosures in northern Ethiopia. Forest
Policy & Economics, 15(2), 27-36.
General Administration of Quality Supervision, Inspection
and Quarantine of the People's Republic of China, &
China National Standardization Administration
Committee. (2009). Comprehensive Control of Soil and
Water Conservation-Method of Benefit Calculation:
GB/T15774-2008. Beijing: Standards Press of China.
Hernandez, A. J, Laeasta, C., & Pastor, J. (2005). Effects of
different management practices on soil conservation
and soil water in a rainfed olive orchard. Agricultural
Water Management, 77, 232-248.
Hunink, J. E., Droogers, P., & Kauffman, S. (2012).
Quantitative simulation tools to analyze up - and
downstream interactions of soil and water conservation
measures: supporting policy making in the green water
credits program of Kenya. Journal of Environmental
Management, 111(11), 187-194.
Inverno, G., Carosi, L., & Romano, G. (2018). Water
pollution in wastewater treatment plants: an efficiency
analysis with undesirable output. European Journal of
Operational Research, 269(1), 24-34.
Jin, S. L. (2012). Overview of monetization evaluation
system of soil and water conservation benefits.
Subtropical Soil and Water Conservation, 24(1), 51-53.
Kang, L. L., Wang, Y. Z., & Wang, X. (2002).
Comprehensive harnessing indicator system and benefit
estimation for soil and water conservation in small
watershed. Soil and Environment, (3), 274-278.
Evaluation and Spatial Distribution of Soil and Water Conservation Efficiency in Shaanxi Province based on DEA Model
331

Mishra, P. K., & Rai, S. C. (2014). A cost–benefit analysis
of indigenous soil and water conservation measures in
Sikkim Himalaya India. Mountain Research and
Development, 34(1), 27-35.
Qin, J. L., Yin, X. Y., & Zeng, Y. L. (2015). Research on
the Evaluation of Soil and Water Conservation
Ecological Benefit in Sanjiangyuan Region. Ecological
Economy, 31(1), 180-184.
Wu, D. T. (2011). Research on DEA Approach Based Water
& Soil Conservation Benefit. Chongqing: Chongqing
Normal University.
Yang, G., Yin, X. Y., & Yu, F. W. (2015). Technical
Efficiency of Black Soil Water Conservation and Its
Influencing Factors-A Case Study of Heilongjiang
Province. Forestry Economy, 37(12), 115-119.
Yang, J., Fang, S. W., & Li, X. Q. (2010). Application and
Benefit of Plant-Growth Engineering Techniques to
Sloped Lands with Red Soil. China Soil and Water
Conservation, 9, 41-43.
Xiu, Y., Wang, N., Ji, C. T., & Ke, X. Y. (2018). The
research of eco-compensation for basin water resources
based on new regulatory economics. IOP Conference
Series: Earth and Environmental Science, 191(1),
012100.
Xu, L., Ba, L. M., & Xiao, Y. (2018). Soil and water
conservation benefits calculation and evaluation
methods. Hydraulic Science and Cold Region
Engineering, 1(1),39-42.
Zheng, G. Q., Wen, M. L., & Yang, X. J. (2016).
Theoretical Construction of Indicator System of Benefit
Assessment for Comprehensive Management in Small
Watersheds of Guangdong Province. China Rural
Water Resources and Hydropower, 7, 86-91.
WRE 2021 - The International Conference on Water Resource and Environment
332
