
Coupling Coordination between Water System Management and
Socio-economic Development in Xi’an
Meng Gao
1,2, *
, Jiwei Zhu
1,2
, Jingxia Wu
3
, Wanfei Gao
1,2
and Bing Wang
1,2
1
State Key Laboratory of Eco-hydraulics in Northwest Arid Region of China, Xi’an University of Technology, Xi’an, P. R.
China
2
Research Center of Eco-hydraulics and Sustainable Development, The New Style Think Tank of Shaanxi Universities,
Xi’an, P. R. China
3
Xi’an Water Conservancy Survey Design Institute, Xi’an Shaanxi, P. R. China
Keywords: Water system management, Socio-economic development, Coupling coordination degree, Xi’an city
Abstract: Promoting the coupling coordination of water system management and socio-economic development is the
driving force for regional sustainable development. In this paper, the evaluation index system of water system
management and socio-economic development is constructed, and the comprehensive development
coefficients are calculated by using the combination of entropic weight method and variation coefficient
method, then the coupling coordination degree (CCD) model and scissor difference method are applied to
analyse the differences between water system management and socio-economic development, as well as the
coupling coordination level and the evolution speed in Xi’an, from 2009 to 2019. The results showed that: (1)
The comprehensive development coefficient of Xi’an water system management showed a fluctuating upward
trend, and the socio-economic development increased steadily yearly. (2) The CCD increased from 0.440 to
0.830, and it evolved from slightly unbalanced development with socio-economy lagged in 2009 to favourably
balanced development with water system management lagged in 2019. (3) The scissors difference in inverted
“U” shape, indicating that the gaps between the two systems are gradually decreasing. Subsequently, based
on the results of the above analysis, policy suggestions are made to ensure a balanced development in Xi’an
and to provide experience for other water-scarce cities to set up water system management strategies.
1 INTRODUCTION
Water is the source of life and the vitality of cities.
The urban water system provides a basic material
guarantee for human production and life, economic
development, and social progress, it has enhanced
people’s sense of happiness and gain, and promoted
socio-economic development. However, with the
progress of human society, especially the acceleration
of urbanization and industrialization, problems such
as water shortage, pollution, and quality deterioration
have become increasingly prominent, which have
become the main bottleneck restricting the
development of the urban social economy.
Be advised that papers in a technically unsuitable
form will be returned for retyping. After returned the
manuscript must be appropriately modified. In recent
years, many scholars have done a lot of research and
achieved abundant results on the coupling
coordination relationship between the water system
and socio-economic development. Most of them
focus on the quantitative model research of water
pollution and per capita GDP based on the EKC, and
verify the existence of the EKC hypothesis through
empirical studies from different perspectives (Dln,
2019; Miglietta et al., 2017). A small number of
scholars have also explored the relationship between
water consumption and income (Duarte et al., 2013).
Scholars’ research on the coupling coordination of
water system and socio-economic development can
be roughly divided into time series research and
spatial differentiation research from the dimensions.
time series research mainly uses entropy weight
method, mechanical model, DPSIRM model, a
comprehensive index, polynomial fitting, and other
methods to evaluate and analyze the coupling
coordination relationship between water environment
and social economy from the perspective of the basin
(Fang et al., 2007; Li et al., 2016). Spatial
differentiation research is more to use GIS, gray
312
Gao, M., Zhu, J., Wu, J., Gao, W. and Wang, B.
Coupling Coordination between Water System Management and Socio-economic Development in Xi’an.
In Proceedings of the 7th International Conference on Water Resource and Environment (WRE 2021), pages 312-321
ISBN: 978-989-758-560-9; ISSN: 1755-1315
Copyright
c
2022 by SCITEPRESS – Science and Technology Publications, Lda. All rights reserved
correlation and other models to explore its dynamic
evolution coordination relationship and pattern
characteristics analysis from different scales of
provinces, regions, and cities (Guo et al., 2021; Li et
al., 2019).
At present, scholars mainly carry out research on
the coordination level of water resources, water
environment and other factors with the economic
development of cities, with the following
shortcomings: (1) Seldom take water system
management as the research object and explore its
coupling coordination relationship with socio-
economic development.(2) The lack of an effective
and comprehensive index system for evaluating the
level of water system management and socio-
economic development of cities. this paper constructs
the evaluation index system of water system
management and socio-economic development in
Xi’an City, explore the coupling coordination
relationship between the two aspects, and judge the
difference in their evolution rate and direction, it is
expected to provide a theoretical basis and
development path for promoting the coordinated
development of Xi’an water system management and
social economy.
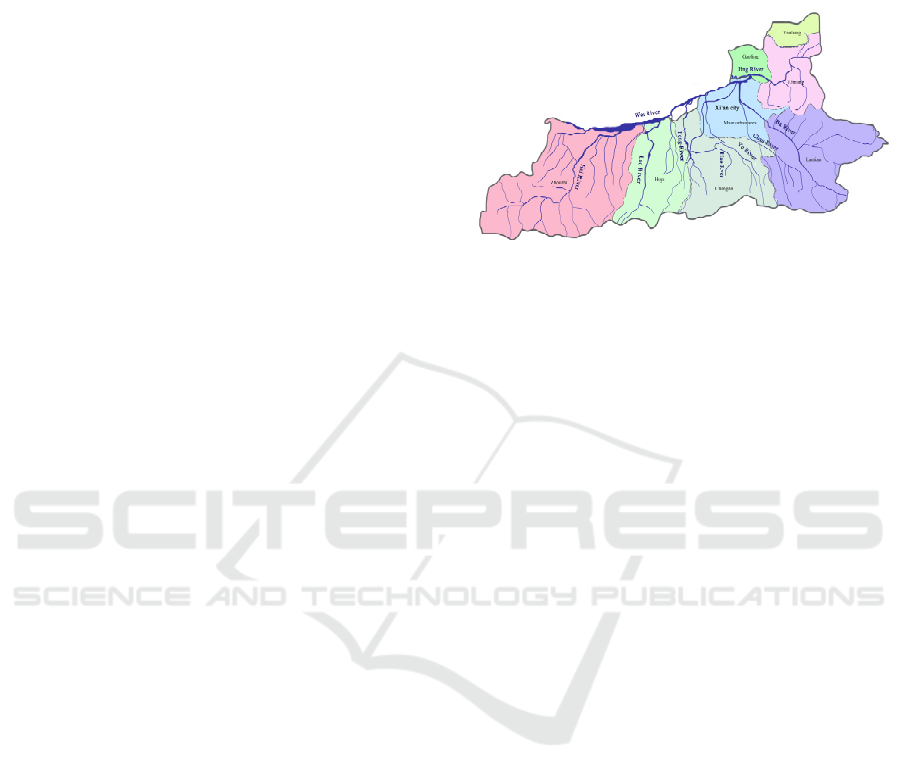
2 STUDY AREA
Xi’an City (32°42’~34°45’N, 107°40’~109°49’E) is
located in the middle of the Guanzhong Plain in
Shaanxi Province, with an altitude of 400-700m
above sea level and a total area of 10,108 km
2
. It
belongs to the semi-humid continental monsoon
climate of the warm temperate zone and the annual
average temperature is 13.3℃~13.7℃. Xi’an is a
water shortage city with an average annual water
resources of 2.347 billion m
3
, with a per capita
possession of 270m
3
, which is only 13.25% of the
national average. The average annual precipitation
decreases gradually from south to north and is 740.4
mm. Thousands of lakes due to the crisscrossing
networks of water, the main rivers are all Wei River
system in the Yellow River basin (Figure 1). There
are 30 rivers with a basin area of more than 100km
2
and 7 rivers with a basin area of more than 1000km
2
.
Xi’an now has jurisdiction over 11 districts and 2
counties. By the end of 2019, the permanent resident
population of Xi’an is 10.2 million, and the annual
GDP of Xi’an is 93.22 billion yuan, among them, the
tertiary industry is the main source of income,
accounting for 63% of the total. The economy was
stable and improved, and people’s well-being
continued to advance. Under the guidance of Xi’an to
build an international metropolis and national central
city, Xi’an will become a core city that leads the
northwest and radiates the northern inland areas
(Zhang et al., 2020b).
Figure 1: Xi’an water system and administrative division.
3 DATA AND METHODOLOGY
3.1 Index System and Data Sources
Based on reviewing relevant literature (Liu et al.,
2019a; Michelsen & Bargur, 1994) candidate
indicators with a temporal correlation between the
two systems are firstly selected, Then, through the
methods of expert consultation, frequency statistics
and principal component analysis, the indicators that
accord with the reality of Xi’an water system
management and socio-economic development are
selected (Liu et al., 2019b; Khan et al., 2007).
Following the principles of scientificity, operability
and systematization, 4 first-level indicators and 9
second-level indicators are finally determined for
water system management, 2 first-level indicators and
11 second-level indicators are determined for socio-
economic development, and a total of 20 indicators
are involved in the evaluation, as shown in Table 1.
Considering the authenticity and accessibility of
the data, this paper selects the data of Xi’an from 2009
to 2019 as the research sample. The relevant data of
the water system management comes from the
“Shaanxi Provincial Water Resources Bulletin”, the
“Xi’an Water Resources Bulletin”, the “Xi’an
Ecological Environment Status Bulletin” and the
“Xi’an Government Work Report”; and the social
economy data are all from the “Shaanxi Provincial
Statistical Yearbook”, the “Xi’an Statistical
Yearbook” and the “Statistical Bulletin of Xi’an
National Economic and Social Development”, some
missing data in some years are supplemented by
interpolation.
Coupling Coordination between Water System Management and Socio-economic Development in Xi’an
313
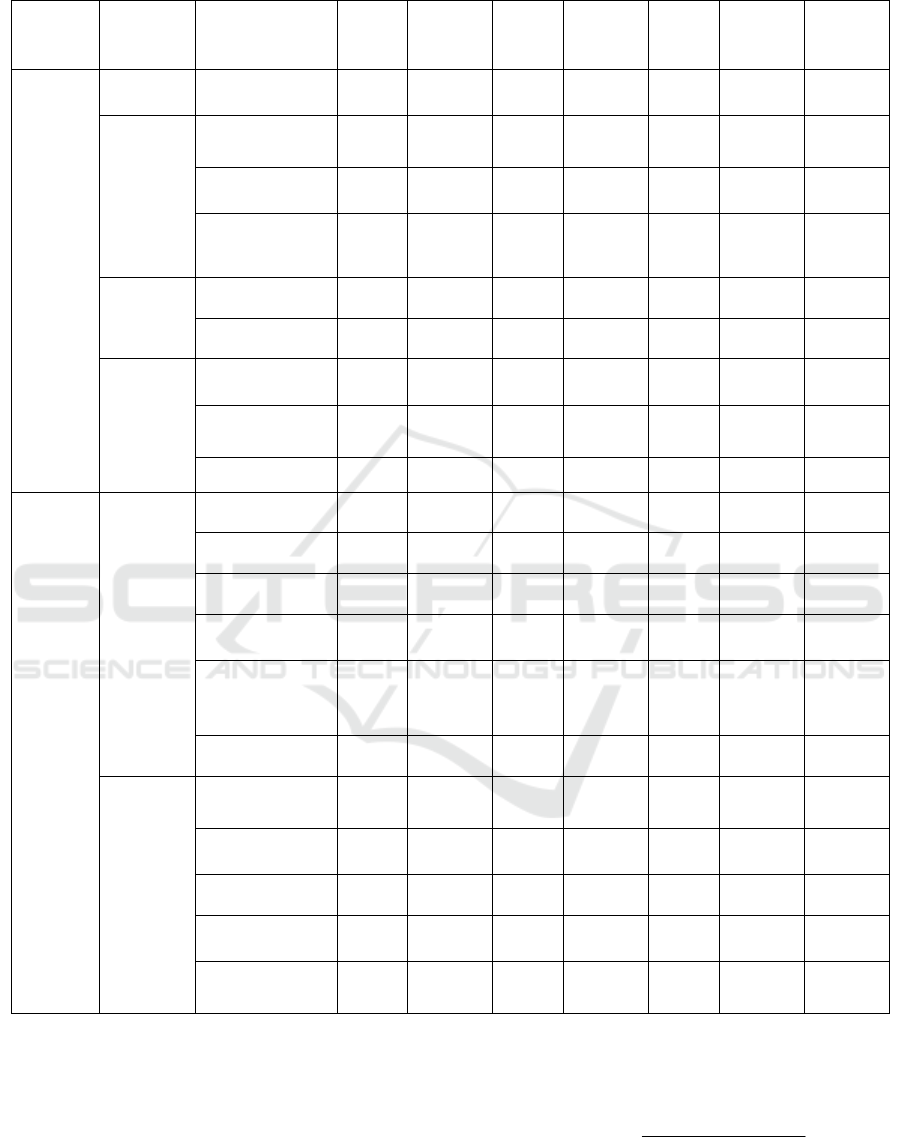
Table 1: Index system of water system management and socio-economic development.
Subsystem
First-level
Indexes
Second-level
Indexes
Index
properties
Unit MAX MIN
Entropy
Weight
method
Coefficient
of variation
method
Combined
weight
Water
system
management
Water area
management
the water system
area rate
+ % 0.63% 0.28% 0.164 0.118 0.153
Water quality
management
water function area
compliance rate
+ % 84.80% 4.16% 0.125 0.321 0.219
sewage treatment
rate
+ % 96.38% 80.97% 0.062 0.022 0.040
river source water
quality compliance
rate
+ % 94.74% 31.57% 0.090 0.143 0.124
Water
ecology
management
Soil erosion control
area
+ 1000Ha 267.40 173.80 0.135 0.072 0.108
wetland area + Mu 8660.00 4566.00 0.077 0.077 0.084
Water
function
management
embankment
compliance rate
+ % 86.92% 17.72% 0.126 0.216 0.181
waterlogging control
area
+ 1000Ha 45.46 40.69 0.117 0.012 0.042
irrigation area + 1000Ha 208.73 178.23 0.105 0.019 0.049
Socio-
economic
development
Economic
development
GDP per capita + Million/per 9.23 3.22 0.086 0.131 0.111
growth rate of
tertiary industry
+ % 15.10% 6.80% 0.086 0.098 0.095
local fiscal revenue + billion 702.56 181.40 0.076 0.157 0.114
urban per capita
disposable income
+ billion 4.18 1.89 0.066 0.092 0.081
degree of
dependence on
foreign trade
+ % 38.87% 18.17% 0.115 0.106 0.115
total tourism income + % 33.75% 10.93% 0.112 0.150 0.136
Social
development
greening area rate of
built-up area
+ % 42.57% 37.50% 0.068 0.016 0.034
Air quality
compliance rate
+ % 85.26% 18.96% 0.075 0.107 0.094
urbanization rate + % 65.52% 43.94% 0.159 0.069 0.109
registered urban
unemployment rate
- % 4.30% 3.26% 0.066 0.045 0.057
commodity housing
sales price index
- % 121.1 96.2 0.091 0.030 0.054
3.2 Methods
3.2.1 Entropy Weight Method
Entropy weight method is an objective weight method
by calculating the information entropy of the index.
The smaller the information entropy, the greater the
degree of variation and the greater the weight (Guo et
al., 2021). The calculation steps are:
Positive index:
ij
min( )
max( ) min( )
ij j
j
j
aa
a
aa
−
′
=
−
(1)
WRE 2021 - The International Conference on Water Resource and Environment
314
Negative index:
ij
max( )
max( ) min( )
jj
j
j
aa
a
aa
−
′
=
−
(2)
Where 𝑎
is jth index of the ith year; 𝑎
is the
standardized value; max 𝑎
and min 𝑎
represent the
maximum and minimum values of the jth index,
respectively.
normalized processing:
i1
ij
ij
m
ij
a
a
a
=
′
=
(3)
information entropy:
1
ln
1
ln
m
ij
i
j
a
d
m
=
−
=−
(4)
entropy weight:
1
j
j
n
j
j
d
w
d
=
=
(5)
3.2.2 Variation Coefficient Method
It is the ratio of the mean and standard deviation of an
indicator, which can make up for the unreasonable
weight distribution of the single entropy weight
method, and eliminate the influence of abnormal
indicators (zhen et al., 2014). The calculation formula
is:
1
i
i
m
i
i
i
i
w
x
x
σ
σ
=
′
=
(6)
Where 𝑤
′ is weight; 𝜎
is the standard deviation of
the ith index;
𝑥̅
is the average of the ith index.
3.2.3 Combination Weight
According to the Lagrange multiplier method, the
combined weight is obtained by solving the objective
function of the minimum information entropy
determined by the weights of the entropy weight
method and the variation coefficient method (Chen et
al., 2021).
11
min (ln ln ) (ln ln )
mm
ii j ii i
ii
Fwww www
==
′
=−+−
(7)
combination weight:
1/ 2
1/ 2
1
()
()
ji
i
m
ji
i
ww
w
ww
=
′
⋅
=
′
⋅
(8)
3.2.4 CCD Model
Refer to the related studies of the coupling
coordination degree, the coupling coordination
development coefficient is introduced to evaluate the
coupling coordination degree of water system
management and socio-economic development. The
calculation formula is as following:
()
1/2
2
2()()
() ()
PR PE
C
PR PE
⋅⋅
=
+
(9)
() ()TPR PE
α
β
=⋅ +⋅
(10)
1/ 2
()DCT=⋅
(11)
Where P(R) and P(E) represent the comprehensive
level of water system management and socio-
economic development respectively; C is the
coordination coefficient of water system
management and socio-economic development; T
is the comprehensive benefit of system; α and β
represent the contribution coefficients (α=β=0.5
(Song et al., 2018)). D is the CCD. According to the
interaction degree between P(R) and P(E), this paper
refers to the relevant literature (Liu et al., 2020; Yang
& Wang, 2020) to divide the coupling coordination
level into five categories, five levels and fifteen types,
as showed in Table 2.
3.2.5 Scissors Difference Model
It quantitatively describes the evolution trend and
difference by calculating the Angle between the
tangents of evolution velocity between systems at any
time. The larger the α angle is, the greater the
difference in the change rate between the two systems
is. By deriving the nonlinear functions f (R) and f (E)
of two systems, the evolution speed is:
2
01 2
() f(R)= ()
n
tn
VR
f
Rddtdt dt
′
′
=+++++
(12)
2
01 2
() f(R)= ()
n
tn
VR
f
Rcctct ct
′
′
=+++++
(13)
Where t is the research period, which is 2009-
2019 in this paper; c
n
and d
n
are the coefficients. Thus,
the scissors difference between the two systems is:
() ()
arctan
1()()
VR VE
a
VR VE
−
=
+⋅
(14)
Coupling Coordination between Water System Management and Socio-economic Development in Xi’an
315
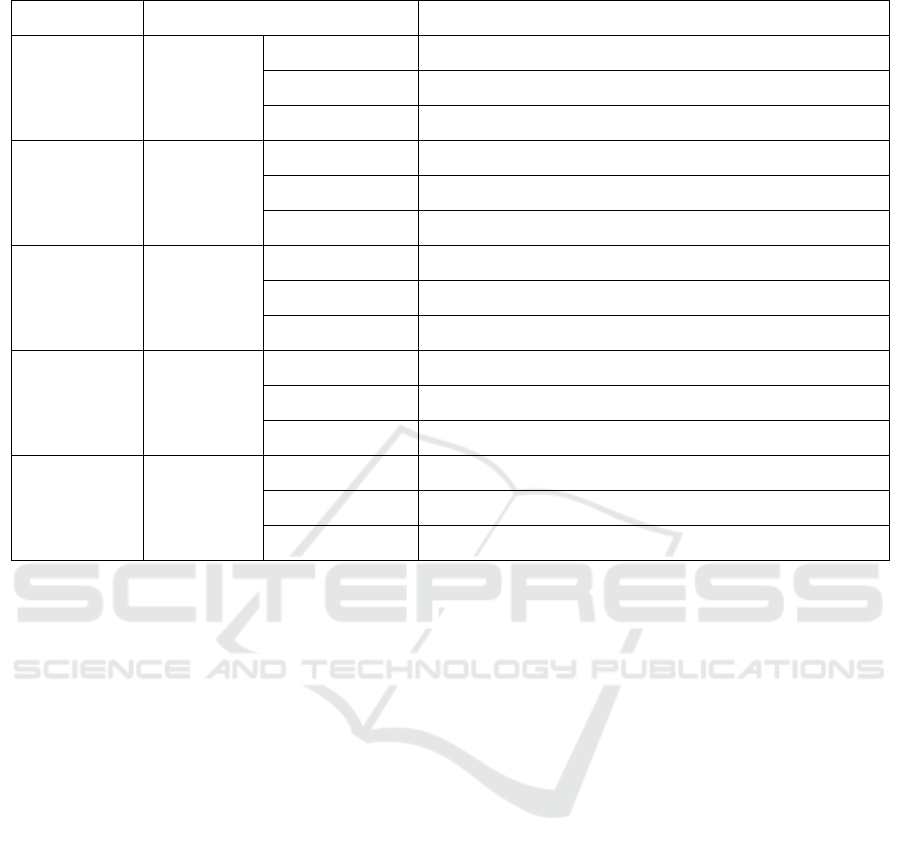
Table 2: Discriminating standard of CCD.
Categories Levels of CCD Development modes between subsystems
Superiorly
balanced
development
0.9<D≤1
P(R)>P(E) Superiorly balanced development with E lagged
P(R)<P(E) Superiorly balanced development with R lagged
P(R)=P(E) Superiorly balanced development between R and E
Favorably
balanced
development
0.8<D≤0.9
P(R)>P(E) Favorably balanced development with E lagged
P(R)<P(E) Favorably balanced development with R lagged
P(R)=P(E) Favorably balanced development between R and E
Barely
balanced
development
0.6<D≤0.8
P(R)>P(E) Barely balanced development with E lagged
P(R)<P(E) Barely balanced development with R lagged
P(R)=P(E) Barely balanced development between R and E
Slightly
unbalanced
development
0.4<D≤0.6
P(R)>P(E) Slightly balanced development with E lagged
P(R)<P(E) Slightly balanced development with R lagged
P(R)=P(E) Slightly balanced development between R and E
Unbalanced
development
D≤0.4
P(R)>P(E) Unbalanced development with E lagged
P(R)<P(E) Unbalanced development with R lagged
P(R)=P(E) Unbal anced development between R and E
4 RESULTS
4.1 The Comprehensive Levels of
Water System Management and
Socio-economic Development
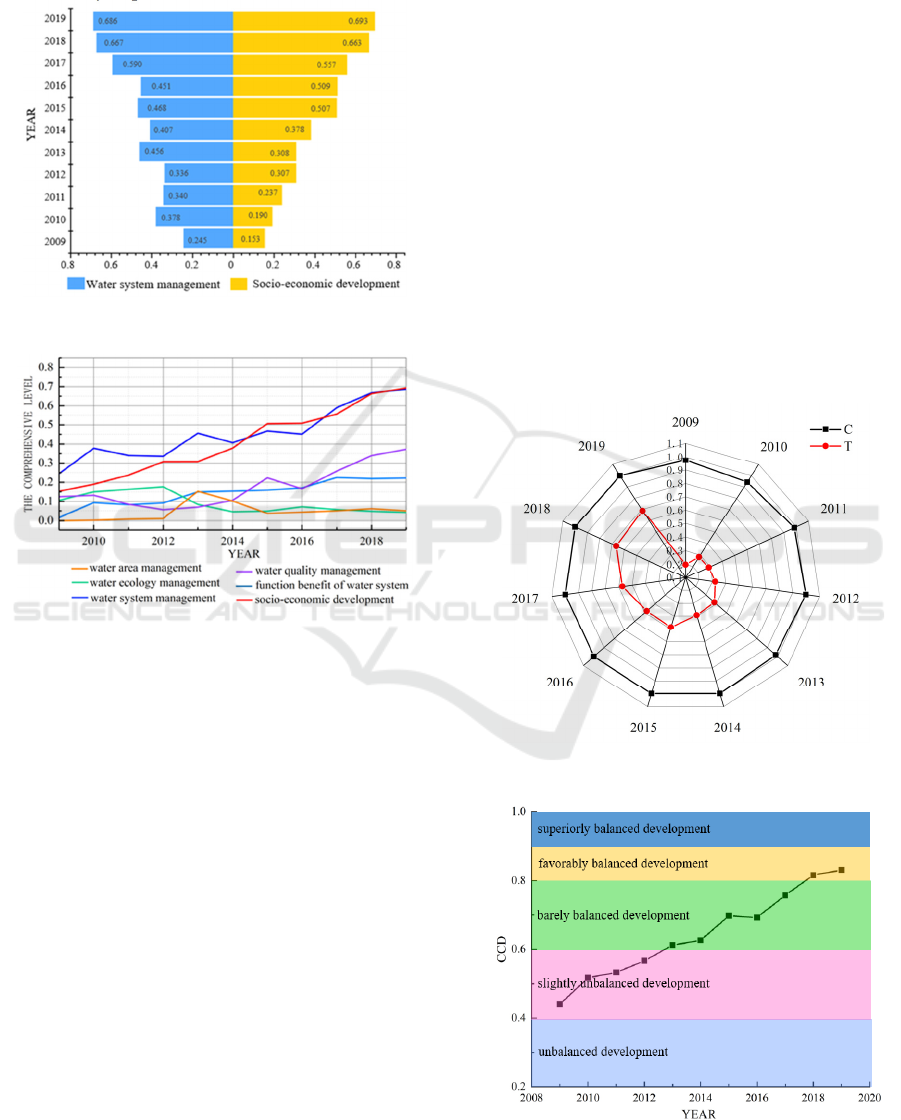
By calculating the combined weight of indexs (Table
1), the comprehensive development index of water
system management and social economy in Xi’an
City is obtained (Figure 2). It can be seen from figure
2 that the comprehensive level of water system
management in Xi’an during the study period showed
a tortuous upward trend, and the comprehensive
development coefficient increased from 0.244 to
0.686. Figure 3 shows in 2012, due to the
comprehensive pollution coefficient has increased by
4.57% compared with the previous year, and 11
sections of the monitoring are in inferior V water
quality, which caused the decrease of water quality
management level. Due to the development of
urbanization in Xi’an in 2014, the increase of
construction land has led to a sharp decline in wetland
area, resulting in a decrease in the comprehensive
level of water system management. In 2016, due to
various major pollutants were aggravated to varying
degrees, therefore, they exceeded the sewage
treatment load, the sewage treatment rate was greatly.
During the study period, the comprehensive level
of socio-economic development in Xi’an increased
year by year (Figure 3), and the comprehensive
development coefficient increased from 0.153 to
0.693. In June 2009, the State Council approved the
“Guanzhong-Tianshui Economic Zone Development
Plan”, and Xi’an became the third international
metropolis after Beijing and Shanghai. which enabled
Xi’an’s economy to step into the rising channel of
rapid development, with only a per capita GDP
growth of 58.8%. In 2013-2016, as Xi’an actively
integrated into the national “One Belt, One Road”
strategy, which made Xi’an’s socio-economic
development coefficient showing a steady and
continuous rise situation. From 2017 to 2019, Xi’an’s
economic strength has increased significantly, and its
socio-economic growth rate has been rapid. Due to
the rise of Xi’an "Online star city", the growth rate of
tourism in 2017 ranked first in 15 sub-provincial
levels, and the total tourism revenue exceeded 300
billion yuan in 2019. The culture and tourism industry
has become a new economic growth point in Xi’an,
greatly promoting social consumption and
employment, and driving the rapid growth of the
WRE 2021 - The International Conference on Water Resource and Environment
316
economic. Therefore, during the "12th Five-Year
Plan" and “13th Five-Year Plan” periods, Xi’an’s
comprehensive economic strength has been
continuously improved.
Figure 2: Composite development coefficient.
Figure 3: The evolution trend.
4.2 Analysis of CCD between Water
System Management and
Socio-economic Development
Using Equation (9-10), the coordination coefficient
(C) and comprehensive benefit (T) of water system
management and socio-economic development in the
study period are calculated (Figure 4). In Figure 5, the
CCD of the two systems in Xi’an increased from
0.440 to 0.830, indicating that the relationship
between two systems in Xi’an is continuously
improving, and the overall trend is approximate "W"
type. The CCD of the two systems has gone through
three stages: slightly unbalanced development, barely
balanced development, favourably balanced
development, and is expected to enter superiorly
balanced development in the short term.
In 2009-2012, the two systems were in slightly
unbalanced development, due to the socio-economic
development of this period was lagging, and the
pressure on water systems from people’s production
and life was relatively small. Therefore, the
coordination between two systems in this stage has
been relatively improved. From 2013 to 2017, the two
systems are in barely balanced development, and the
CCD during this period can be stabilized at more than
0.6, and the development of water system
management has always been before the social
economy, the transition from unbalance to balance is
realized, and the two are gradually converging. But
due to the fluctuation of water system governance in
2015-2016, the CCD with socio-economic
development decreased significantly. During 2018-
2019, Xi’an is in the stage of favourably balanced
development, the two systems to achieve
synchronous and coordinated development, with the
coordination coefficient as high as 0.670. But there is
still a certain gap with the ideal superiorly
coordination state, thus it is necessary to increase
water conservancy investment and water system
management, and optimize the comprehensive
development level of the two systems.
Figure 4: The values of C and T.
Figure 5: The analysis of CCD.
Coupling Coordination between Water System Management and Socio-economic Development in Xi’an
317
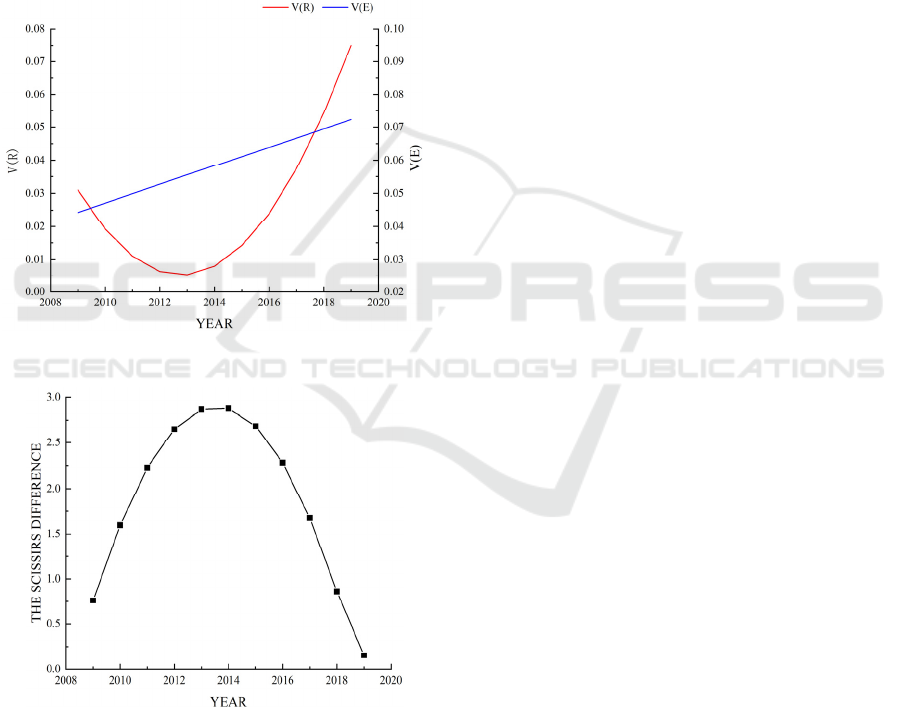
4.3 Analysis of Scissors Difference
between Water System Management
and Socio-economic Development
Matlab software is used to fit the time series data of
two systems, the fitting curve of water system
governance is f(R)=0.0006X
3
-0.0086X
2
+0.0646X+0.2183,
and the fitting curve of socio-economic development
is f(E)=0.0014X
2
+0.0415X+0.01, R
2
was 0.917 and
0.979 respectively, so the fitting effect was good. The
evolution rate (Figure 6) and the scissors difference α
(Figure 7) of the two systems are obtained by
equation (12~14).
Figure 6: The evolution Rate.
Figure 7: The analysis of scissors difference.
From the perspective of evolution rate, the
evolution rate of water system management in Xi’an
is “U” shape, and the socio-economic development is
linear. The average evolutionary rate of water system
management (0.026) was lower than that of socio-
economic development (0.058), but the growth rate of
both systems was positive, which did not affect the
increase of their overall development level. The main
performance is that the growth rate of water system
management slowed down from 2009 to 2013, the
construction of an international metropolis made the
demand for water resources continue to rise, and the
contradiction between supply and demand of water
resources was prominent, which brought pressure on
water source protection. Therefore, the growth rate of
water system management slows down. With the
implementation of the “Eight rivers nourish Xi’an”,
more attention and investments had been paid to the
ecological protection and management of water
system, which makes the evolution rate of water
system management rise rapidly.
From the perspective of evolution direction, the
scissors difference between two systems in Xi’an has
an overall inverted "U" shape. In 2009-2014, the
scissors difference showed an increasing trend, from
0.761° to 2.878°, The rapid development of social
economy has brought pressure and environmental
pollution to water system management, which makes
the difference of the evolution rate between the two
become bigger and bigger. However, the growth rate
of scissors difference was slowing down, indicating
that the water system management system was
continuously improved with the growth of socio-
economic development. In 2014-2019, the scissors
difference decreased to 0.154°. At this stage, under
the establishment of the water ecological civilization
city, the sewage treatment technology, and the
awareness of water management by the whole people
have been improved. Therefore, the evolution rate of
two systems has achieved rapid convergence, and the
coupling coordination between the two systems has
been continuously optimized, which effectively
controls the scissors difference and enters a stage of
favourably balanced development.
5 DISCUSSION
According to the above analysis, it can be found that,
the water system in good condition in 2009, which
can guarantee the production and life of urban
residents and promote the rapid economic
development. As Xi’an was officially approved by
the state to construct an international metropolis and
a national central city, socio-economic development
has accelerated by leaps and bounds, and influence
has been further enhanced. With a resident population
of 10.2 million by 2019 and an urbanisation rate of
65.5%, Xi’an is in the top 10 most attractive cities for
foreign investment in the country, putting pressure on
WRE 2021 - The International Conference on Water Resource and Environment
318

the water system management work (Zhang et al.,
2020a). However, with the increase of water
conservancy investment yearly, the water
conservancy work and supervision intensity are
increased, and the effect is remarkable. The two
systems have formed a relatively benign interaction.
This is consistent with the policy plans that Xi’an has
formulated and implemented all the time, which
verifies the reliability and reasonableness of the
results from the side. And from the following aspects
to explore the role of water system management on
socio-economic.
By the end of 2019, Xi’an water resources used
for agricultural irrigation accounts for 1/4 of the total
water consumption. Through water system
management, the implementation of effective
agricultural irrigation water management has a good
role in promoting the development of urban socio-
economic. It avoids the waste of water resources in
this link, improves the effective irrigation area,
increases the yield of food crops, and drives the
economic development of the primary industry.
Water environment management is an important
guarantee for the normal functioning of water
systems, with the continuous improvement in the rate
of sewage treatment and water quality standards, the
drinking water needs of urban residents and other
living creatures are ensured and the orderly operation
of the city’s socio-economic is guaranteed. Socio-
economic rapidly development is divorced from the
water system, it will in turn be influenced by human
activity and bring about other water problems such as
water pollution.
In addition, water system management should pay
particular attention to the impact of the energy
industry. Traditional energy industries such as coal
mining, natural gas and petrochemical construction
are prone to water pollution, soil erosion and
reduction of wetland areas, thereby increasing the
pressure on water systems. Therefore, water system
management must strengthen the protection of water
sources and the construction of sewage treatment
facilities to ensure the accelerated industrialization of
Xi’an and to promote the transformation and
development of secondary industries.
Water ecology is the focus of water system
management. During the 13th Five-Year Plan period,
Xi’an added 24,300 mu of wetland, and a total of
949.93km
2
of soil erosion was treated. Through the
management of water system ecology and landscape,
the connectivity of the water system is enhanced, and
provide places for people to relax and get close to
nature, which improves the diversity of the urban
landscape and the suitability of the residents, drives
the value-added of the surrounding real estate, and
provides service functions for socio-economic
development.
The result of this paper can bring thinking and
reference for the northwest region and other water-
deficient cities, for example, Lanzhou, Xining,
Yinchuan, etc, and provide a theoretical basis for
economic development and the targeted formulation
of water system management guidelines and policies.
Water system management must be step by step,
socio-economic development must rely on water
system management, too much investment in water
conservancy is prone to waste of funds, too little
investment and difficult to maintain the normal
operation of the socio-economic. Therefore,
achieving the coupling coordinated development of
water system management and socio-economic is a
sustainable development path that the region must
take.
6 CONCLUSIONS AND POLICY
IMPLICATIONS
6.1 Conclusions
Through this research and analysis described above,
the following conclusions are obtained:
During the study period, the overall level of water
system management and socio-economic development
in Xi’an was positive. Among them, the water system
management has achieved a slight fluctuation growth,
and the development coefficient has increased from
0.244 to 0.686. The social economy has continued to
grow steadily year by year, and the development
coefficient has increased from 0.153 to 0.693.
During the study period, the CCD of two systems
in Xi’an increased from 0.440 to 0.830, and the
overall trend is approximate “W” type. The coupling
coordination state has developed from the slightly
unbalanced development with social economy lagged
to favourably balanced development with water
system management lagged. It shows that the
coordination relationship between the two is
constantly improving and enhancing. In the future, we
should continue to increase the investment and
construction of water conservancy to realize the
benign interaction.
During the study period, from the evolution rate
of the two systems, the evolution rate of water system
management in Xi’an decreased first and then
increased, and the social economy increased linearly,
and the former (0.026) was less than the latter (0.058),
Coupling Coordination between Water System Management and Socio-economic Development in Xi’an
319

which were positive growth. From the evolution
direction, the scissors difference between the two
systems first increases and then decreases, showing
an inverted "U" shape. It shows that the difference of
evolution rate between the two systems is gradually
decreasing and developing towards the direction of
orderly and coordinated mutual promotion.
6.2 Policy Implications
Based on the above research results, this paper gives
the following policy implications:
Firstly, water ecological management should be
increased. it is necessary to coordinate the upstream
and downstream, the left and right banks of the whole
basin, build an organic water system, realize the water
systems and banks are governed together, repair
biological habitats, and promote the improvement of
landscape and water quality. Secondly, the
construction of water environment protection
mechanism, thus Xi’an on the one hand to improve
water environmental monitoring, statistics, water
pollution control and monitoring ability; on the other
hand, the government should strictly control high
water consumption, high pollution projects and
groundwater over-exploitation area of new
groundwater project approval. Finally, the urban
water supply capacity should be improved. people
should comprehensively build green water sources,
strengthen the construction of water supply facilities,
make rational allocation and efficient use of water
resources. The harmonious coexistence of water and
city will be gradually realized, and Xi’an will be
promoted to realize high-quality development guided
by ecology first.
ACKNOWLEDGEMENTS
This research was funded by Project of National
Natural Science Foundation of China (71774132),
Shaanxi Water Conservancy Science and Technology
Project (2020SLKJ-22), Shaanxi Provincial
Department of Education Key Scientific Research
Project (20JT054).
REFERENCES
Chen, H. G., Li, X. N., & Li, C. Y. (2021). Resilience
evaluation of water resources system based on
coefficient of variation entropy weight method: A case
study of Water resources in Heilongjiang Province from
2007 to 2016. Ecological Economy, 37(01), 179-184.
Dln, L. (2019). Vietnam Economic Situation and Its
Impacts on Three Natural Resources: Air, Water, and
Soil. Management Studies, 7(6), 582-587.
Duarte, R., Pinilla, V., & Serrano, A. (2013). Is there an
environmental kuznets curve for water use? a panel
smooth transition regression approach. Economic
Modelling, 31, 518-527.
Fang, C., Bao, C., Huang, J., & Tsakiris, G. (2007).
Management Implications to Water Resources
Constraint Force on Socio-economic System in Rapid
Urbanization: A Case Study of the Hexi Corridor, NW
China. Water Resources Management, 21(9), 1613-
1633.
Guo, M., Ma, S., Wang, L. J., & Lin, C. (2021). Impacts of
future climate change and different management
scenarios on water-related ecosystem services: a case
study in the jianghuai ecological economic zone, China.
Ecological Indicators, 127, 107732.
Khan, S., Mushtaq, S., Luo, Y., Dawe, D., Hafeez, M., &
Rana, T. (2007). Conjunctive water management
options: Examples from economic assessment of
system-level water saving through liuyuankou
irrigation SYSTEM, China. Irrigation and Drainage,
56(5), 523-539.
Li, T., Han, Y., Li, Y., Lu, Z., & Zhao, P. (2016). Urgency,
development stage and coordination degree analysis to
support differentiation management of water pollution
emission control and economic development in the
eastern coastal area of china. Ecological Indicators, 71,
406-415.
Li, S., Ying, Z., Zhang, H. Ge, G., & Liu, Q. (2019).
Comprehensive assessment of urbanization
coordination: a case study of jiangxi province, China.
Chinese Geographical Science, 20(3), 488-502.
Liu, X. J., Pan, Y., Zhang, W. H., Ying, L. M., & Huang, W.
L. (2019a). Achieve sustainable development of rivers
with water resource management-economic model of
river chief system in China. Science of The Total
Environment, 708, 134657.
Liu, Y., Zhang, Z. X., & Zhang, F. X. (2019b). Challenges
for water security and sustainable socio-economic
development: A case study of industrial, domestic
water use and pollution management in Shandong,
China. Water, 11(8), 1630.
Liu, Y., Yang, L. Y., & Jiang, W. (2020). Coupling
coordination and spatiotemporal dynamic evolution
between social economy and water environmental
quality – A case study from Nansi Lake catchment,
China. Ecological Indicators, 119
, 106870.
Michelsen, A. M., & Bargur, J. (1994). Developing
Economic Performance Information for Water
Management Projects in North China. Water Policy &
Management, ASCE, 641-644.
Miglietta, P. P., De Leo, F., & Toma, P. (2017).
Environmental Kuznets curve and the water
footprint:an empirical analysis. Water and Environment
Journal, 31(1), 20-30.
Song, Q. J., Zhou, N., & Liu, T. L. (2018). Investigation of
a-coupling model of coordination between low-carbon
WRE 2021 - The International Conference on Water Resource and Environment
320

development and urbanization in China. Energy Policy,
121, 346-354.
Yang, Y. F., & Wang, Q. (2020). Evaluation of the
coordination between eco-environmental protection
and regional economic development in China. Journal
of Industrial Technological Economics, 39(11), 67-74.
Zhang, H. J., Pang, Q., Hua, Y. W., Li, X. X., & Liu, K.
(2020a). Linking ecological red lines and public
perceptions of ecosystem services to manage the
ecological environment: A case study in the Fenghe
River watershed of Xi’an. Ecological Indicators, 113,
106218.
Zhang, Z. Y., Zhu, J. W., Xie, J. C., Zhang, Y. J., & Ma, Z.
H. (2020b). Coupling coordination relationship between
land use benefit and urbanization in Xi’an city. Research
of Soil and Water Conservation, 27, 308-316.
Zhen, X. X., Jin, L., Shu, H. D., Lou, D., Fu, Q., & Guo, H.
(2014). Ecosystem health assessment of desert nature
reserve with entropy weight and fuzzy mathematics
methods: A case study of Badain Jaran Desert.
Ecological Indicators, 119, 106843.
Coupling Coordination between Water System Management and Socio-economic Development in Xi’an
321
