
Research on the Influence of Different Working Conditions of
Wastewater Treatment Plants on Water Quality of Guanlan River
Main Stream
Tao Zhou
1,2,3
, Xiaoqi Zhang
1,2,3
, Shuai Xie
1,2,3
, and Yongqiang Wang
1,2,3,*
1
Changjiang River Scientific Research Institute, Changjiang Water Resources Commission of the Ministry of Water
Resources of China, Wuhan 430010, China
2
Hubei Key Laboratory of Water Resources & Eco-Environmental Sciences, Changjiang River Scientific Research Institute,
Wuhan 430010, China
3
Research Center on the Yangtze River Economic Belt Protection and Development Strategy, Hubei Wuhan 430010, China
Keywords: Guanlan River, Working conditions of overflow and water supplement, Water quality simulation calculation,
Water pollution control
Abstract: The operation condition of wastewater treatment plants has great influence on river water quality. Different
simulated working conditions of overflow and water supplement in Guanlan River Basin were established in
this study according to the sewage treatment capacity of decentralized sewage treatment facilities in the basin
and water purification capacity of water purification engineering for Guanlan estuary storage pond. A
hydrodynamic and environment mathematical model for Guanlan River mainstream was developed, using
pollution indicators like COD, NH3-N and TP concentrations to quantitatively analyze the water quantity and
quality of the basin under different working conditions overflow and water supplement and to simulate the
water quality changes in the main under the different operating conditions. The calculation results show that:
(1) If there were only one overflow point and the overflow volume does not exceed 30,000 m3/d, the water
quality of Qiping Section can meet the assessment requirements; (2) If overflow occurs at both overflow
points, the water quality of Qiping Section meets the assessment requirements only when the overflow volume
downstream the Guanlan plant does not exceed 20,000 m3/d and the overflow volume upstream the terminal
gate does not exceed 15,000 m3/d; (3) The concentrations of COD, NH3-N and TP along the main stream are
obviously lower under all working conditions of water supplement. This research is expected to provide
scientific basis for water pollution control of Guanlan River Basin.
1 INTRODUCTION
In city regions of China, rivers are exposed to heavy
pollution due to the large proportion of impermeable
areas, complex production activities and diverse
pollution sources. With the continuous improvement
of wastewater collection and interception systems in
city regions and the higher construction standard
raised for wastewater treatment plants over the years,
the pollution sources have been well controlled, and
the influence of different operating conditions of
wastewater treatment system on river water quality
has become increasingly prominent. So, it is urgent to
study the effect of different operating conditions of
urban wastewater treatment plants on river water
quality, so as to provide data support for further
improvement of urban river water quality.
Hydrodynamics is the basis for studying the
evolution of river flow. The two main methods
commonly adopted for researching on hydrodynamics
are mathematical statistics and mathematical model
simulation (Sun et al., 2017; Huang et al., 2015;
Shchepetkin & Mcwilliams, 2005). With the
development of computer technology, mathematical
model methods have gradually been applied to
different disciplines. Numerical simulation software
has also been widely applied, and commonly used
simulation software includes EFDC, ROMS,
FVCOM, MIKE, etc. (Chen et al., 2003; Yuan & Xu,
2006; Zuo & Li, 2013). Numerical model methods
have also been widely used in water quality
simulation of rivers and lakes (Jorgensen et al., 2005;
Huang et al., 2010; Beletsky et al., 2006).
284
Zhou, T., Zhang, X., Xie, S. and Wang, Y.
Research on the Influence of Different Working Conditions of Wastewater Treatment Plants on Water Quality of Guanlan River Main Stream.
In Proceedings of the 7th International Conference on Water Resource and Environment (WRE 2021), pages 284-295
ISBN: 978-989-758-560-9; ISSN: 1755-1315
Copyright
c
2022 by SCITEPRESS – Science and Technology Publications, Lda. All rights reserved
However, previous studies mainly focus on the
investigation of point-source and non-point source
pollution in cities (Cheng et al., 2017), based on
which empirical equations were used for some
estimates that later became the input conditions of
hydrodynamic models. Wang et al. (2014) estimated
the loads of NH
3
-N, COD, TN and TP in the annual
rainfall runoff pollution in Neijiang City by studying
the rainfall event mean concentrations in different
underlying surfaces of Neijiang City; Yang et al.
(2021) and Yang et al. (2015) estimated the loads of
pollutants such as SS and COD of urban non-point
source pollutants in Beijing by the event mean
concentration statistics method. Chen et al. (2020)
selected Shenzhen Guanlan River Basin as the
research object, and built an evaluation model of
urban non-point source pollution in the basin through
field investigation and a study on surface
accumulation samples. According to the pollution
status of Guanlan River, the causes of water pollution
and the local watershed planning, Zhang et al. (2018)
put forward new water pollution control measures and
built a flow and water quality coupling model to
quantitatively analyze the water environment
improvement effect of those measures. With the
continuous improvement of the construction of urban
wastewater treatment system and the increasing
influence of different operating conditions of
wastewater treatment plants on the water quality of
rivers in cities, more and more studies show that
working conditions of wastewater treatment system
have an important impact on river water quality (Jia
et al., 2021; Cho et al., 2020; Xiang et al., 2018;
Xiong et al., 2017). However, the above researches
did not consider the working conditions of wastewater
treatment systems in detail. The lack of consideration
of working conditions of wastewater treatment
systems in previous studies limits the accurate
simulation of urban river water quality, or makes it
hard to provide comprehensive support for
developing urban water pollution control schemes.
Different from the above researches, this paper
focuses on the simulation of different working
conditions of wastewater treatment system so as to
quantitatively analyze the influence of different
working conditions of wastewater treatment system
on river water quality.
In response to the insufficient consideration of
different operating conditions of wastewater
treatment system in previous studies, different
working conditions of overflow and water
supplement in Guanlan River Basin were established
according to the current decentralized wastewater
treatment facilities in the basin and the actual
operating conditions of water purification engineering
for Guanlan estuary storage pond. A hydrodynamic
and hydrographic environment mathematical model
for Guanlan River main stream was built, using
pollution indicators like COD, NH
3
-N and TP
concentrations to quantitatively analyze the water
quantity and quality of the basin under different
working conditions overflow and water supplement,
and to simulate the water quality changes in Guanlan
River main stream under different operating
conditions. The model is expected to provide
scientific basis for water pollution control of Guanlan
River Basin.
2 OVERVIEW OF STUDY AREA
2.1 Natural Conditions
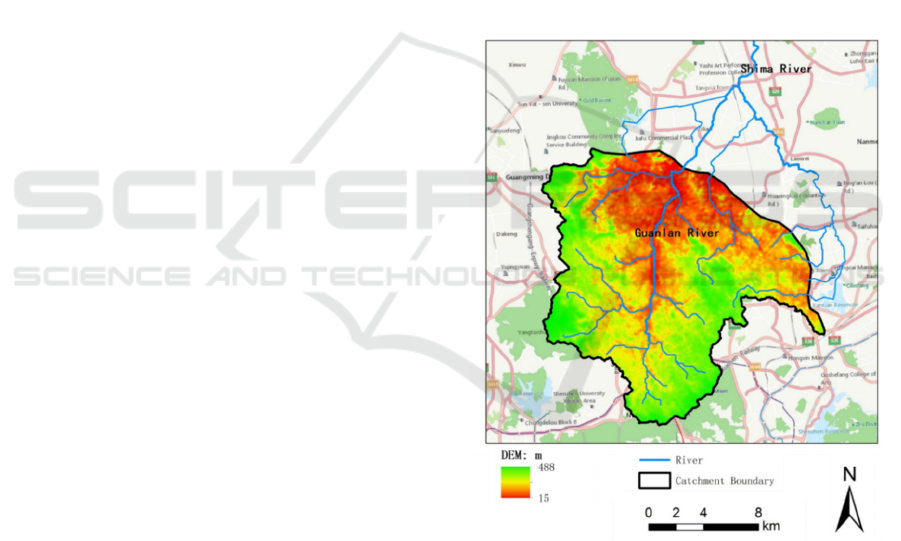
Figure 1: Geographical location of Guanlan River Basin.
Located in the north-central part of Shenzhen,
Guanlan River Basin is the upstream section of Shima
River in Dongjiang River system (Figure 1). The river
basin originates from Jigongtou region of Niuzui
Reservoir in Danaoke Mountain, Minzhi Sub-district.
Its main stream passes through Longhua New District
from south to north, and then enters Dongguan City
through Qiping Village, Guanlan Sub-district. The
rainwater catchment area above the junction between
Research on the Influence of Different Working Conditions of Wastewater Treatment Plants on Water Quality of Guanlan River Main Stream
285

Shenzhen and Dongguan is 196.4 km
2
, and the river
length is 14.2 km (excluding the main source,
Yousong River). Then, the Guanlan River leaves
Shenzhen, merges into other tributaries and forms
Shima River in Tangxia Town, Dongguan City, and
further merges into Dong River at the boundary of
Dongguan and Huizhou. Apart from Guanlan River,
Shima River system contains additionally five
independent tributaries in Shenzhen, i.e., Niuhu River,
Junzibu River, Shanxia River, Egongling River and
Mugu River, all of which join Shima River in
Dongguan City.
Guanlan River Basin involves 31 rivers of
different sizes, serving as drainage channels for floods
from Guanlan River Basin and urban rainwater, and
playing a role of flood control and urban drainage
together with reservoirs, drainage pumping stations
and rainwater drainage culvert systems in the basin.
There are 6 independent rivers, i.e., Guanlan River,
Junzibu River, Niuhu River, Shanxia River,
Egongling River and Mugu River and 14 first-class
tributaries of Guanlan River Basin, of which only
Guanlan River has a catchment area larger than 100
km
2
.
2.2 Current Problems
The recently expanded wastewater treatment plants in
Guanlan River Basin will gradually be put into
operation, and then the source clean-up and rain-
wastewater diversion works will be further promoted
and optimized, which can significantly lower the risk
of wastewater overflow in Guanlan River Basin.
Before the completion of the annual construction
target, however, the following problems may still
exist in the water quality compliance of Guanlan
River Basin:
(1) Insufficient wastewater treatment capacity in
the basin
The daily average water discharge of Guanlan
River is about 10
6
m
3
/d according to the hydrological
monitoring results at Qiping Section in November
2018. The total treatment capacity of the in-service
water purification plants and decentralized
wastewater treatment plants has reached 1.18×10
6
m
3
/d by now. Limited by factors such as changes in
peak of incoming water, sludge disposal and
equipment maintenance, however, the actual daily
treatment capacity of wastewater treatment facilities
in the basin may fluctuate from 8×10
5
to 10
6
m
3
,
which means there is a possible risk of wastewater
overflow.
The existing wastewater treatment plants in the
basin are estimated to be standard raised and capacity
expanded by 2019. By that time new plants (e.g.
Minzhi plant) are anticipated to be completed and put
into operation, and expected to raise the designed
wastewater treatment capacity in the basin to
1.33×10
6
m
3
/d, which is higher than the drainage
volume of the basin in November 2018 (dry season),
and basically meets the needs of wastewater treatment
during the dry season. Nevertheless, it is still possible
that a single-day or instantaneous wastewater inflow
exceeds the designed treatment capacity when
considering the social and economic development,
maintenance and shutdown of wastewater plants and
other factors.
(2) Defective interception box culvert system
The existing box culverts of the Guanlan River
main stream were built on a basis of 7 mm initial and
small rainwater. The intercepting pipes along the river
of tributaries are built with the interception ratio was
set 2-5. The initial and small rainwater system,
however, was not separated from the wastewater
system. As a result, the box culvert is prone to
siltation and overflow. In addition, the interception
capacity of the main stream does not match that of
tributaries, making the tributary box culvert easy to
overflow.
(3) Low operation efficiency of storage ponds
Currently there are 2# (Longhua) storage pond
(volume of 25,900m
3
), 3# (Guanlan) storage pond
(volume of 220,000m
3
) and 4# (estuary) storage
ponds (volume of 220,000m
3
) in Guanlan River Basin.
However, the design objectives of each storage pond
are not clear, resulting in low efficiency of initial
rainwater storage. There is a lack of effective system
linkage between the dispatching scheme of storage
ponds, interception box culverts and wastewater
plants.
Figure 2: River system distribution of Guanlan River Basin.
WRE 2021 - The International Conference on Water Resource and Environment
286
To tackle the above problems and assure the
continuously up-to-standard water quality of Guanlan
River, it is urgent to establish a flow and water quality
model for Guanlan River main stream based on the
current situation of plants, networks, rivers, stations
and ponds in the basin, to calculate and analyze the
water quality changes in the main stream of Guanlan
River, so as to provide a basis for wastewater control
and making dispatching plans for water quantity and
quality in Shenzhen Guanlan River Basin.
3 GUANLAN RIVER MAIN
STREAM FLOW AND WATER
QUALITY MODELING
Guanlan River is considered as a relatively smooth
river as its gradient of the main stream is 1.2‰. The
water bodies are mixed vertically and evenly and are
distributed unevenly in the spatial plane. For this
reason, the depth-averaged two-dimensional
mathematical equation was adopted to describe the
movement characteristics of water flow and quality in
the main stream of Guanlan River in order better to
reveal the overall change characteristics of water flow
and quality in the study area and meet the actual
demand. Through analysis, this study tends to build a
mathematical model for Guanlan River main stream
water environment based on MIKE21.
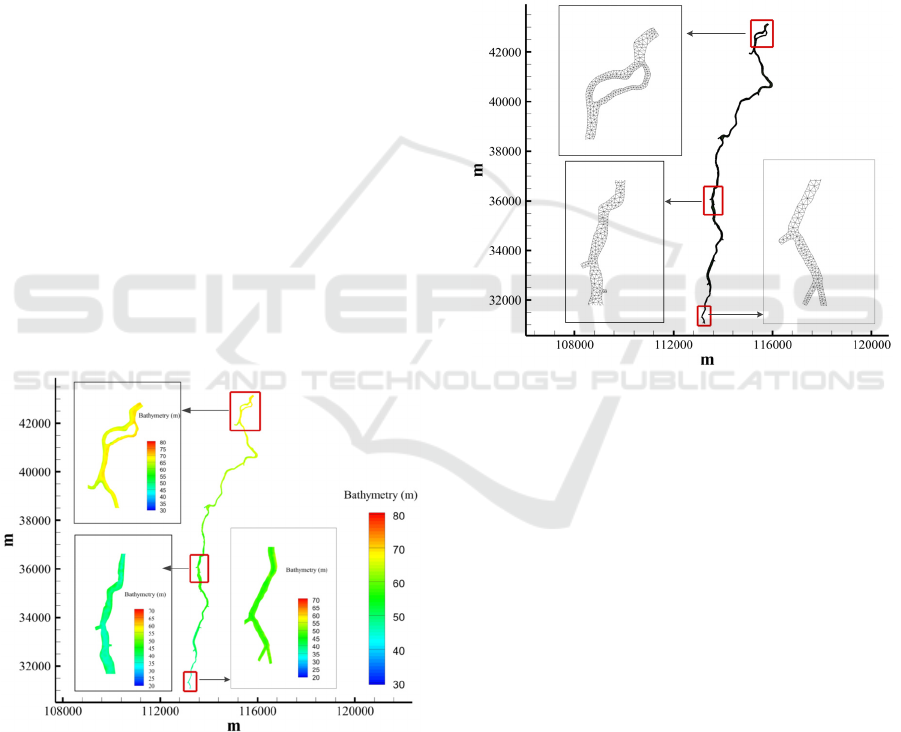
Figure 3: Underwater topographic map.
3.1 Calculation Area and Underwater
Topography
There are 14 first-class tributaries and 5 independent
tributaries (directly entering Dongguan) in the basin.
The length of the main stream is about 17 km. See
Figure 2 for the river system. Through field
investigation and monitoring data analysis, the
calculation area of Guanlan River main stream model
includes all areas of Guanlan River main stream. The
underwater topography after generalization of the
model is shown in Figure 3. Due to the irregular
boundary shape of Guanlan River, it is suggested to
adopt unstructured grid (triangular grid) for division
and enhance the calculation stability of the
mathematical model. The x represents the east
direction, the y represents the north direction, and the
coordinate value is the length. The model involves
2750 nodes and 3835 computational grids (Figure 4).
Figure 4: Grid division chart.
3.2 Calibration and Verification of
Model Parameters
3.2.1 Hydrodynamic Parameters
1) Calibration of hydrodynamic parameters
According to the field investigation and the study
results in similar areas, the initial roughness of
Guanlan River main stream n is assumed as 0.033 for
calculation, and the eddy viscosity coefficient is
determined according to Smagorinsky equation.
2) Verification of hydrodynamic parameters
The measured daily hydrology and other basic data of
Guanlan River main stream were used as the input of
the constructed model for simulation calculation. The
model was verified by the water level data of Qiping
Section at the exit of Guanlan River main stream. The
comparison between the calculated water level
process (from January 1, 2019 to May 31, 2019) of
Qiping Section at the exit of Guanlan River main
stream and the measured water level change process
is shown in Figure 5.
Research on the Influence of Different Working Conditions of Wastewater Treatment Plants on Water Quality of Guanlan River Main Stream
287
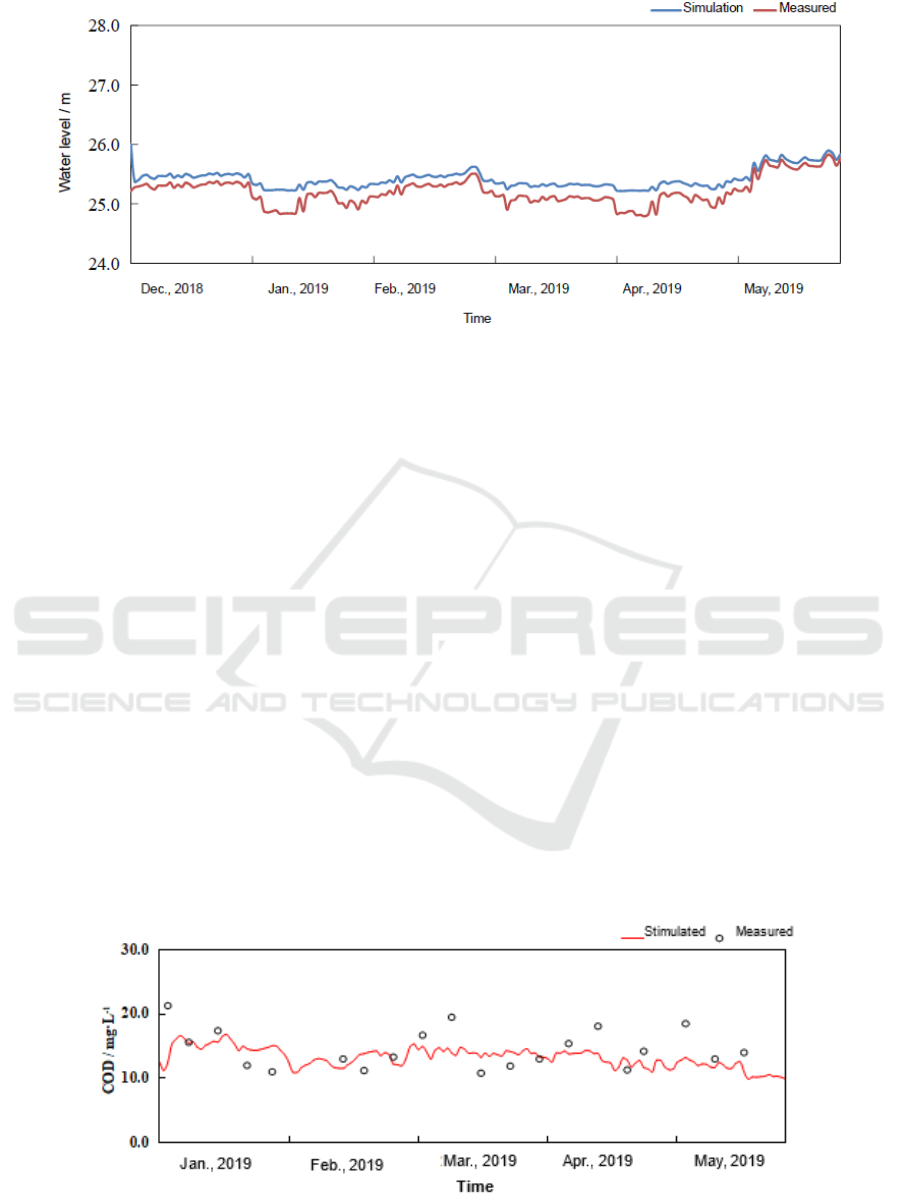
Figure 5: Comparison between the simulated and measured water levels in Qiping Section
3.2.2 Water Quality Parameters
1) Calibration of water quality parameters
From the monitored water quality data from
January 1, 2019 to May 31, 2019, combined with the
study results in similar areas, it can be concluded that
the comprehensive degradation coefficients of COD,
NH
3
-N and TP in Guanlan River are 8.0 e
-8
/s, 1.0 e
-8
/s
and 1.0 e
-8
/s, respectively.
2) Verification of water quality parameters
Available data indicates that overflow occurred all the
time except for 4 days in the first 21 days in March,
2019. During the rainfall period, the facilities in
Guanlan River Basin are unable to fully receive the
mixed flow of rain and wastewater at peak, and the
wastewater interception system may overflow to the
river channel, resulting in the deterioration of the
water quality of main streams and tributaries and the
unstable daily water quality monitoring data of each
tributary estuary. This makes it difficult to calibrate
the water quality model. The measured daily
hydrology and other basic data of Guanlan River main
stream were used as the input of the constructed
model for simulation calculation, and the main
monitoring data of Guanlan River were used for
verification. The water quality data of four monitoring
points, i.e., Qinghu Bridge, Meiguan Expressway,
Fangmapu and Qiping Section along Guanlan River
and 11 first-class rivers of Guanlan River from
January 1, 2019 to May 31, 2019 were simulated and
calculated by the model. See Figure 6 for comparison
between the simulated process of main water quality
(COD, NH
3
-N, TP) and the measured water quality
change process (e.g., Qiping Section of the main
stream). The water quality process of Guanlan River
(COD, NH
3
-N and TP) simulated by the water quality
model is well consistent with the measured values,
demonstrating the constructed water quality model
well reflects the migration and diffusion law of
pollutants in Guanlan River. Therefore, the model can
be used for water environment simulation and
analysis in lake regions along Guanlan River main
stream.
(a) Comparison between the simulated and measured COD concentrations in Qiping Section of main stream
WRE 2021 - The International Conference on Water Resource and Environment
288
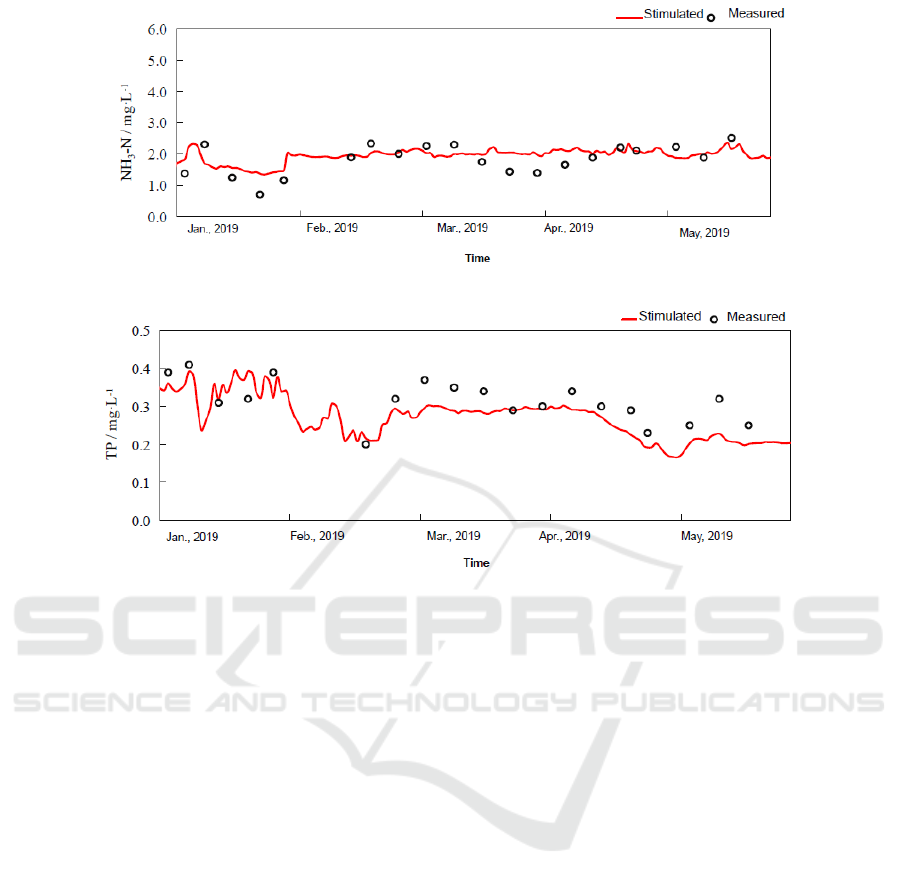
(b) Comparison between the simulated and measured values of NH
3
-N concentration in Qiping Section of main stream
(c) Comparison between the simulated and measured TP concentrations in Qiping Section of main stream
Figure 6: Comparison between the simulated and measured water quality of Qiping Section of main stream.
4 ANALYSIS OF MAIN STREAM
WATER QUALITY CHANGES
UNDER DIFFERENT
OVERFLOW CONDITIONS
4.1 Assumption of Different Overflow
Conditions
According to the analysis of wastewater treatment
capacity of Guanlan River, the daily wastewater
treatment capacity of Guanlan River Basin
wastewater treatment plant varies from 701,500–
1,234,700 tons under the current conditions (January
1–July 31, 2019), while the daily wastewater
treatment capacity of Guanlan River Basin
wastewater treatment plant is 1,075,000 tons under
the current conditions. It can be concluded that the
wastewater treatment facilities basically meet the
needs of basin wastewater treatment under the current
conditions. Field investigation shows that there are
mainly two overflow points in the main stream of
Guanlan River, i.e., the overflow point downstream
the Guanlan water purification plant and the terminal
culvert gate overflow point. When the wastewater
treatment plants in Guanlan River Basin reduce
production or stop production, the wastewater to be
treated will be transferred to the downstream through
the main stream culvert. When it exceeds the box
culvert capacity in the Guanlan estuary storage pond
water purification project, the wastewater to be
treated will continue to fill the box culvert, and the
wastewater in culvert pipes will be forced to the
vicinity of Guanlan water purification plant and
overflow to the main stream of Guanlan River, as
shown in Figure 7.
Research on the Influence of Different Working Conditions of Wastewater Treatment Plants on Water Quality of Guanlan River Main Stream
289
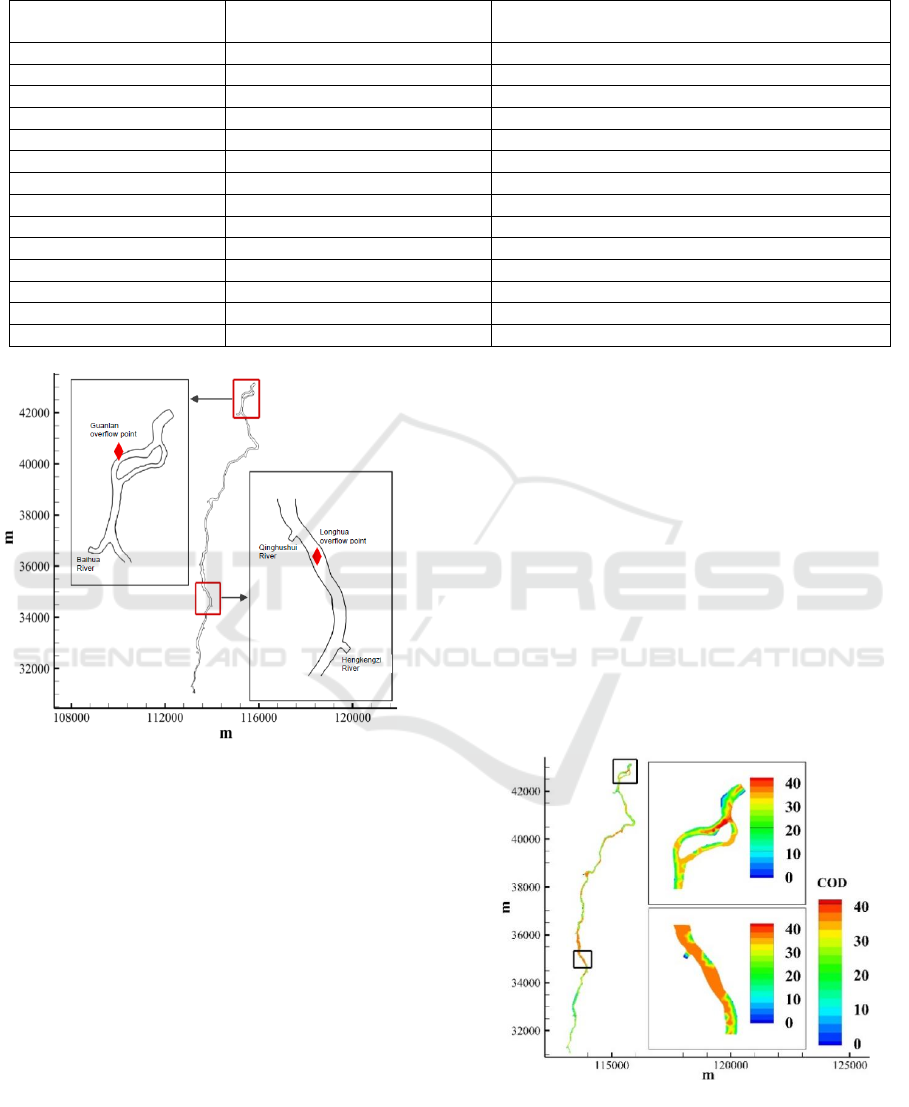
Table 1: Assumption of overflow conditions in Guanlan River main stream.
Operating conditions Downstream the Guanlan water
p
urification
p
lant (×10
4
m
3
/d)
Terminal culvert gate (×10
4
m
3
/d)
Condition 1 3 2
Condition 2 2 1.5
Condition 3 3 3
Condition 4 3 0
Condition 5 10 0
Condition 6 18 0
Condition 7 16 0
Condition 8 14 0
Condition 9 0 15
Condition 10 0 14
Condition 11 0 13
Condition 12 0 19
Condition 13 0 18
Condition 14 0 16
Figure 7: Location of overflow points of Guanlan River
main stream.
4.2 Analysis of Water Quality Changes
in Qiping Section of Guanlan River
under Different Overflow
Quantities
Based on the hydrodynamic and water environment
mathematical model built in Section 3, the flow and
water quality changes in Guanlan River main stream
under those 14 conditions (as shown in Table 1) were
simulated, respectively. The water quality of Guanlan
River main stream and Qiping Section under each
condition was subsequently analyzed according to the
simulation results. Conditions 1, 4 and 9 are used for
specific explanation, while the calculation results of
other conditions are shown in Table 2. Figures 8–10
show the pollutant distribution of Longhua and
Qiping Sections under each condition.
(1) Condition 1 represents all wastewater
treatment plants whose effluent is discharged into the
main stream of Guanlan River operate normally
according to the designed capacity, and indicates the
water quality changes in the section downstream the
Guanlan water purification plant when overflow
occurs, both at the overflow point downstream the
Guanlan water purification plant and at the overflow
point of the terminal culvert gate (Figure 8). Under
Condition 1, COD, NH
3
-N and TP concentrations in
overflow point downstream the Guanlan water
purification plant are 36.59 mg·L
-1
, 2.18 mg·L
-1
and
0.40 mg·L
-1
, while COD, NH
3
-N and TP
concentrations in Qiping Section are 37.22 mg·L
-1
,
2.26 mg·L
-1
and 0.41 mg·L
-1
. The water quality of
Guanlan River main stream is Inferior-to-Class V.
a) COD distribution under Condition 1
WRE 2021 - The International Conference on Water Resource and Environment
290
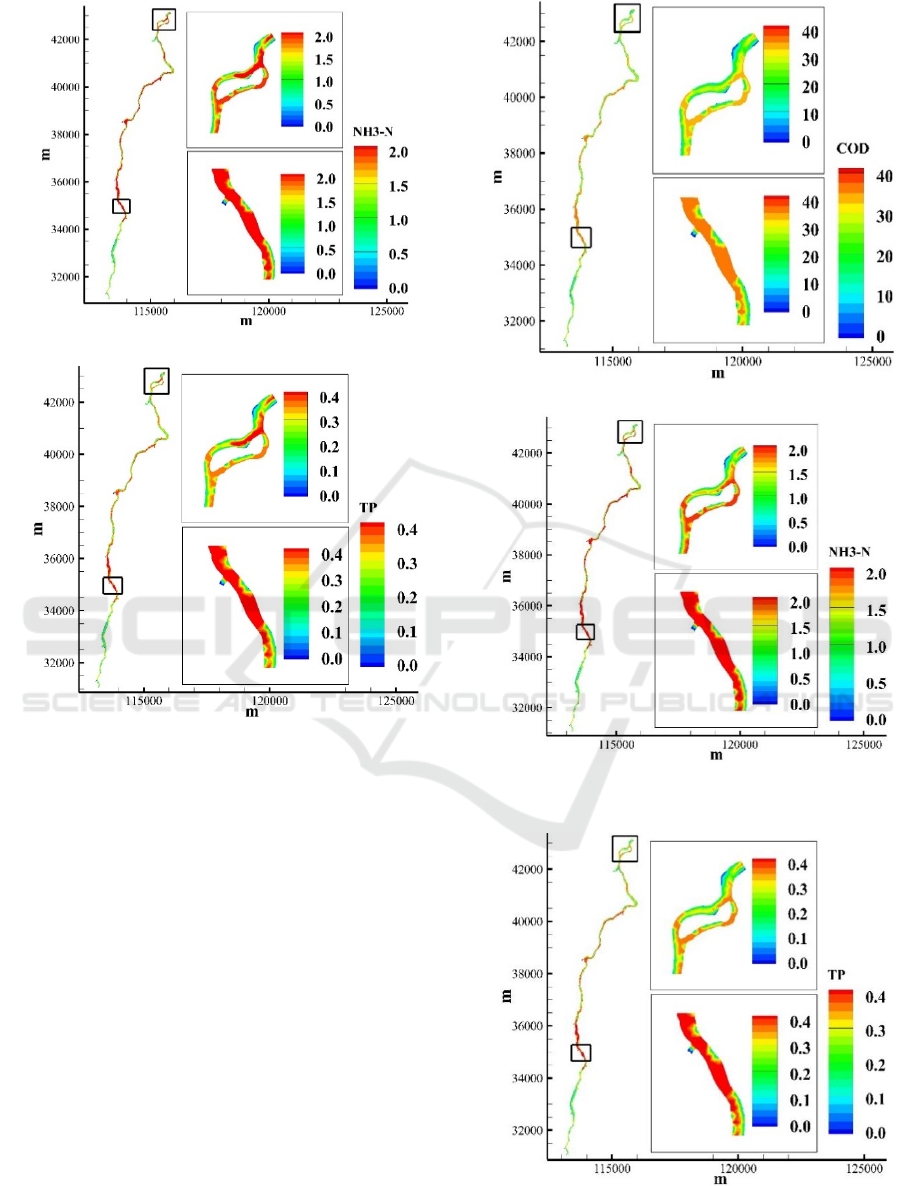
b)
NH3-N distribution under Condition 1
c) Figure 8c. TP distribution under Condition 1
Figure 8. Pollutant distribution under Condition 1.
(3) Condition 9 represents all wastewater
treatment plants whose effluent is discharged into the
main stream of Guanlan River operate normally
according to the designed capacity, and indicates the
water quality changes in the section downstream the
Guanlan water purification plant when overflow does
not occur at the overflow point downstream the
Guanlan water purification plant but occurs at the
overflow point of the terminal culvert gate (Figure 10).
Under Condition 9, COD, NH
3
-N and TP
concentrations at overflow point downstream the
Guanlan water purification plant are 30.57 mg·L
-1
,
1.53 mg·L
-1
and 0.31 mg·L
-1
. COD, NH
3
-N and TP
concentrations in Qiping Section are 39.72 mg·L
-1
,
2.43 mg·L
-1
and 0.45 mg·L
-1
. The water quality of
Guanlan River main stream is Inferior-to-Class V.
a) COD distribution under Condition 4
b)
NH3-N distribution under Condition 4
c) TP distribution under Condition 4
Research on the Influence of Different Working Conditions of Wastewater Treatment Plants on Water Quality of Guanlan River Main Stream
291
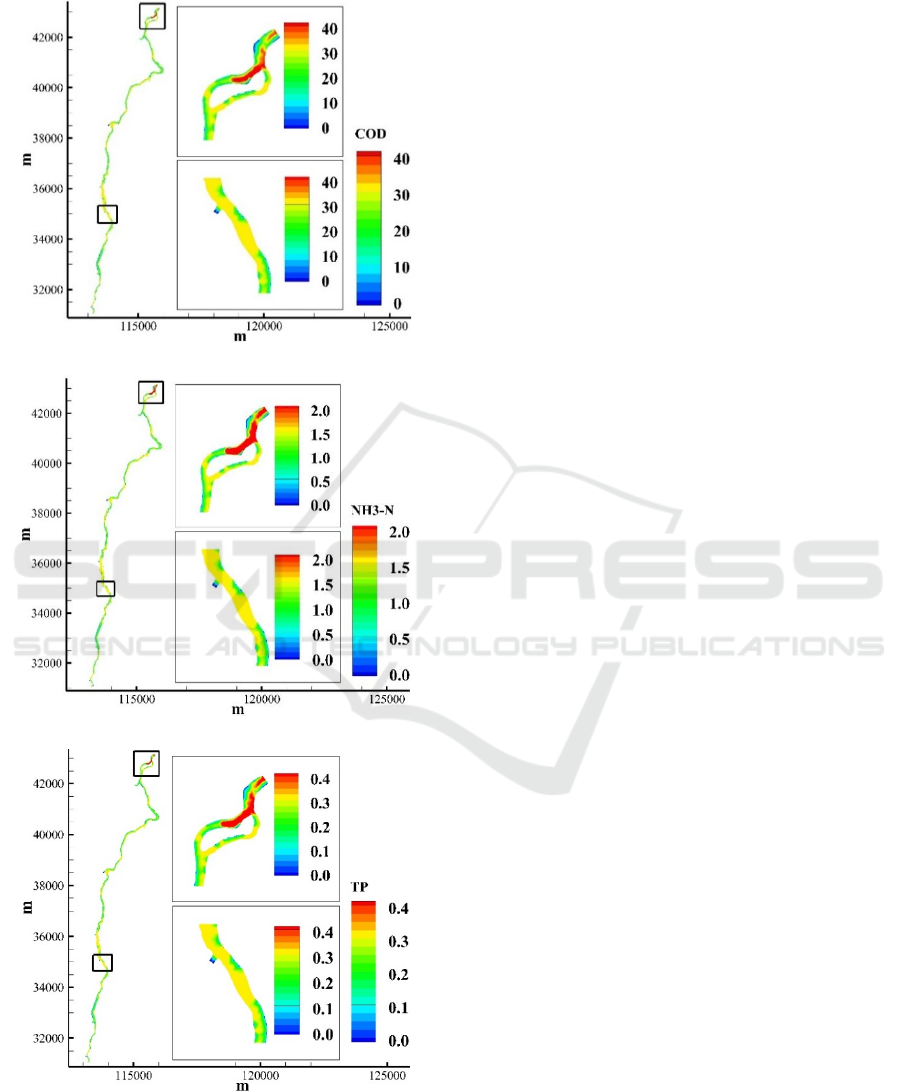
Figure 9: Pollutant distribution under Condition 4.
a) COD distribution under Condition 9
b) NH3-N distribution under Condition 9
c) TP distribution under Condition 9
Figure 10: Pollutant distribution under Condition 9
As shown in the table above, the calculation
results show that: (1) If overflow only occurs at the
overflow point downstream the Guanlan water
purification plant and the overflow volume does not
exceed 30,000 m
3
/d, the water quality of Qiping
Section can meet the assessment requirements; (2) If
overflow only occurs at the overflow point upstream
the terminal gate and the overflow volume does not
exceed 30,000 m
3
/d, the water quality of Qiping
Section can meet the assessment requirements; (3) If
overflow occurs at both overflow points, the water
quality of Qiping Section meets the assessment
requirements only when the overflow volume
downstream the Guanlan plant does not exceed
20,000 m
3
/d and the overflow volume upstream the
terminal gate does not exceed 15,000 m
3
/d.
5 ANALYSIS ON THE
INFLUENCE OF THE
GUANLAN STORAGE POND
WATER PURIFICATION
PROJECT ON WATER
QUALITY OF THE MAIN
STREAM
5.1 Working Conditions Setting of
Water Supplement at Different
Junction of Main and Tributaries
Referring to the water supplement planning of
Longhua District, five working conditions of water
supplement are assumed to analyze the influence of
water supplement at the main stream/tributaries
confluences in the middle and lower reaches of
Guanlan River on the change of water quality in the
main stream. See Table 3 for details.
WRE 2021 - The International Conference on Water Resource and Environment
292
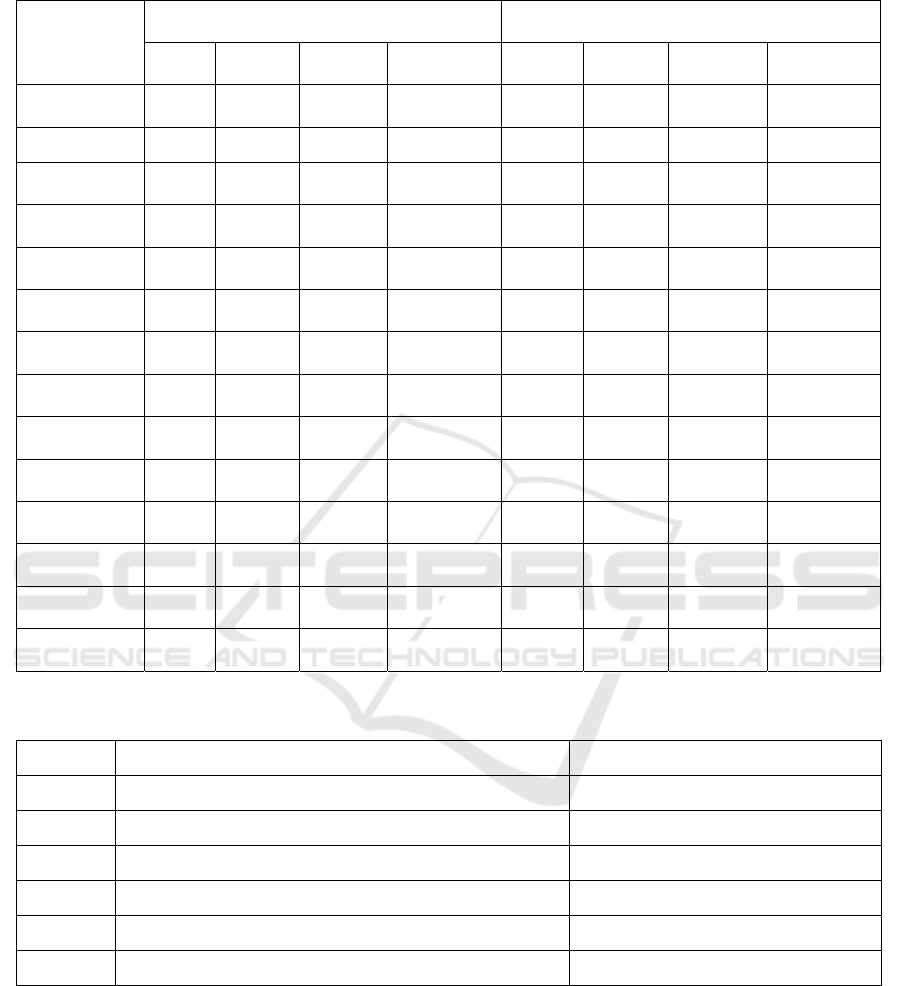
Table 2: Analysis of water quality at the overflow points.
Water
quality
analysis
Overflow point downstream the Guanlan
water
p
urification
p
lant
Qiping Section
COD NH
3
-N TP
Water
standar
d
COD NH
3
-N TP
Water
standar
d
Condition 1
36.59 2.18 0.40
Inferior-to-
Class V
37.22 2.26 0.41
Inferior-to-
Class V
Condition 2
34.62 1.96 0.37 Class V 36.20 2.00 0.39 Class V
Condition 3
36.59 2.18 0.40
Inferior-to-
Class V
39.07 2.47 0.40
Inferior-to-
Class V
Condition 4
40.44 2.72 0.46
Inferior-to-
Class V
44.51 3.13 0.53
Inferior-to-
Class V
Condition 5
50.28 4.30 0.67
Inferior-to-
Class V
41.36 3.13 0.52
Inferior-to-
Class V
Condition 6
46.02 3.69 0.59
Inferior-to-
Class V
38.86 2.75 0.46
Inferior-to-
Class V
Condition 7
42.31 3.05 0.49
Inferior-to-
Class V
36.71 2.36 0.41
Inferior-to-
Class V
Condition 8
38.53 2.39 0.43
Inferior-to-
Class V
34.59 1.98 0.37 Class V
Condition 9
30.57 1.53 0.31 Class V 39.72 2.43 0.45
Inferior-to-
Class V
Condition 10
30.57 1.53 0.31 Class V 37.89 2.23 0.42
Inferior-to-
Class V
Condition 11
30.57 1.53 0.31 Class V 36.02 2.03 0.39
Inferior-to-
Class V
Condition 12
30.57 1.53 0.31 Class V 46.74 3.30 0.56
Inferior-to-
Class V
Condition 13
30.57 1.53 0.31 Class V 45.02 3.11 0.53
Inferior-to-
Class V
Condition 14
30.57 1.53 0.31 Class V 41.50 2.73 0.48
Inferior-to-
Class V
Table 3. Assumption of water supplement conditions at different main stream/tributaries confluences
Condition
Additional point of main stream/tributary estuaries
Additional water volume (×10
4
m
3
/d)
1
Baihuashui River 5
2
Zhangkengjing River 6
3
Dankengshui River 2
4
Xikengshui River 2
5
Changkengshui River 4
6
Qinghushui River 1
5.2 Analysis of Influence of Supplement
Water on Main Stream Water
Quality
The results of numerical simulation analysis on the
middle and lower reaches of Guanlan River show that
the water quality along the main stream of Guanlan
River has been greatly improved in comparison with
the condition without water supplement, as shown in
Figure 11, in which water supplement at the
confluence of main stream/tributaries in the upper
reaches of the basin (Condition 6) has the most
significant effect on reducing COD and TP.
Research on the Influence of Different Working Conditions of Wastewater Treatment Plants on Water Quality of Guanlan River Main Stream
293
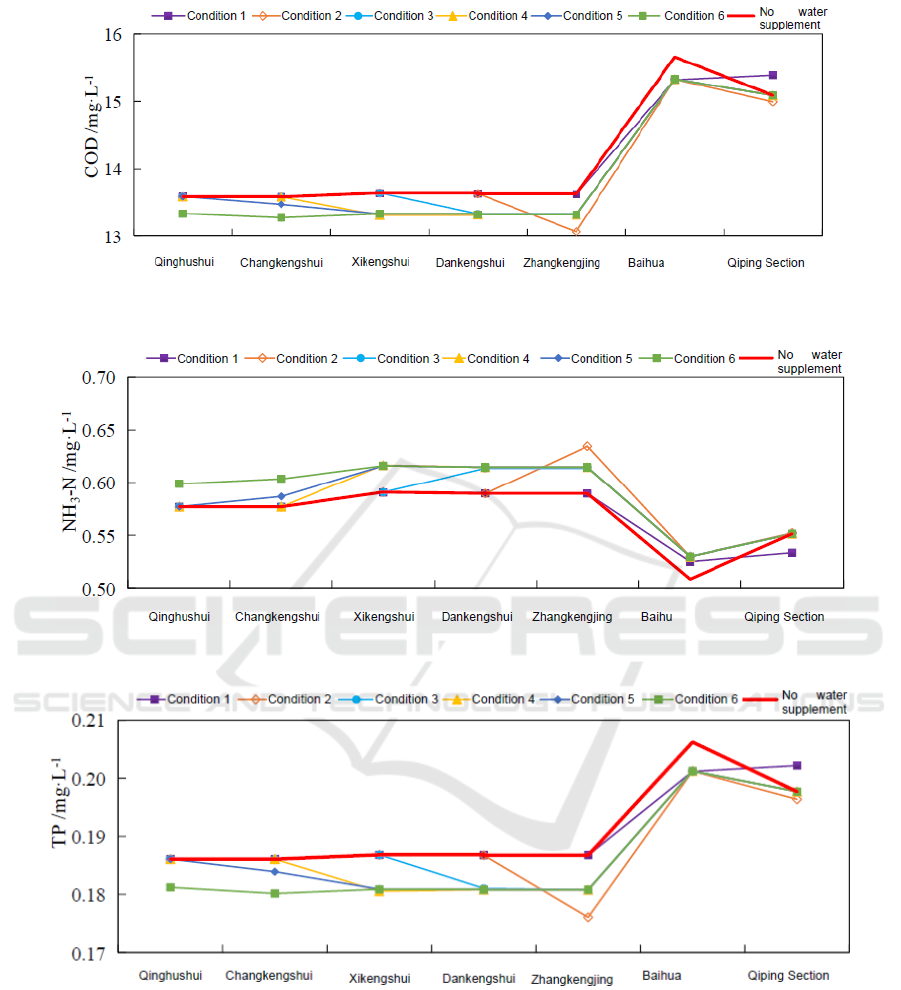
(a) COD changes along the middle and lower reaches of the main stream under each water supplement condition
(b) NH
3
-N changes along the middle and lower reaches of the main stream under each water supplement condition
(c) TP changes along the middle and lower reaches of the main stream under each water supplement condition
Figure 11: Water quality changes along the middle and lower reaches of Guanlan River main stream under each water
supplement condition.
6 CONCLUSIONS
In this study, a depth-averaged 2D mathematical
equation was used to describe the characteristics of
water quality in the main stream of Guanlan River,
and a MIKE21-based mathematical model for water
environment in the main stream of Guanlan River was
built. According to the actual operating conditions of
the decentralized wastewater treatment facilities in
Guanlan River Basin and the Guanlan estuary storage
pond water purification project, different overflow
WRE 2021 - The International Conference on Water Resource and Environment
294

and water supplement condition were assumed. By
using the mathematical model of hydrodynamic water
environment, the influence of different working
conditions overflows and water supplement on the
water quality changes of Guanlan River was
simulated and quantitatively analyzed.
When the main stream of Guanlan River
overflows, the simulation results show that: (1) If
overflow only occurs at the overflow point
downstream the Guanlan water purification plant and
the overflow volume does not exceed 30,000 m
3
/d, the
water quality of Qiping Section can meet the
assessment requirements; (2) If overflow only occurs
at the overflow point upstream the terminal gate and
the overflow volume does not exceed 30,000 m
3
/d, the
water quality of Qiping Section can meet the
assessment requirements; (3) If overflow occurs at
both overflow points, the water quality of Qiping
Section meets the assessment requirements only when
the overflow volume downstream the Guanlan plant
does not exceed 20,000 m
3
/d and the overflow volume
upstream the terminal gate does not exceed 15,000
m
3
/d. In addition, the calculation results demonstrate
that the concentrations of COD, NH
3
-N and TP along
the main stream are obviously lower under all
working conditions of water supplement. The above
conclusions are expected to provide a scientific basis
for water pollution control of Guanlan River Basin.
ACKNOWLEDGEMENT
This study is funded by the Water Resource Science
and Technology Innovation Program of Guangdong
Province (2017-03).
REFERENCES
Beletsky, D., Schwab, D., & McCormick, M. (2006).
Modeling the 1998 -2003 summer circulation and
thermal structure in Lake Michigan. Journal of
Geophysical Research, 111, 18.
Chen, C. S., Liu, H., & Beardsley, R. C. (2003). An
unstructured, finite-volume, three-dimensional,
primitive equation ocean model: application to coastal
ocean and estuaries. Journal of Atmospheric and
Oceanic Technology, 20, 159-186.
Chen, T., Sun, F. Y., Yang, & S. F., et al. (2020). Load
quantification and effect evaluation of urban non-point
source pollution in the Guanlan River Basin based on
SWAT model. Chinese Journal of Environmental
Engineering, 14(10), 2866-2875.
Cheng, X., Chen, L. D., & Sun, R. H. (2017). Estimation of
non-point source pollution loads of Beijing-Tianjin-
Hebei region considering precipitation and topography.
Transactions of the Chinese Society of Agricultural
Engineering, 124(9): 869-879.
Cho, K. H. et al. (2020). Data assimilation in surface water
quality modeling: A review. Water Research, 186, 1-12.
Huang, A., Rao, Y. R., & Lu, Y. (2010). Evaluation of a 3-
D hydrodynamic model and atmospheric forecast
forcing using observations in Lake Ontario. Journal of
Geophysical Research, 115, 13.
Huang, Y. K., Li, Y. P., Qiu, L., Xue, S. Q., & Zhang, S. S,
(2015). Risk prediction on wharf oil spill in the lower
reaches of Yangtze River based on EFDC. Water
Resources Protection, 31, 91-98.
Jia, Y. Y. et al (2021). Water quality modeling in sewer
networks: Review and future research directions. Water
Research, 202, 117419.
Jorgensen, S. E., Loffler H, & Rast W. (2005). Lake and
reservoir management. Elsevier Science Ltd.
Shchepetkin, A. F., & Mcwilliams, J. C. (2005). The
regional oceanic modeling system (ROMS): a split-
explicit, free-surface, topography-following-coordinate
oceanic model. Ocean Modelling, 9, 347-404.
Sun, L. L., Wang, S. Q., Shi, B. H. & Li, S. (2017).
Simulation study of hydrodynamic model in
Huangbizhuang reservoir based on MIKE21FM. Pearl
River, 38, 64-68.
Wang, J. X., Luo, B., Chen, M. M. et al. (2014). Study on
the characteristics of urban non-point source pollution
and its discharge load: a case study for Neijiang,
Sichuan province. Ecology and Environment Sciences,
23(1), 151-156.
Xiang, C. H. et al. (2018). Water Quality Simulation
Analysis and Scheduling Scheme of Huarong River.
Journal of Water Resources Research, 7(4), 1-17.
Xiong, H. B. et al (2017). Environment Capacity of the
Guohe River in the Water Transfer Project from
Yangtze River to Huaihe River Based on a MIKE 11.
Model Journal of Natural Resources, 32(8), 1422-1432.
Yang, L., Sun, C. H., & Wang, Y. G., et al. (2015). Study
on construction of dynamic renewal system of urban
non-point source pollution load. Environmental
Protection Science, 41(2), 63-66.
Yuan, X. Y., & Xu, D. L. (2006). The application of
Denmark MIKE21 model in the calculation of
backwater of bridge crossing. Yangtze River, 37, 31-33.
Yang, F., Wei, Z. L., & Liu, J. M., et al. (2021). Study on
optimal water dispatching plan for improving urban
river and lake water quality after rainfall based on
SWMM and MIKE11. Water Resources and
Hydropower Engineering, 6(1), 1-15.
Zhang, L., Zhou. J. Y., & Wang, J. S., et al. (2018). Study
on the current situation of Guanlan River water
environment and comprehensive treatment of water
pollution. Chinese Society for Environmental Sciences.
Proceedings of 2018 CSES Annual Conference on
Environmental Science and Technology (Volume II).
Zuo, Q. T., & Li, D. F. (2013). Research on regulation for
pollution-control of dams on heavily polluted river base
on the model of simulation and optimization. Journal of
Hydraulic Engineering, 44, 979-986.
Research on the Influence of Different Working Conditions of Wastewater Treatment Plants on Water Quality of Guanlan River Main Stream
295
