
Two-dimensional Hydrodynamics and Water Environment
Simulation: A Case Study in the Guanlan River Basin in China
Xiaoqi Zhang
1,2,3
, Shuai Xie
1,2,3
, Tao Zhou
1,2,3
, Yongqiang Wang
1,2,3,*
, and Yilin Du
1,2,3
1
Changjiang River Scientific Research Institute, Changjiang Water Resources Commission of the Ministry of Water
Resources of China, Wuhan 430010, China
2
Hubei Key Laboratory of Water Resources & Eco-Environmental Sciences, Changjiang River Scientific Research Institute,
Wuhan 430010, China
3
Research Center on the Yangtze River Economic Belt Protection and Development Strategy, Hubei Wuhan 430010, China
Keywords: Urban River, Hydrodynamics, Water Environment, Guanlan River
Abstract: As an important resource and environmental carrier, urban rivers are related to the survival of the city and
restrict the development of the city. However, situations caused by environmental degradation, water pollution
occurs in urban rivers. Therefore, comprehensive treatment of urban water pollution has become a necessity.
This study establishes a two-dimensional Hydrodynamics and Water Environment (HWE) model based on
MIKE21 FM, and then the simulation effect of the proposed HWE model is verified by comparison with the
measured data. With Shenzhen city’s Guanlan River as a case study, the results indicate that (1) the water
level and water quality of the proposed HWE model have a good fit; (2) the flow velocity of the main stream
in the Guanlan River shows a gradual increase trend from the upstream to the downstream, that is, the average
flow velocity values of the upstream, middle, downstream reaches are 0.034 m·s
-1
, 0.041m·s
-1
, and 0.183 m·s
-
1
; and (3) the temporal and spatial distribution of the water quality parameters in the Guanlan River shows
that the flow of river water has a diluting effect on the sewage discharged from the sewage treatment plant.
These findings are helpful to the analysis of urban river’s hydrodynamics and water environment
characteristics.
1 INTRODUCTION
Urban rivers are an integral part of human life, and
the ecological foundation of the urban environment
(Zhang et al., 2017). However, urban rivers are facing
problems such as water degradation, water pollution,
and the gradual decline of the aquatic ecological
environment due to anthropogenic factors as
consequence of rapid economic development and
global climate change (Ge et al., 2020; Niu et al.,
2021; Zhang et al., 2021). Therefore, the
comprehensive management for the rivers is of
significance for the urban development with the
purpose of the harmony between human beings and
water resources.
Hydrodynamics is the basis for studying the
evolution of river flow. The two main methods
commonly adopted for researching on
hydrodynamics are mathematical statistics and
mathematical model simulation (Sun et al., 2017).
Generally, there exists certain errors between the
results of mathematical statistics and the real results
due to the complexity of the actual situation, and the
method lacks an analysis of the mechanism. With the
development of computer technology, mathematical
model methods have gradually been applied to the
field of water resources, and this method can make up
for the deficiencies of mathematical statistics in
mechanism research (Huang et al., 2015; Shchepetkin
et al., 2005). Correspondingly, numerical simulation
software has also been widely applied, and commonly
used simulation software includes EFDC, ROMS,
MIKE, HEC-RAS 2D, Iber 2D, Flood Modeller 2D,
and PCSWMM 2D etc. (Chen et al., 2003; Pinos et
al., 2019; Yuan et al., 2006).
Research on river water environment mostly
focuses on the source and migration process of water
quality elements, which is the research foundation for
comprehensive treatment of water environment in
rivers (
Zuo & Li, 2013). Cui et al. (2021) analyzed the
characteristics of temporal and spatial changes in
river water quality with the help of logarithmic power
Zhang, X., Xie, S., Zhou, T., Wang, Y. and Du, Y.
Two-dimensional Hydrodynamics and Water Environment Simulation: A Case Study in the Guanlan River Basin in China.
In Proceedings of the 7th International Conference on Water Resource and Environment (WRE 2021), pages 275-283
ISBN: 978-989-758-560-9; ISSN: 1755-1315
Copyright
c
2022 by SCITEPRESS – Science and Technology Publications, Lda. All rights reserved
275
function universal index formula. Wang et al. (2021)
analyzed the influence of environmental changes on
system attributes by establishing 14 Ecopath models
composed of 28 functional groups along a subtropical
urban river. Zhang et al. (2020) selected Chemical
Oxygen Demand (COD), Total Phosphorus (TP) and
Ammonia nitrogen content index (NH
3
-N) as
characteristic indexes to simulate the hydrodynamic
and water quality of the Shunyi section of Chaobai
river based on MIKE21 model. However, the research
on joint analysis of the two-dimensional
hydrodynamic and water environment of urban rivers
by considering the impact of sewage treatment plants
still have room for exploration, which are necessary
for comprehensive management of urban river
environment. Therefore, the aim of this paper is to
establish a coupling model of hydrodynamics and
water environment based on MIKE21 FM, and then
analyze the hydrodynamic characteristics and
pollutant migration law, which serves to find the key
influencing factors for the comprehensive
management of urban rivers.
2 STUDY AREA AND
METHODOLOGY
2.1 Study Area
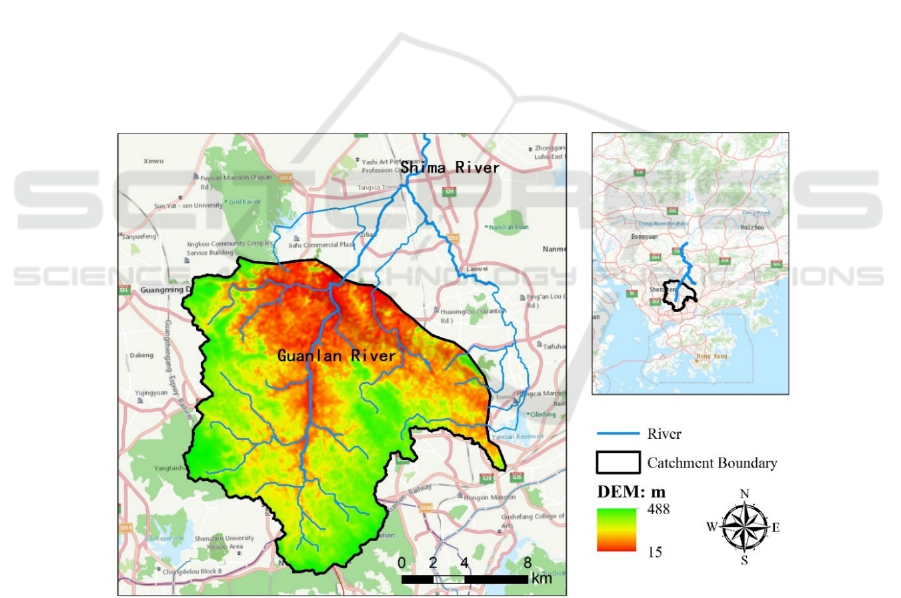
The Guanlan River Basin (22.58°-22.76°N, 113.96°-
114.16°E) was selected as the study area (Figure 1),
which is in the north-central part of Shenzhen city,
south-central Guangdong province, southeastern
China. The Guanlan River, one of the five major
rivers in Shenzhen with a catchment area of more than
100 km
2
, is the upstream section of the Shima River
in the Dongjiang water system. It originated in
Jigongtou, Niuzui Reservoir in the Cerebral Shell
Mountain (385.4 masl). The mainstream passes
through Longhua New District from south to north,
enters the territory of Dongguan City below Qiping,
Guanlan Street, and merges into Dongjiang River at
the junction of Dongguan and Huizhou. The Guanlan
River Basin referred to in this article includes the
Guanlan River sub-basin and other tributaries of the
Shima River system located in Shenzhen, with a total
area of 247.3 km
2
.
Figure 1: A schematic diagram of the study area.
The underlying surface of the Guanlan River
Basin is divided into six categories: green space,
water body, roof, bare soil and pavement. The area of
green land (including mountains) is 104.25 km
2
,
water area is 11.25 km
2
, roof area is 40.17 km
2
, road
area is 38.39 km
2
, bare soil area is 2.64 km
2
, paving
area is 50.55 km
2
, and the above-mentioned area is
247.3 km
2
in total.
WRE 2021 - The International Conference on Water Resource and Environment
276
2.2 Database
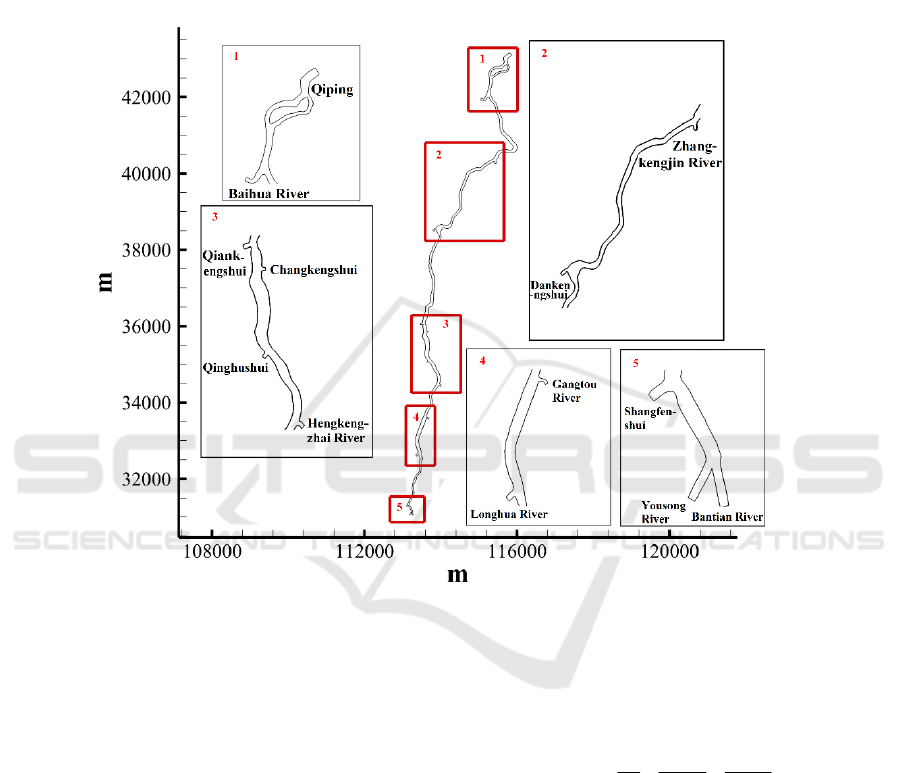
The data involved in this study mainly include the
measured water quality data of the Guanlan River’s
main stream (GRMS) from January 1st to June 1st,
2019, and the current water environment monitoring
data acquired during the project period. The main
water quality indicators include COD, NH
3
-N and TP.
The 13 amphibious boundaries (only 6 have flow
sequence data, among which Niuzui River and
Minzhi River merge into Yousong River, and
Dashuikeng River merges into Baihua River) and 13
point-source hydrodynamic boundaries are shown in
Figure 2.
Figure 2: Generalized diagram of model hydrodynamic boundary.
2.3 Model Governing Equation
The GRMS is a relatively smooth river with a slope
of 1.2‰. The vertical mixing of the water body is
relatively uniform, and the uneven distribution of the
spatial plane is relatively significant. Therefore, a flat
two-dimensional mathematical equation with average
water depth is used to describe the water quality
movement characteristics of the GRMS from the
perspective of reflecting the overall change
characteristics of water quality in the study area. The
mathematical model of the water environment in the
GRMS based on the MIKE21 model is established.
The hydrodynamic control equation of MIKE21
FM module can be expressed as:
(1) Continuity equation
() ()hhu hv
hS
tx y
∂∂ ∂
++=
∂∂ ∂
(1)
Two-dimensional Hydrodynamics and Water Environment Simulation: A Case Study in the Guanlan River Basin in China
277
(2) Momentum equation
22
000
0
0
2
1
+()()
asxbx
xy
xx
xx xy s
P
hu hu huv h gh
fvh gh
tx y x x x
s
s
hT hT hu S
xy x y
ττ
ρρ
ρ
ρ
ρρ
∂
∂∂ ∂ ∂ ∂
++=− − − +−
∂∂ ∂ ∂ ∂ ∂
∂
∂
∂∂
−+++
∂∂ ∂ ∂
ŋ
(2)
22
00
0
00
1
+()()
2
s
yby
a
yx yy
xy yy s
P
hv huv hv h gh
fuh gh
tx y y y y
ss
hT hT hu S
xy x y
ττ
ρ
ρ
ρρ
ρ
ρ
∂
∂∂ ∂ ∂ ∂
++=−− − − +−
∂∂ ∂ ∂ ∂ ∂
∂∂
∂∂
−+++
∂∂ ∂ ∂
ŋ
(3)
The MIKE21 FM water quality module adopts
the convection-diffusion equation, and the governing
equation is:
() ( ) ( ) ) )
()()
xy
hc uhc vhc c c
hE hE khc S
tx yxxyy
∂∂ ∂ ∂∂∂∂
++= + −+
∂∂ ∂∂∂∂∂
(4)
where
xy
represent the Cartesian coordinate system,
t
is the time,
u
and
v
are the velocity
components in the
x
and
y
directions,
respectively,
h
is the total water depth,
S
is the
source term,
d
is the still water depth,
η
is the
water level,
a
P
is the local atmospheric pressure,
ρ
is the density of water,
0
ρ
is the reference water
density,
2sinf
φ
=Ω
is the Coriolis coefficient (
Ω
is the angular rate of the earth’s rotation and
φ
is the
geographic latitude),
x
x
s
,
x
y
s
,
yx
s
,
yy
s
are the
radiation stress component,
f
u
,
f
v
are the
acceleration caused by the rotation of the earth,
s
x
τ
,
s
y
τ
are the surface wind stress,
bx
τ
,
by
τ
are the
bottom friction stress,
c
is the concentration of
pollutants,
x
E
,
y
E
are respectively sum of
turbulent diffusion coefficient and dispersion
coefficient in
x
and
y
directions,
x
x
T
,
x
y
T
,
yx
T
,
yy
T
are the horizontal viscous stress,
k
is the
attenuation coefficient.
3 GENERALIZATION OF THE
HWE MODEL
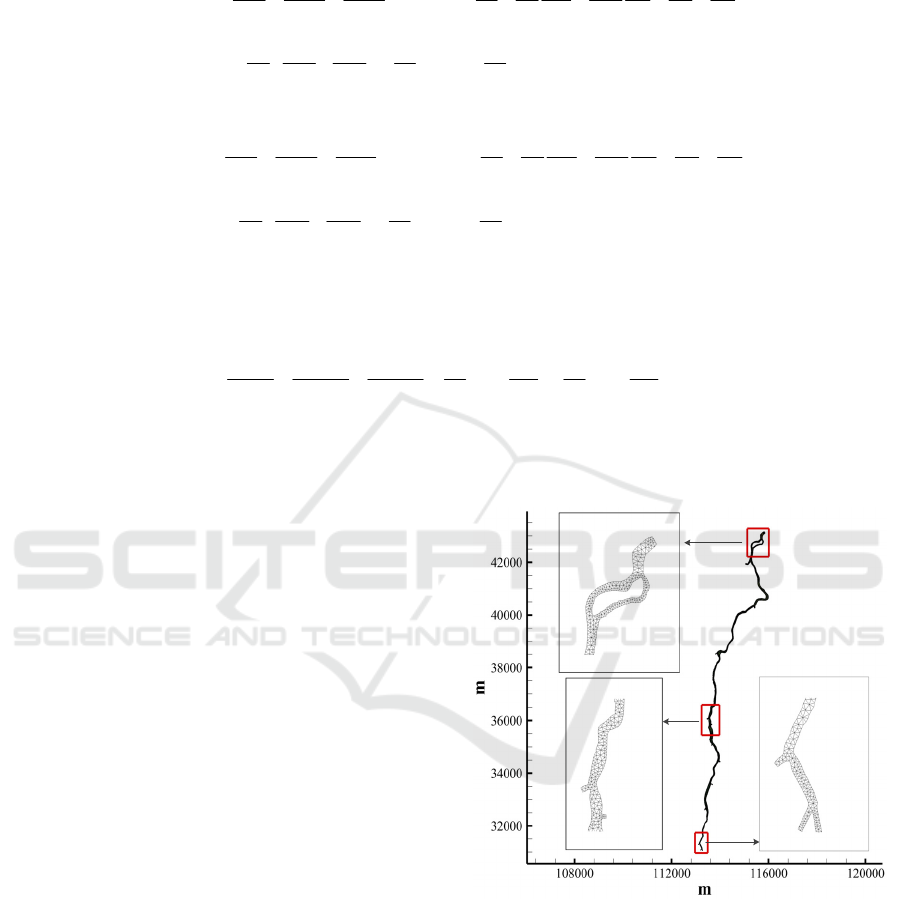
The calculation area in this study includes all areas of
the GRMS. Due to the irregular shape of the boundary
of the GRMS, the model should be divided by the
unstructured grid (triangular grid) processing method,
and the calculation stability of the mathematical
model should be ensured.
x
represents the east
direction,
y
represents the north direction, the unit
of coordinate value is meters. The model has a total
of 2750 nodes and 3835 calculation grids, which is
shown in Figure 3.
Figure 3: Meshing diagram.
WRE 2021 - The International Conference on Water Resource and Environment
278
4 CALIBRATION AND
VERIFICATION FOR
PARAMETERS OF THE HWE
MODEL
4.1 Hydrodynamic Parameters
The roughness of the GRMS is n=0.033 as the initial
roughness for calculation, and the eddy viscosity
coefficient is determined according to the
Smagorinsky formula. The measured daily hydrology
and other basic data of the GRMS are the input data
for the model, and the calculated output of the model
is compared with the monitoring data of the water
level at the outlet section of the GRMS. The
comparison results of the simulated and measured
water level of the Qiping section in the GRMS from
January 1, 2019 to May 31, 2019 are shown in Figure
4.
Figure 4: Comparison results of simulated and measured water level of Qiping section.
4.2 Water Quality Parameters
The comprehensive degradation coefficients of the
main water quality indicators, COD, NH
3
-N and TP,
considered for the GRMS are 8.0e
-8
/s, 1.0e
-8
/s, 1.0e
-
8
/s, respectively. The measured daily hydrology and
water quality data of the Guanlan River’s main stream
are used as the input data for the HWQ model, and the
simulation results are compared with the main
monitoring data of the GRMS to verify the reliability
of the model. The water quality results including the
four monitoring points (i.e., the Qinghu Bridge,
Meiguan Expressway, Fangmapu and Qiping
Sections on the main stream of the Guanlan River)
and the 11 first-class rivers entering the estuary from
January 1, 2019 to May 31, 2019 are simulated by the
HWQ model. The water quality (COD, NH
3
-N and
TP) process of the GRMS and the confluence of
various rivers simulated by the model fits well with
the measured values, indicating that the constructed
water quality model can better reflect the migration
and diffusion of pollutants in the main stream of the
Guanlan River. The Gangtou River estuary section is
selected to show the fitting effect of COD, NH
3
-N and
TP parameters (Figure 5).
Two-dimensional Hydrodynamics and Water Environment Simulation: A Case Study in the Guanlan River Basin in China
279
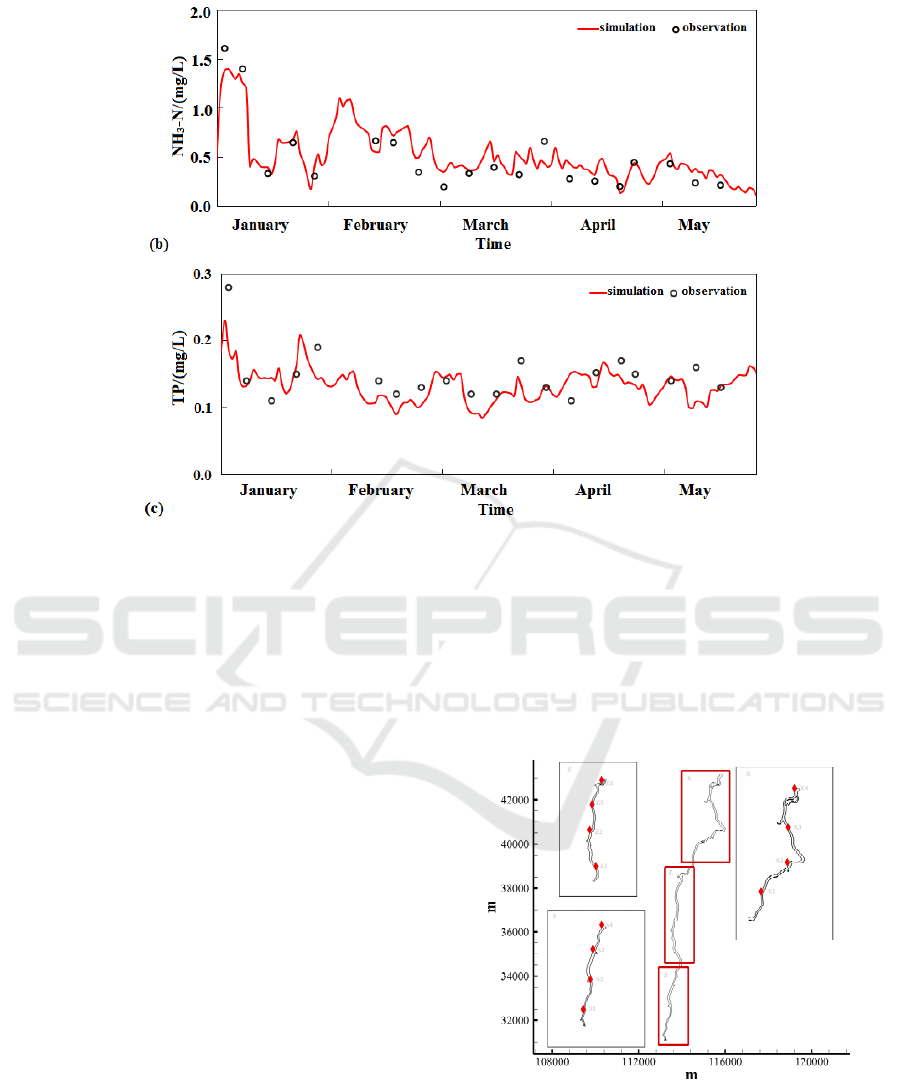
Figure 5: Comparison results of simulated and measured water quality of Gangtou River Estuary: (a) COD; (b) NH3-N; (c)
TP.
5 CHARACTERISTIC ANALYSIS
OF HYDRODYNAMICS AND
WATER ENVIRONMENT
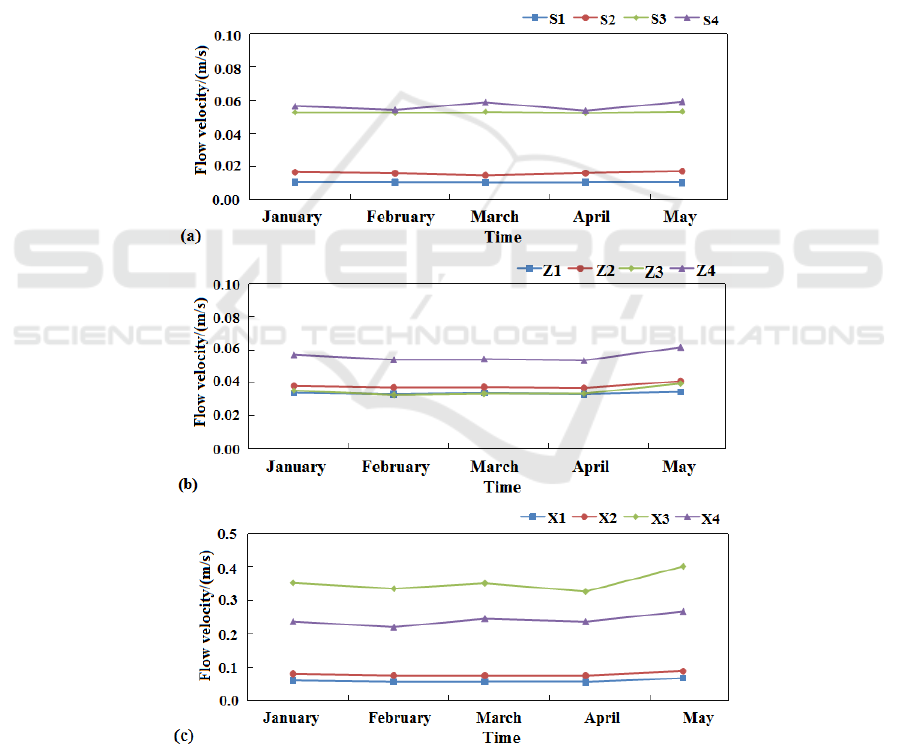
The GRMS is divided into three areas: the upstream
(S), the middle (Z) and the downstream (X). Each
area selects four points, the monthly average value of
which is used to analyse the regional characteristics
(Figure 6).
5.1 Hydrodynamic Characteristics of
the Main Streamin Guanlan River
As shown in Figure 7, the hydrodynamic
characteristics and pollutant migration laws of the
main stream in the Guanlan River from January 1,
2019 to May 31, 2019 were analyzed based on the
simulation results derived by the proposed
hydrodynamic and water environment model. The
range of flow velocity of the GRMS is 0-0.354 m·s
-1
,
and the average flow velocity is 0.086 m·s
-1
. The
average flow velocity values of the upstream, middle,
downstream reaches are 0.034 m·s
-1
, 0.041m·s
-1
, and
0.183 m·s
-1
. As the upstream slope of the GRMS is
gentler than the middle and lower reaches, the upper
reaches are obviously influenced by river retention.
Furthermore, the middle and downstream flow
velocity is relatively large due to the gravity of the
water flow. Therefore, the flow velocity of the GRMS
gradually increases from the upstream to the
downstream.
X
X
Z
Z
S
S
X4
Z3
Z4
Z2
Z1
X3
X2
X1
S4
S3
S2
S1
Figure 6: Schematic diagram of main points on the Guanlan
River’s main stream.
WRE 2021 - The International Conference on Water Resource and Environment
280
5.2 Temporal and Spatial Distribution
Characteristics of Water
Environment in the Guanlan
River’s Main Stream
The sewage treatment plants are mainly distributed in
the middle and lower reaches, and the three water
quality indicators, COD, NH
3
-N and TP are used to
analyze the temporal and spatial distribution
characteristics of water quality in the GRMS. In
Figure 8(a), the average concentrations of COD in the
upstream, midstream and downstream are 12.36
mg·L
-1
, 12.92 mg·L
-1
and 13.31 mg·L
-1
, respectively.
Figure 8(b) shows that the average concentrations of
NH
3
-N in the upstream, midstream and downstream
are 0.80 mg·L
-1
, 0.48 mg·L
-1
and 0.46 mg·L
-1
,
respectively, while the average concentrations of TP
in the upstream, midstream and downstream
respectively are 0.15 mg·L
-1
, 0.23 mg·L
-1
and 0.24
mg·L
-1
. The change trends of the water quality
indicators in the upper, middle and downstream
districts are due to the dilution effect of the sewage
treatment plants along the way to the water body,
which can be concluded from the results of Figure 8-
9 as follows: (i) as shown in Figure 8, the dilution
effect of the sewage treatment plants on NH
3
-N from
upstream to downstream is significant; (ii) take the
simulation results of water quality in the downstream
section as an example, the index values of COD and
TP show a decreasing trend from the upper section to
the lower section.
Figure 7: Changes in the flow velocity of the main stream of the Guanlan River: (a) upstream (S); (b) middle (Z); (c)
downstream (X).
Two-dimensional Hydrodynamics and Water Environment Simulation: A Case Study in the Guanlan River Basin in China
281
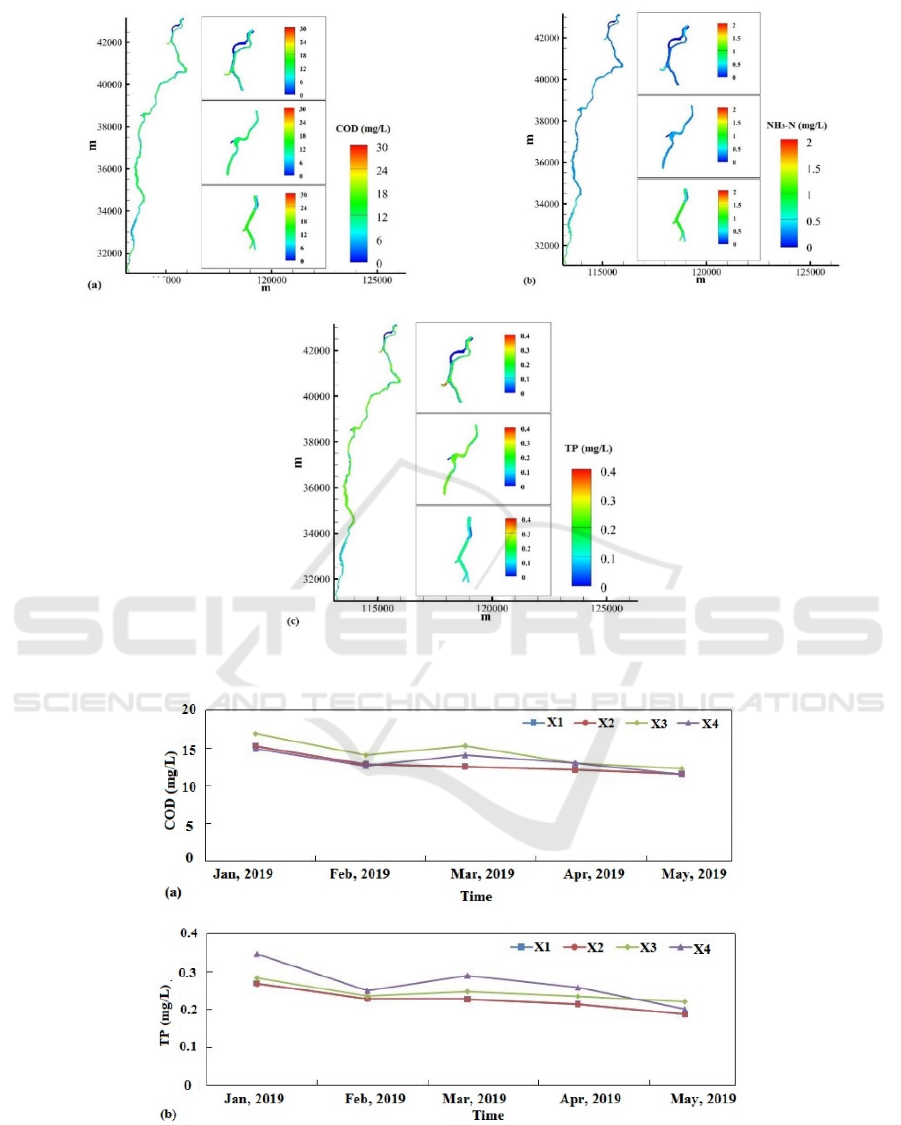
Figure 8: Distribution of water quality in Guanlan River’s main stream: (a) COD; (b) NH3-N; (c) TP.
Figure 9: Changes of water quality in the downstream of the Guanlan River’s main stream: (a) COD; (b) TP.
WRE 2021 - The International Conference on Water Resource and Environment
282

6 CONCLUSIONS
In this paper, combined with the characteristics of the
Guanlan River project, a two-dimensional HWE
model for the GRMS was constructed based on
MIKE21 FM. Then, the measured water level and
flow data of each section of the Guanlan River is used
to calibrate and verify the rationality of the model
establishment. The main conclusions are summarized
as follows:
(1) The water level and water quality of the
proposed HWE model have a good fit, which can be
applied to the simulation analysis of the Guanlan
River’s hydrodynamic and water environment
scenarios.
(2) As the upstream slope of the GRMS is gentler
than the middle and lower reaches, the flow velocity
of the GRMS shows a gradual increase trend from the
upstream to the downstream, that is, the average flow
velocity values of the upstream, middle, downstream
reaches are 0.034 m·s
-1
, 0.041m·s
-1
, and 0.183 m·s
-1
.
(3) The change trends of the water quality
indicators in the upper, middle and downstream
districts are shown as follows: i) the average
concentrations of COD in the upstream, midstream
and downstream are 12.36 mg·L
-1
, 12.92 mg·L
-1
and
13.31 mg·L
-1
, respectively; ii) the average
concentrations of NH
3
-N in the upstream, midstream
and downstream are 0.80 mg·L
-1
, 0.48 mg·L
-1
and
0.46 mg·L
-1
, respectively; iii) the average
concentrations of TP in the upstream, midstream and
downstream respectively are 0.15 mg·L
-1
, 0.23 mg·L
-
1
and 0.24 mg·L
-1
. Moreover, the sewage treatment
plants along the way has a dilution effect on the water
body (indictor values of COD, NH
3
-N and TP) within
a certain range.
ACKNOWLEDGMENTS
This work is funded by National Natural Science
Foundation of China (41890822), Water Resource
Science and Technology Innovation Program of
Guangdong Province (2017-03).
REFERENCES
Chen, C. S., Liu, H., & Beardsley, R. C. (2003). An
unstructured, finite-volume, three-dimensional,
primitive equation ocean model: application to coastal
ocean and estuaries. Journal of Atmospheric and
Oceanic Technology, 20, 159-186.
Cui, Z. J., Feng, M. J., Hu, Q., Fu, H., Kong, X. H., & Zhang,
M. (2021). Spatial and temporal variation in water
quality and eutrophication status: A case study in
Shenzhen river and Xinzhou river basin. Journal of
Green Science and Technology, 23, 1-6.
Ge, Y., Lou, Y. H., Xu, M. M., Wu, C., Meng, J., Shi, L.,
Xia, F., & Xu, Y. (2020). Spatial distribution and
influencing factors on the variation of bacterial
communities in an urban river sediment. Environmental
Pollution, 272, 115984.
Huang, Y. K., Li, Y. P., Qiu, L., Xue, S. Q., & Zhang, S. S.
(2015). Risk prediction on wharf oil spill in the lower
reaches of Yangtze River based on EFDC. Water
Resources Protection, 31, 91-98.
Niu, L. H., Li, Y. Y., Li, Y., Hu, Q., Wang, C., Hu, J. X.,
Zhang, W. L., Wang, L. F., Zhang, C., & Zhang, H. J.
(2021). New insights into the vertical distribution and
microbial degradation of microplastics in urban river
sediments. Water Research, 188, 116449.
Pinos, J., & Timbe, L. (2019). Performance assessment of
two-dimensional hydraulic models for generation of
flood inundation maps in mountain river basins. Water
Science and Engineering, 12, 11-18.
Shchepetkin, A. F., & Mcwilliams, J. C. (2005). The
regional oceanic modeling system (ROMS): a split-
explicit, free-surface, topography-following-coordinate
oceanic model. Ocean Modelling, 9, 347-404.
Sun, L. L., Wang, S. Q., Shi, B. H., & Li, S. (2017).
Simulation study of hydrodynamic model in
Huangbizhuang reservoir based on MIKE21FM. Pearl
River, 38, 64-68.
Wang, S., Wang, T. T., Lin, H. J., Stewart, S. D., Cheng, G.,
Li, W., Yang, F. J., Huang, W. D., Chen, Z. B., & Xie,
S. G. (2021). Impacts of environmental factors on the
food web structure, energy flows, and system attributes
along a subtropical urban river in southern China.
Science of The Total Environment, 794, 148673.
Yuan, X. Y., & Xu, D. L. (2006). The application of
Denmark MIKE21 model in the calculation of
backwater of bridge crossing. Yangtze River, 37, 31-33.
Zhang, L., Li, X. C., Fang, W. K., Cheng, Y., Cai, H., &
Zhang, S. Q. (2021). Impact of different types of
anthropogenic pollution on bacterial community and
metabolic genes in urban river sediments. Science of
The Total Environment, 793(2), 148475.
Zhang, W. L., Cai, W., Li, Y., Wang, P. F., Wang, C., &
Niu, L. H. (2017). Effect of the pollution level on the
functional bacterial groups aiming at degrading
bisphenol A and nonylphenol in natural biofilms of an
urban river. Environmental Science and Pollution
Research, 23, 15727-15738.
Zhang, Y., Meng, D. J., Yu, Z. C., Zhao, J. Y., Peng, W. Q.,
Han, H. L., & Zhang, J. (2020). Analysis of urban river
water quality improvement and compliance based on
MIKE21. Water Resources and Power, 38, 48-52.
Zuo, Q. T., & Li, D. F. (2013). Research on regulation for
pollution-control of dams on heavily polluted river base
on the model of simulation and optimization. Journal of
Hydraulic Engineering, 44, 979-986.
Two-dimensional Hydrodynamics and Water Environment Simulation: A Case Study in the Guanlan River Basin in China
283
