
Monitoring of Land Subsidence using PSInSAR: A Case Study in
Nanjing Urban Area
Miao Hou
1a
, Yongping Xu
2b
, Huaiqian Xiao
2
, Houjun Yan
2
, Xing Yang
1c
*
and Songgan Weng
1 d
1
Jiangsu Hydraulic Research Institute, 97 Nanhu Road, Nanjing 210017, China
2
Jiangsu Administration of Huaihe, Shuhe and Xinhe Rivers, 8 Shenzhen Road, Huaian 223005, China
Keywords:
Land subsidence, Nanjing, PSInSAR, Sentinel-1, Urban area
Abstract:
Urban land subsidence is mainly induced by human activities, such as ground-water overdraft, mining of
mineral resources and load of constructions. The geodetic-based monitoring systems utilizing leveling have
been used to study land subsidence in many urban subsidence regions for a long time. But many
benchmarks established for leveling have been destroyed or are unstable due to human activities or land
subsidence. In addition, conventional leveling in urban areas is costly and time-consuming, often taking
months or years to complete land subsidence measurement. So, it is of great significance to adopt new
measurement technology in urban land subsidence monitoring. Nanjing city with rapid urbanization, a large
city in China, has suffered subsidence problems in the past 30 years. This paper uses the Permanent
Scatterers Synthetic Aperture Radar Interferometry (PSInSAR) methodology with Synthetic Aperture Radar
(SAR) images acquired from the Sentinel-1 between 2014 and 2019 to characterize the subsidence of
Nanjing city, which provides high-resolution assessment of deformations for sluices, bridges, high-rise
buildings, historical buildings and so on. The analysis shows that PSInSAR is very efficient space-borne
technique for monitoring subsidence phenomena in urban area.
a https://orcid.org/0000-0002-0924-615X
b https://orcid.org/0000-0002-2583-8534
c https://orcid.org/0000-0002-5512-1817
d https://orcid.org/0000-0003-2122-8576
1 INTRODUCTION
As a global disastrous natural hazard, land
subsidence may occur in large urban areas over the
world and usually caused by human activities, such
as ground-water overdraft, mining of mineral
resources and load of constructions. However, the
conventional geodetic technique utilizing leveling is
costly and time-consuming in the large-scale urban
land subsidence monitoring. Interferometric
synthetic-aperture radar (InSAR) is a modern
space-borne technology for monitoring earth surface
deformation. InSAR techniques (e.g. DInSAR,
PSInSAR, SqueeSAR) can provide centimeter- to
millimeter-level accuracy in large-scale land
subsidence monitoring without much time and high
cost. Also, InSAR techniques have the advantages of
all-weather adaptability (Yu et al., 2021; Yang et al.,
2020; Alani et al., 2020). InSAR techniques have
been successfully applied in different deformation
research work, such as glacier drift (Yan et al., 2016),
surface subsidence (zhou et al., 2020; Smith &
Knight, 2019), landslide (Guo et al., 2021; Fobert et
al., 2021), volcanic eruption (Liang et al., 2021;
Hooper, 2008), etc.
Wright et al. (2004) used InSAR to measure
surface displacement across the western Tibetan
plateau. Pritchard & Simons (2013) used InSAR to
analyze the deformations of 900 remote volcanos in
the central Andes to determine which one might have
magma moving at depth. Baer et al. (2002) used 16
SAR images obtained by the European Remote
Sensing ERS-1 and ERS-2 satellites from 1992 to
1999 to research land subsidence along the Dead Sea
shores. Rivera et al. (2017) used COSMO-SkyMed
InSAR to obtain time-dependent ground deformation
268
Hou, M., Xu, Y., Xiao, H., Yan, H., Yang, X. and Weng, S.
Monitoring of Land Subsidence using PSInSAR: A Case Study in Nanjing Urban Area.
In Proceedings of the 7th International Conference on Water Resource and Environment (WRE 2021), pages 268-274
ISBN: 978-989-758-560-9; ISSN: 1755-1315
Copyright
c
2022 by SCITEPRESS – Science and Technology Publications, Lda. All rights reserved
data over Cotopaxi volcano. Koning et al. (2020)
carried out the land subsidence monitoring using
InSAR in a dike strengthening project and obtained
the land subsidence rate. Xu et al. (2018) reviewed
the applications of remote sensing technology, such
as InSAR, in urban flood simulation.
Nanjing city with rapid urbanization, a large city
in China, had suffered serious subsidence problems
in the past 30 years. Geological hazards caused by
land subsidence, such as the building tilt, ground
collapse and embankment deformations, have long
been a problem affecting the development of
Nanjing and resulted in increased flood risk in some
urban subsidence regions, especially in Hexi area of
Nanjing city, where the soft soil layer is widely
distributed. Therefore, urban land subsidence
monitoring in Nanjing is of great significance. This
paper takes Nanjing as an example, and four types of
buildings (i.e. sluice, bridge, historic building and
high-rise building) are selected as research cases to
carry out the application research of InSAR
technology in urban land subsidence monitoring.
This paper is structured as follows: At first, the
research background is presented in Section 1. Then,
the study area and InSAR data is introduced in
Section 2. Section 3 presents the InSAR method.
And, the results are summarized in Section 4. Finally,
main conclusions are presented in Sections 5.
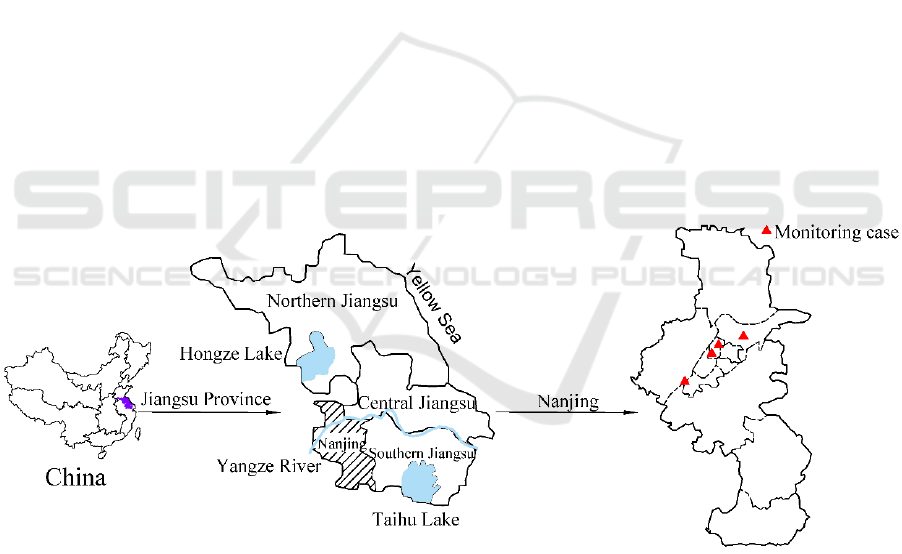
2 STUDY AREA AND DATA
Nanjing city, the capital of Jiangsu Province, is
located in the lower reaches of the Yangtze River and
in the southwest of Jiangsu Province (Figure 1). The
city covers an area of 6 587.02 km
2
, with 11
municipalities under its jurisdiction and a permanent
population of 9.31 million. Nanjing has a subtropical
monsoon climate with an average annual rainfall of 1
106 mm. Nanjing has four distinctive seasons (i.e.
spring, summer, autumn and winter), with the
temperature above 30 ℃ in summer and 2 - 10 ℃ in
winter. Nanjing had grown rapidly during the past 30
years. Land subsidence occurred in different regions
of Nanjing. In this paper, InSAR methodology with
SAR images acquired from the Sentinel-1 between
2014 and 2019 has been used to characterize
subsidence in Nanjing. Four types of buildings,
including sluice (i.e. Qinhuai new river sluice),
bridge (i.e. Shuiximen bridge), historic building (i.e.
Sun Yat-sen's Mausoleum) and high-rise building
(i.e. Greenland Square Zifeng Tower), are selected
as monitoring cases and their locations are shown in
Figure 1.
Figure 1: Location of Nanjing.
The European Space Agency (ESA) Sentinel-1 is
a day-and-night, all-weather, polar-orbiting radar
imaging mission for global monitoring of
environment and security services at C-band. The
Sentinel-1A and B are the two satellites that
composes the Sentinel-1 radar mission, and were
launched in April 2014 and April 2016, respectively.
The Sentinel-1 SAR instrument can acquire data in
four exclusive modes, namely Strip map (SM),
Interferometric Wide swath (IW), Extra Wide swath
(EW) and Wave (WV) modes. Table 1 shows the
selected 72 C-band VV-polarizatio ascending SAR
images acquired by sentinel-1 in this study, covering
the period October 8, 2014 to September 25, 2019.
Monitoring of Land Subsidence using PSInSAR: A Case Study in Nanjing Urban Area
269

Table 1: SAR data in monitoring area.
Parameter Number
Satellite type; Date band; Spatial resolution Sentinel-1; C-bond (5.6 cm); 20 m
Up/down mode; Polarization mode; Side view Ascending; VV; 39.92°
Acquisition time; Number of image
Date level
20141008-20190925; 72
SLC data (single view and multiple view)
Date of image
20141008, 20141102, 20141118, 20141220, 20150117 20150222,
20150306, 20150310, 20150322, 20150411 20150513, 20150614,
20150712, 20150716, 20150817 20150902, 20150918, 20151004,
20151016, 20151105 20151117, 20151207, 20151219, 20160108,
20160120 20160312, 20160328, 20160413, 20160429, 20160515
20160531, 20160616, 20160702, 20160714, 20160730 20160904,
20161002, 20161107, 20161209, 20170207 20170227, 20170416,
20170518, 20170603, 20170721 20170822, 20170919, 20171005,
20171110, 20171212 20180113, 20180214, 20180314, 20180403,
20180419 20180517, 20180622, 20180708, 20180805, 20180910
20181012, 20181113, 20181211, 20190112, 20190213 20190305,
20190418, 20190520, 20190621, 20190723 20190823, 20190925
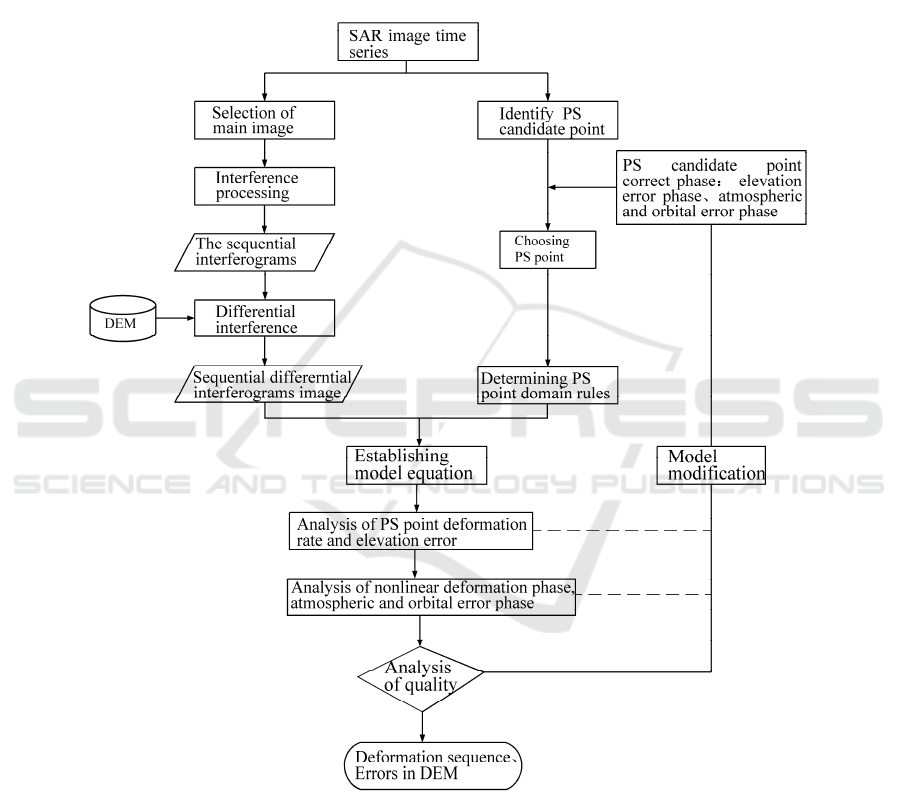
3 RESEARCH METHOD
The Permanent Scatterers Synthetic Aperture Radar
Interferometry (PSInSAR) is a InSAR technique.
Compared with Differential Interferometric
Synthetic Aperture Radar (DInSAR), it can
overcome the influence of spatio-temporal coherence
and atmospheric delay on SAR radar accuracy, and
aims at ground deformation mapping with
millimetric precision. Therefore, this paper adopts
PSInSAR technology. The basic flow of PSInSAR
data processing is shown in Figure 2.
PSInSAR identifies coherent radar targets (PS
points) to monitor ground deformation. Hooper et al.
(2004) proposed the identification algorithm of PS
based on phase characteristics, which includes
registration, radiometric calibration, PS detection
and interference processing for single-view complex
SAR images. After that, the differential interference
phase set of each PS point in each differential
interferogram can be obtained.
The phase residual of the PS point x in the scene i
interferogram is shown as follows:
𝜑
,
𝜑
,,
𝜑
,,
𝜑
,,
𝜑
,,
𝑛
,
(1)
where 𝜑
,
is the phase value of the pixel x of the
scene i interferogram, 𝜑
,,
is the deformation
phase in radar line of sight direction, 𝜑
,,
is the
delay phase difference of satellite transit atmosphere
at different times, 𝜑
,,
is the phase due to error
in the DEM, 𝜑
,,
is the DEM error phase, 𝑛
,
is
the phase of noise.
If 𝜑
,𝜑
and 𝜑
are spatially correlated over
distances of a specified length scale L, and that 𝜑
and 𝑛 are uncorrelated over the same distance, with
the mean of Zero. Then, the mean value of each
phase in the circular region with pixel x as the center
of the circle and pixel L as the radius can be
expressed as:
𝜑
,
𝜑
,,
𝜑
,,
𝜑
,,
(2)
Subtracting formula (2) from formula (1) leads to:
𝜑
,
𝜑
,
𝜑
,,
𝑛
,
𝑛′
,
(3)
where 𝑛′
𝜑
𝜑
𝜑
𝜑
𝜑
𝜑
.
The DEM error phase 𝜑
,,
and the vertical
WRE 2021 - The International Conference on Water Resource and Environment
270
baseline 𝐵
,,
are proportional to each other, the
formula (3) also can be represented as follows:
𝜑
,
𝜑
,
𝐵
,,
𝐾
,
𝑛
,
𝑛′
,
(4)
where 𝐾
,
is a proportionality constant.
Then, in all available interferogram, the smallest
square method is used to estimate 𝐾
,
:
𝛾
1/𝑁|
∑
𝑒𝑥𝑝𝑗𝜑
,
𝜑
,
𝜑
,,
| (5)
where, 𝛾
is a measure of the temporal coherence
based on pixel x, 𝑁 is the number of available
interference patterns and 𝜑
,,
is our estimate of
𝜑
,,
.
Figure 2: The basic flow chart of PSInSAR data processing.
4 RESULTS
In this paper, 72 radar interference images in
Nanjing city from October 8, 2014 to September 25,
2019 had been obtained to analyze the deformations
of the selected sluice, bridge, historical building and
high-rise building. Figure 3 shows the uplift or
settlement deformations of PS points in study area.
The results indicate that the annual average ground
motion velocity (mm/yr) was mainly in the range of
-18 mm/yr to 18 mm/yr.
Monitoring of Land Subsidence using PSInSAR: A Case Study in Nanjing Urban Area
271

Figure 3: Map of ground deformation in study area.
Figure 4 and Table 2 shows four deformation
record examples (i.e. Qinhuai new river sluice,
Shuiximen bridge, Sun Yat-sen's Mausoleum and
Greenland Square Zifeng Tower). The negative
value in the picture represents settlement and
positive value represents uplift. It can be seen from
the picture that in the past 5 years, (i) The annual
average motion velocity of the sluice, bridge,
historic building and high-rise building range from
-3.3 mm/yr to -0.5 mm/yr, -0.1 mm/yr to 1.3 mm/yr,
-0.6 mm/yr to 1.0 mm/yr and -0.2 mm/yr to 1.0
mm/yr, respectively, (ii) The most of the cases were
relatively stable within a limited deformation range,
and their cumulative deformation is -4.4 mm, -8.3
mm, -3.7 mm and 2.6 mm respectively, (iii) Their
average deformation is -2.4 mm, -4.6 mm, 1.1 mm
and 1.3 mm respectively, so the two buildings are in
the more stable state than the rests.
Figure 4: Four deformation record examples: (a) Qinhuai new river sluice, (b) Shuiximen bridge, (c) Sun Yat-sen's
Mausoleum, (d) Greenland Square Zifeng Tower.
Table 2: The deformation data of four cases.
Cases
The annual avera
g
e motion velocit
y
(mm/
y
r)
The cumulative
deformation(mm)
The average
deformation(mm)
min max
Case 1 -3.3 -0.5 -4.4 -2.4
Case 2 -0.1 1.3 -8.3 -4.6
Case 3 -0.6 1.0 -3.7 1.1
Case 4 -0.2 1.0 2.6 1.3
WRE 2021 - The International Conference on Water Resource and Environment
272

5 CONCLUSIONS
In this paper, the Qinhuai new river sluice,
Shuiximen bridge, Sun Yat-sen's Mausoleum, and
Greenland Square Zifeng Tower in Nanjing are
selected as study cases. SAR images acquired by
sentinel-1 and PSInSAR technology have been used
to characterize subsidence in Nanjing. The main
conclusions are as follows:
1) In the past 5 years, most of the study area was
relatively stable within a limited deformation range.
In all cases, the maximum annual average settlement
velocity and uplift velocity were 3.3 mm/yr and 1.3
mm/yr respectively, the maximum cumulative
settlement and uplift were only 8.3 mm and 2.6 mm
respectively, and the maximum average settlement
and uplift were only 4.6 mm and 1.3 mm
respectively. Qinhuai new river sluice and
Shuiximen bridge existed a slight settlement trend,
while Sun Yat-sen's Mausoleum and Greenland
Square Zifeng Tower tended to be a stable state with
small scale fluctuation.
2) Due to the lack of leveling results from the
above four cases, the PSInSAR technology proposed
by Hooper et al. (2004) has not been verified in this
study. The distribution of PS points is related to the
objects (e.g. roofs, road surfaces, rocks, etc) and
landforms of the research area, and the position of
PS point is random. Therefore, the manually
arranged leveling point and the PS point identified
by PSInSAR technology are unlikely to be in the
same position. How to compare the displacement
results of PS points and leveling points to verify the
reliability of PSInSAR in this study is worthy of
further research.
3) Some factors such as soft soil layer with high
compressibility and low bearing capacity, falling
groundwater levels, and surcharge loads (e.g.
high-rise buildings, subways) can result in urban
land subsidence in Nanjing city. The results showed
there was no obvious uplift trend and settlement
trend for most of the study area. The reasons for the
land uplift in some areas may be related to stress
release of foundation soil, the rise of groundwater
level and the decrease of load. But the real reason
needs to be further studied.
4) PSInSAR technique can provide
millimeter-level accuracy in urban land subsidence
monitoring without much time and high cost, and it
is worthy of further discussion in other deformation
research work based on PSInSAR technology.
ACKNOWLEDGMENTS
This work was supported by the Water Resources
Science and Technology Project of Jiangsu Province
(Grant No. 2019022), and the Science and
Technology Project of Jiangsu Province (Grant No.
BM2018028).
REFERENCES
Alani, A. M., Tosti, F., & Ciampoli, L. B. (2020). An
integrated investigative approach in health monitoring
of masonry arch bridges using GPR and InSAR
technologies. NDT and E International, 115, 102-288.
Baer, G., Schattner, U., & Wachs, D. (2002). The lowest
place on Earth is subsiding-An InSAR (interferometric
synthetic aperture radar) perspective. Geological
Society of America Bulletin, 114, 12-23
Fobert, M. A., Singhroy, V., & Spray, J. G. (2021). InSAR
Monitoring of Landslide Activity in Dominica. Remote
Sens, 13, 8-15.
Guo, R., Li, S., & Chen, Y. (2021). Identification and
monitoring landslides in Longitudinal Range-Gorge
Region with InSAR fusion integrated visibility
analysis. Landslides, 18, 551-568.
Hooper, A., Zebker, H., & Segall, P. (2004). A new method
for measuring deformation on volcanoes and other
natural terrains using InSAR persistent scatterers.
Geophysical Research Letters, 31, 1-5.
Hooper, A. (2008). A multi-temporal InSAR method
incorporating both persistent scatterer and small
baseline approaches. Geophysical Research Letters. 35,
96-106.
Koning, M. D., Haasnoot, J. K., & Buuren, R. V. (2020).
Determination of amount of land subsidence based on
INSAR and LiDAR monitoring for a dike
strengthening project. Plahs, 382, 57-62.
Liang, H., Li, X., & Chen, R. (2021). Mapping Surface
Deformation Over Tatun Volcano Group, Northern
Taiwan Using Multitemporal InSAR. IEEE Journal of
Selected Topics in Applied Earth Observations and
Remote Sensing, 14, 2087-2095.
Pritchard, M. E. & Simons, M. (2013). An InSAR-based
survey of volcanic deformation in the central Andes.
Geochemistry Geophysics Geosystems, 05, 1-42.
Rivera, A. M. & Amelung, F. & Mothes, P. (2017). Ground
deformation before the 2015 eruptions of cotopaxi
volcano detected by insar. Geophysical Research
Letters, 44, 6607-6615.
Smith, R., & Knight, R. (2019). Modeling Land
Subsidence Using InSAR and Airborne
Electromagnetic Data. Water Resources Research, 13,
2801-2819.
Wright, T. J., Parsons, B., & England, P. C. (2004). InSAR
Observations of Low Slip Rates on the Major Faults of
Western Tibet. Science, 305, 236-239.
Monitoring of Land Subsidence using PSInSAR: A Case Study in Nanjing Urban Area
273

Xu, Z., Cheng, T., & Hong, S. (2018). Review on
applications of remote sensing in urban flood
modeling. Kexue Tongbao, Chinese Science Bulletin,
63, 2156-2166.
Yan, S., Ruan, Z., & Liu, G. (2016). Deriving Ice Motion
Patterns in Mountainous Regions by Integrating the
Intensity-Based Pixel-Tracking and Phase-Based
D-InSAR and MAI Approaches: A Case Study of the
Chongce Glacier. Remote Sensing, 8, 6-11.
Yang, Z. F., Li, Z. W., & Zhu, J. J. (2020). Use of
SAR/InSAR in Mining Deformation Monitoring,
Parameter Inversion, and Forward Predictions: A
Review. IEEE Geoscience and Remote Sensing
Magazine, 8, 71-90.
Yu, H. W., Xing, M. D., & Yuan, Z. H. (2021). Baseline
Design for Multibaseline InSAR System: A Review.
Miniaturization for Air and Space Systems, 02, 17-24.
Zhou, D., Simic-Milas, A., & Yu, J. (2020). Integrating
RELAX with PS-InSAR Technique to Improve
Identification of Persistent Scatterers for Land
Subsidence Monitoring. Remote Sensing, 12, 27-30.
WRE 2021 - The International Conference on Water Resource and Environment
274
