
Assessment Method on Groundwater Recharge Effect
Zhe Wang
1,*
, Bao Qian
2
, Jingsi Zhu
1
, and Yu Li
1
1
Hydrology Bureau of Haihe River Water Conservancy Commission, the Ministry of Water Resources, Tianjin 300170,
China
2
Bureau of Hydrology, Changjiang Water Resources Commission, CWRC, Wuhan 430010, China
Keywords: Groundwater, Recharge, AHP, Index system, Effect assessment
Abstract: In view of the serious problem of groundwater overdraft in North China, the experimental reaches of Hutuo
River, Fuyang River and Nan Juma River in Hebei Province were selected to evaluate the groundwater
recharge effect. The evaluation index system of groundwater recharge effect is established by selecting
indexes from the six aspects of groundwater level recovery rate, water surface area change rate, water quality
improvement degree, water ecology improvement degree and public satisfaction degree. with AHP. A simple
and practical index calculation method is selected to calculate and analyze the changes of indexes before and
after the river reach replenishment, and to assess the effect of ecological replenishment. The results show that
the groundwater recharge effect of the experimental reach can be classified into three grades by using the
established groundwater recharge effect assessment technology, namely, the assessment grade of Hutuo River
is "very good", that of South Juma River is "good", and that of Fuyang River is "general". The assessment
results of the three pilot river sections are basically consistent with the actual water replenishment effect.
1 RESEARCH BACKGROUND
Groundwater is an important source of water supply
in our country, and plays an important role in
ensuring economic and social development, national
drinking water safety, and maintaining a good
ecological environment. Since our country began to
develop and utilize groundwater resources on a large
scale in the early 1970s, the amount of groundwater
extraction has increased rapidly (Zhang & Fei, 2012).
In China, especially in North China, the long-term
large-scale exploitation of groundwater has caused
serious over-exploitation of groundwater, resulting in
a series of ecological and environmental problems
such as groundwater table decline, river and lake
surface shrinkage, land subsidence, seawater
intrusion, and groundwater pollution, caused a
serious threat to the protection of national water
security and regional sustainable development. Our
(Zhuang & Zhang, 2013) country has made it clear in
2011 that it is necessary to strengthen groundwater
protection, control groundwater over-extraction, and
achieve a balance of extraction and recharge (Cao &
Shen, 2019). Therefore, the artificial recharge of
groundwater is an important task for the development
and utilization of groundwater under the new
situation, and it has important guiding significance
for the rational development and utilization of
groundwater (Liu & Xiao, 2015).
The increase of demand for water resources due to
rapid economic development has led to a continuous
decrease of the total amount of water resources,
which has made great progress in the research on the
theory and methods of artificial groundwater
replenishment (Han & Shao, 2014). Henan, Hebei,
Shandong and other provinces (Li & Zheng, 2005;
Huang et al, 2001), as well as Beijing, Shanghai,
Tianjin, Hangzhou, Xi'an, Shenyang and other cities
and some typical areas have conducted large-scale
artificial groundwater replenishment experiments
(Yu & Li, 2000; Sun & Miao,2001) and has achieved
good theoretical and practical results. Artificial
recharge of groundwater is currently the main method
for regulating water resources in many countries in
the world (Sun & Miao, 2001; Ziegler et al., 2001;
Dillon, 2002; Sanford, 2002) and some good results
have been achieved. For artificial recharge of
groundwater, the main methods are recharge methods,
recharge water sources, and recharge technologies,
recharge water quality, recharge blockage, etc.
However, it is worth noting that although domestic
and foreign experts usually evaluate the effect of
Wang, Z., Qian, B., Zhu, J. and Li, Y.
Assessment Method on Groundwater Recharge Effect.
In Proceedings of the 7th International Conference on Water Resource and Environment (WRE 2021), pages 257-267
ISBN: 978-989-758-560-9; ISSN: 1755-1315
Copyright
c
2022 by SCITEPRESS – Science and Technology Publications, Lda. All rights reserved
257
groundwater replenishment from one or more
combinations of indicators such as replenishment rate,
infiltration replenishment range, effective water
storage rate, groundwater level, and water quality
(Lemer & Issar, 1990; Bhagyawant, 2008; Elango,
2015), so far there has not been a standard of
groundwater artificial replenishment evaluation
method and evaluation that that widely accepted
around the world. Therefore, it is necessary to explore
appropriate evaluation methods and establish a
simple and feasible evaluation index system for the
analysis and evaluation of groundwater recharge
effect. This will make the evaluation method of
ecological recharge effect more scientific. Scientific
evaluation methods can ensure the
comprehensiveness and objectivity of the evaluation
of the improvement of water resources and water
environment by ecological water supplement. All of
these will be conducive to the large-scale
development of water resources management and
evaluation, as well as the protection of groundwater
resources and ecological environment recovery.
In this paper, the analytic hierarchy process is used,
and its principle is the construction of evaluation
index system. By analyzing the changes of typical
indexes before and after water recharge, the
evaluation index system and calculation method of
water recharge effect are established, and the
comprehensive effect of ecological water recharge is
evaluated. Provide data support and scientific
reference for the evaluation of groundwater recharge
effect in the entire North China Plain over-
exploitation area in the future.
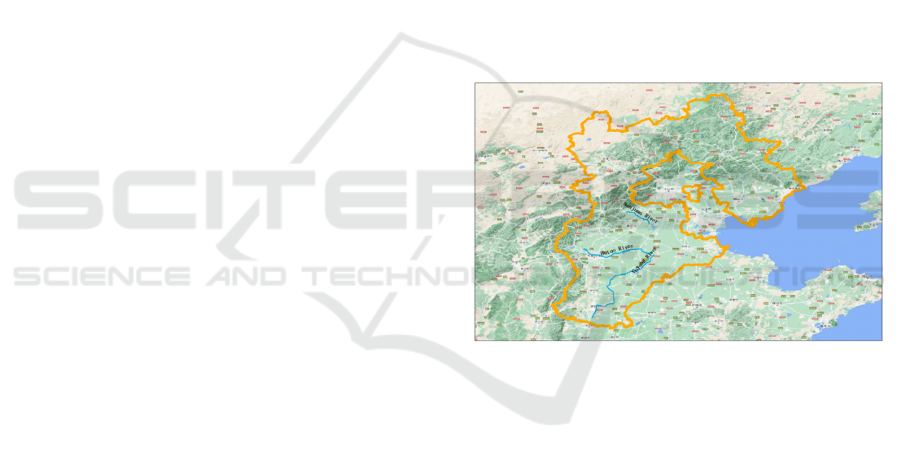
2 OVERVIEW OF THE STUDY
AREA
This paper takes the pilot section of the three recharge
channels and the surrounding area within 10km of the
Hutuo River, Fuyang River, and South Juma River in
Hebei Province as the evaluation scope (Figure 1).
The experimental rivers have been in a dry state for a
long time, and the surrounding areas have been over-
exploited and the water loss of rivers and lakes is
serious. The pilot river sections of the three water
supply channels are 477 km long, involving 26
counties (cities, districts) in 6 cities, including
Shijiazhuang, Hengshui, Cangzhou, Handan, Xingtai,
and Baoding. It passes through many major shallow
groundwater funnel areas such as Ningbolong,
Gaoliqing, and Yimu Spring.The experimental rivers
have been in a dry state for a long time, and the
surrounding areas have been over-exploited and the
water loss of rivers and lakes is serious. Water
recharge started on September 13, 2018, and as of
August 31, 2019, the total water recharge volume was
1.35 billion m
3
. According to the statistics of water
supply sources, the middle route of the South-to-
North Water Diversion Project provides water supply
of 8.9 million m
3
,370 million m
3
of local reservoirs
and 80 million m
3
of reclaimed water. According to
the statistics of the pilot river section, the Hutuo River
provides 830 million m
3
of water, the Fuyang River
provides 350 million m
3
, and the South Juma River
provides 160 million m
3
,Comprehensively
considering the regional impact of hydrological
factors such as water recharge, precipitation,
evaporation, and channel storage in the evaluation
area, and the impact of water withdrawal around the
river channel, In the end, the three pilot river sections
infiltrated and recharged about 930 million m
3
of
groundwater.
Figure 1: The location of study area.
There are 30 monitoring sections of surface water
in the replenishing river section, including 10 Hutuo
River, 11 Fuyang River and 9 Nan Juma River; 111
groundwater level monitoring wells (Figures 2-4),
among them, 70 eyes at the groundwater level
monitoring station of Hutuo River, 27 eyes at Fuyang
River, and 14 eyes at Nanjuma River, all of which are
automatically monitored. There are 11 water quality
monitoring cross-sections (Figures 2-4), including 4
Hutuo River, 4 Fuyang River, and 3 Nanjuma River;
A total of 12 survey sections were set up for the
aquatic ecology field survey, including 4 Hutuo River,
4 Fuyang River, and 4 Nanjuma River; and in the later
stage of water recharge, we went to three pilot river
sections to conduct social impact surveys.
WRE 2021 - The International Conference on Water Resource and Environment
258
Figure 2: Layout of monitoring stations in Hutuo river.
3 EVALUATION METHOD
AHP is a multi-objective decision analysis method
that based on expert experience and combines
qualitative and quantitative analysis to quantify,
compare and hierarchical analysis the inherent
characteristics of the evaluation object. This method
can not only describe the hierarchical attributes of the
evaluation object, but also consider the relative
importance and interrelationship of various
influencing factors (Elango, 2015). Evaluation of
groundwater recharge effect has comprehensive and
systematic characteristics. The effect of groundwater
recharge involves many aspects such as changes in
the amount of groundwater recharge, changes in
water quality, improvement of water ecology, and
social impact. A comprehensive evaluation of the
effect of groundwater recharge can be achieved by
establishing an analytic hierarchy model. At the same
time, the evaluation index system should follow the
principles of scientific comprehensiveness, simplicity
and practicality, and wide application in order to
achieve an efficient scientific evaluation of the effect
of groundwater recharge.
Figure 1: Layout of monitoring stations in Fuyang River.
Assessment Method on Groundwater Recharge Effect
259
Figure 2: Layout of monitoring stations in Nan Juma River
3.1 Construction of Indicator System
According to the experiment experience of
groundwater recharge in rivers and lakes, ecological
recharge has an impact on many aspects, such as,
river and lake water volume, river and lake water
surface restoration, groundwater level, river and lake
and groundwater quality, river and lake and
surrounding water ecological environment. At the
same time, in order to understand the attitudes and
opinions of residents along the water recharge river
and the public on the work of replenishing
groundwater in rivers and lakes, it is necessary to
investigate the public's satisfaction with ecological
water recharge. Therefore, based on the principles of
constructing the evaluation index system, six
representative and easy to quantify evaluation
indexes were selected as the evaluation indexes of the
groundwater recharge effect: 1) Infiltration recharge
rate: reflects the effective degree of infiltration and
recharge of groundwater in rivers and lakes;
2)Groundwater level recovery rate: reflecting the
recovery of aquifer water level after water
supplement: 3)Water quality improvement degree:
reflects the comprehensive improvement effect of
groundwater recharge on surface water and
groundwater quality, and can characterize the
improvement of the water environment in the
receiving area; 4) Water surface area change rate:
reflects the quality of water supplement effect; 5)
Water ecology improvement degree: reflects the
structure of biological community and species
diversity; 6) Public Satisfaction: Reflects the public's
awareness, attitudes and suggestions on the work of
replenishing groundwater in rivers and lakes around
the water supply channel. According to the evaluation
structure of groundwater recharge effect, the
evaluation model is divided into two layers. From top
to bottom, the first layer is the target layer, and the
second layer is the index factor layer. Based on this,
a hierarchical model of groundwater recharge effect
evaluation is established as shown in Figure 5.
Figure 5: The evaluation model of groundwater recharge.
3.2 Index Calculation Method
The evaluation of the effect of groundwater recharge
is by analyzing the changes of evaluation indicators
before and after replenishing water. Evaluate the
effect of ecological water recharge on improving river
and lake water volume, groundwater level, water
quality, and ecological environment. The data
WRE 2021 - The International Conference on Water Resource and Environment
260

acquisition method and calculation method of the
evaluation index are shown in Table 1. Because the
amount of precipitation has a greater impact on
groundwater infiltration recharge and groundwater
level changes, so it is necessary to deduct the
influence of precipitation factors for special
precipitation years (such as abundant or partial
abundance, dry or partial dry), and revise the
assessment results. The correction mainly considers
two indicators: infiltration recharge rate and
groundwater level recovery rate. Refer to Table 2 for
the corresponding relationship between the correction
coefficient and the precipitation frequency.
Table 1: The evaluation index calculation of groundwater recharge effect.
Evaluation
index
Data acquisition
method
Calculation method Method description
Infiltration
recharge rate
Dynamic
monitoring, data
investigation
Water balance method
The calculation principle is scientific, the method is
simple, and the water quantity relationship is clear.
This article mainly uses this metho
d
Model simulation
A large amount of topographic and geological data and
monitoring data are required, and the model
construction and parameter adjustment are
complicated, which is not suitable for short-term
rolling effect evaluation
Groundwater
level recovery
rate
Dynamic
Monitoring
Isosurface method
Analyze the area of the region where the groundwater
level rises, stabilizes, and falls, and its proportion to
the area of the evaluation area, through the contour
(surface) map of the change of groundwater depth in
the evaluation area before and after water
replenishmen
Monitoring well
statistics method
When the groundwater flow field is difficult to draw,
the monitoring well statistics method can be used to
calculate the ratio of rising, stabilizing, and falling
water level of the
g
roundwater monitorin
g
well.
Water surface
area change
rate
Remote sensing
image
interpretation, drone
aerial survey, site
survey and
measurement
review
Direct calculation
Calculate the change of water surface area before and
after water replenishment, the higher the increase rate,
the better the water replenishment effect
Water quality
improvement
Dynamic
Monitoring
The method of River
section length
Surface water quality improvement degree calculation
method
The method of
Monitoring section
statistics
Surface water quality monitoring stations can be used
to calculate the improvement degree of surface water
q
ualit
y
when there are few
Direct calculation
The percentage of groundwater monitoring wells
whose water quality has improved to the total number
of monitoring wells in the area represents the degree of
groundwater quality improvement
The weighted sum of the improvement of surface
water and groundwater quality indicates the
com
p
rehensive im
p
rovement of water
q
ualit
y
Water ecology
improvement
Site sampling
survey
Direct calculation
Comparing changes in the types of aquatic organisms
and shore cover plants before and after water
replenishment to reflect the degree of improvement of
water ecology.
Public
satisfaction
Visit survey, issue
questionnaire
Score calculation
The questionnaire adopts a hundred-point system.
According to the importance of questions, assign a
value to each
q
uestion, and finall
y
calculate the sum
Assessment Method on Groundwater Recharge Effect
261

Table 2: The correction coefficient and precipitation Frequency.
Table 3: The evaluation index judgment matrix of groundwater recharge effect.
Infiltration
rate
Groundwater
level recovery
rate
Water area
change rate
Water quality
improvement
Water ecology
improvement
Public
satisfaction
Infiltration rate 1 2 3 4 5 6
Groundwater
level recovery
rate
1/2 1 2 3 4 5
Water area
chan
g
e rate
1/3 1/2 1 2 3 4
Water quality
im
p
rovement
1/4 1/3 1/2 1 2 3
Water ecology
improvement
1/5 1/4 1/3 1/2 1 2
Public
satisfaction
1/6 1/5 1/4 1/3 1/2 1
3.3 Index Weight and Evaluation
Classification
3.3.1 Index Weightand Classification of
Value Division
Each index factor has a different degree of influence
on the effect of groundwater recharge, and its role in
the evaluation system is also different. This study
uses the analytic hierarchy process combined with
expert experience to construct the judgment matrix
(Table 3), Calculate the maximum eigenvalue of the
judgment matrix and the corresponding eigenvector
by the sum-product method, and the weight value of
each index factor can be obtained by normalization
processing (Table 4). From a simple and practical
point of view, the index values are divided into four
levels on average, and each level is re-assigned from
low to high. And the value of each index can refer to
Table 5.
3.3.2 Classification of Evaluation Results
According to the index weight and value standard, the
scores of each evaluation index can be calculated.
And the sum of the scores is the total evaluation score
of groundwater recharge effect. Because groundwater
recharge is positive and beneficial for controlling
groundwater overexploitation and improving the
ecological environment, so the evaluation results are
divided into four levels according to the total score:
poor, fair, good and very good (significant). See
Table 6 for the classification of rating results.
Table 4: Evaluation index weight of groundwater recharge
effect.
Infiltration rate 0.379
Groundwater level
recovery rate
0.249
Water area change rate 0.160
Water quality
im
p
rovement
0.102
Water ecology
im
p
rovement
0.065
Public satisfaction 0.043
CR=0.019<0.1 Meet the consistency test
Precipitation level high flow year
Partial high
flow yea
r
Average
flow yea
r
Low flow year
Partial low
flow yea
r
guarantee ratep / % ≤12.5
12.5<p≤37.5
37.5<
P≤62.5
62.5<P≤87.5 >87.5
Correc
tion
factor
Water
supplement
coefficient
Points×0.8 Points×0.9 Points×1.0 Points×1.1 Points×1.2
Water level
recover
y
rate
Points×0.8 Points×0.9 Points×1.0 Points×1.1 Points×1.2
WRE 2021 - The International Conference on Water Resource and Environment
262

Table 5: Grading standard of evaluation index.
Index
Index value
classification
Measure
Effect
evaluation
index
0-0.25 25
0.25-0.5 50
0.5-0.75 75
0.75-1.0 100
Table 6: Classification of evaluation results.
Evaluati
on score
≤30
30<
p≤60
60<
p≤80
80<P≤100
Replenis
hment
effect
Poor general better
Very good
(significantly)
4 EVALUATION OF
GROUNDWATER RECHARGE
EFFECT
4.1 Construction of Indicator System
4.1.1 Evaluation of Infiltration Recharge
According to the calculation, the total water supply of
the three pilot river sections is 1.35 billion m
3
, the
water inflow in the interval is about 100 million m
3
(total precipitation is 9 billion m
3
, and the total inflow
is 1.43 billion m
3
. According to the calculation of the
water balance formula, the infiltration groundwater
volume of the three pilot river sections is 950 million
m
3
(see Table 7). And finally calculate the infiltration
rate (The proportion of infiltration water in total
recharge water and inflow water) is about 66%. It is
calculated that the infiltration and recharge of
groundwater in the Hutuo River, Fuyang River, and
Nanjuma River are 656 million m
3
, 183 million m
3
,
and 110 million m3, respectively, and the infiltration
recharge rate is 80%, 44%, and 57%, respectively.
Table 7: Recharge water volume of infiltration
Unit: Ten thousand m
3
Replenishment
reach
supply
water
quantity
precipitation evaporation
channel
storage
capacity
variable
River
outflow
Water
withdrawal
along the
line
infiltration
capacity
Infiltrat
ion rate
Hutuo Rive
r
84077 563 2805 5987 7250 65598 80%
Fuyang rive
r
42345 163 937 168 3719 19070 18614 44%
nan Juma
Rive
r
18998 194 1060 188 5741 1230 10973 57%
Sum 142420 920 4802 6343 16710 20300 95185 66%
4.1.2 Evaluation of Groundwater Level Rise
According to the groundwater dynamic monitoring
data before and after water recharge, the dynamic
change process of the average groundwater level of
the pilot reach is shown in Figures 2 - 4. Based on the
data of multiple groundwater level monitoring wells
distributed in the Hutuo River, Fuyang River, and
South Juma River sections, the changes in the
groundwater level before and after water
supplementation were compared and analyzed. The
groundwater level within 10km of the three recharge
pilot rivers dropped by an average of 0.03m, and the
overall situation is stable. The groundwater level of
the Hutuo River section increased by 0.33m on
average, the groundwater level of the Fuyang River
section decreased by 0.23m, and the groundwater
level of the South Juma River section decreased by
0.29m on average. But during the same period, the
groundwater level in the area without water recharge
(the area outside the 10km range of the pilot river
section) dropped by an average of 0.96m. In a year
with similar historical precipitation (2014), the
groundwater level within the 10km range of the pilot
river in the same period dropped by an average of
4.14m, and the comparison shows that the
groundwater level has relatively increased after water
recharge, and the water recharge effect is obvious.
Through the Kriging interpolation calculation of the
groundwater monitoring well water level data in the
study area, the groundwater level recovery rates of the
Hutuo River, Fuyang River, Nanjuma River and the
surrounding 10km range are 36%, 17%, and 6%
respectively.
Assessment Method on Groundwater Recharge Effect
263

4.1.3 Evaluation of Water Surface Area
Change
Interpret the water surface area of the pilot river
sections at different stages by using remote sensing
images of each month during the entire water
supplement period before and after the water
supplement. Comparative analysis shows that,
compared with the severe dry-off situation in the pilot
river section before water supplementation, after
water supplementation, the water surface of the
supplementary river section has been fully connected
and the water surface area has been significantly
restored. The water surface area of Hutuo River,
Fuyang River, and Nanjuma River all reached the
largest increase in the two months of water recharge.
Among them, the water surface area of Hutuo River
increased significantly, with the largest new water
surface area being 21 km
2
respectively. At the end of
the water recharge, the water surface area of the three
river sections was 30km
2
, which was 8.56km
2
more
than before the water recharge, and the water surface
area change rate was 39%. Among them, the Hutuo
River increased by 8.91km
2
, and the water surface
area change rate was 78%; the Fuyang River and
Nanjuma River decreased by0.09km
2
and 0.26km
2
,
respectively, and the water surface area change rate
was -2% and -4%.
4.1.4 Evaluation of Water Quality
Improvement
Analyzing the data of 11 surface water quality
monitoring sections in three river sections (Table 8)
shows that the water quality categories of 6 sections
have improved, and the water quality categories of 3
sections are basically stable. Two deteriorating water
quality sections were mainly affected by the decrease
in water supply flow in the later period. The
monitoring section was in a cut-off state, the water
body was not flowing, and the water quality gradually
deteriorated due to the influence of temperature and
pollutants. Among them, the improvement rate of the
surface water quality of Hutuo River and Fuyang
River was 75%, and the improvement rate of surface
water quality of the South Juma River was 100%. Use
groundwater monitoring well monitoring data (Table
9) to analyze the changes in groundwater quality
before and after water supplementation. It shows that
the groundwater quality in the area where the pilot
river section is located is poor, and the groundwater
quality in the vicinity of the river has improved after
water supplementation, and the concentration of some
water quality indicators has been significantly
reduced. Among them, the groundwater quality of the
Nanjuma River has improved significantly, with an
improvement ratio of 80%; the improvement effect of
the Hutuo River and Fuyang River is not obvious,
with the improvement ratios of 26% and -8%
respectively. According to the improvement degree of
surface water and groundwater quality of the three
river sections, formula (1) is used for comprehensive
evaluation and calculation.
𝛾 = 𝛼 ∗ 0.5 + 𝛽 ∗ 0.5 (1)
In the formula, represents the improvement
degree of surface water quality, and represents the
improvement degree of groundwater quality.
It is calculated that the water quality
improvement of Hutuo River, Fuyang River, and
Nanjuma River are 51%, 34%, and 90%
respectively.
4.1.5 Evaluation of Aquatic Ecology
Improvement
A comparative analysis of the ecological environment
(Table 10) between the three recharge river sections
and the reference river section (the sections with no
flow in the pilot area) showed that: after recharge, the
aquatic species and shore vegetation of the three pilot
rivers have recovered and the biodiversity is diverse.
The performance has improved, and the water
ecological environment has improved significantly.
According to the data in Table 10, formula (2) is used
to calculate the water ecological improvement degree
of various organisms, and then the average value is
taken to obtain the comprehensive water quality
improvement degree.
10
0
μ
−
=
mm
m
(2)
In the formula, m0 represents the number of
biological species before water recharge (or reference
river section), and m1 represents the number of
biological species after water recharge
It is calculated that the water ecological
improvement degree of Hutuo River and Fuyang
River are 46% and 87%, respectively. The
biodiversity of various species in the South Juma
River is relatively high, and the water ecological
improvement degree evaluated is 94%.
WRE 2021 - The International Conference on Water Resource and Environment
264
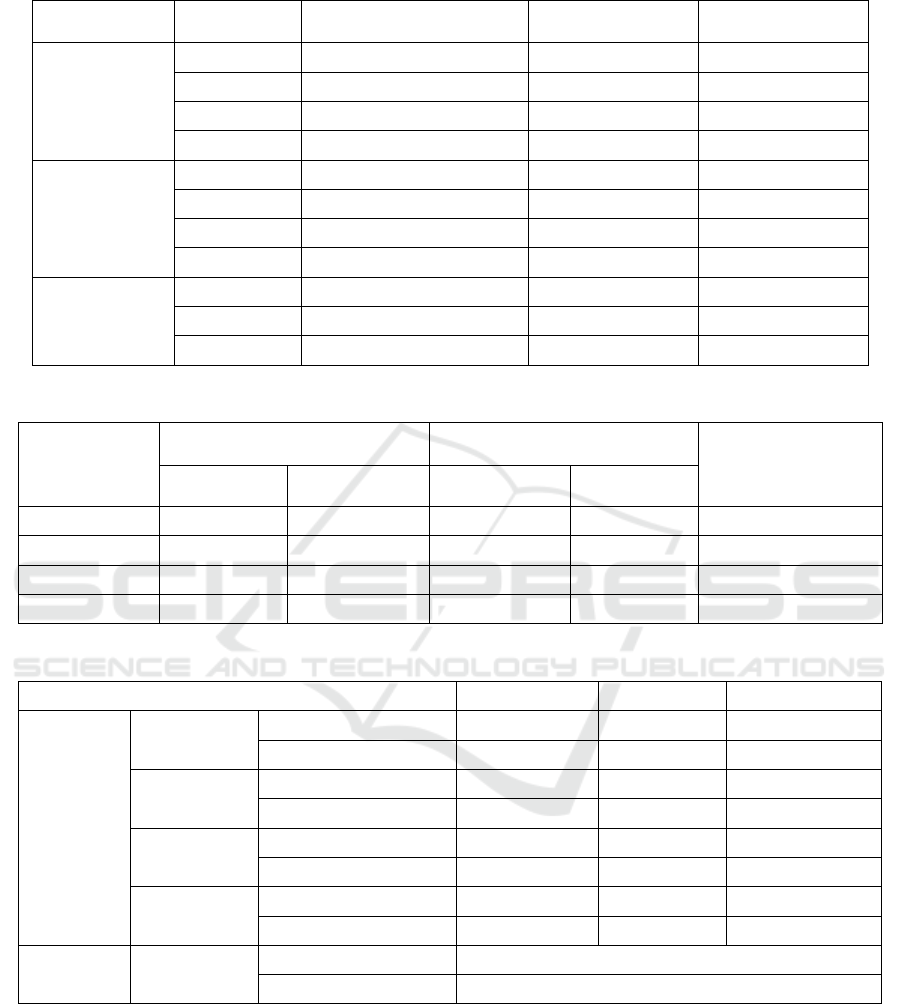
Table 8: Change of surface water quality.
Replenishment
reach
Section name
Water quality in the early
sta
g
e of re
p
lenishment
Water quality at the
end of Au
g
ust 2019
Improved or stable
water
q
ualit
y
Hutuo River
Site 1 the main water way Ⅱ √
Site2 the main water way Ⅱ √
Site3 the main water way inferiorⅤ ×
Site4 Ⅳ Ⅲ √
Fuyang river
Site5 Ⅱ Ⅱ √
Site1 inferiorⅤ Ⅴ √
Site2
the main water way/劣Ⅴ
Ⅴ √
Site3 inferiorⅤ inferiorⅤ ×
Nan Juma River
Site1 Ⅱ Ⅱ √
Site2 Ⅱ Ⅱ √
Site3 inferiorⅤ Ⅴ √
Table 9: Change of groundwater quality.
Replenishment
reach
Number of monitoring wells
b
efore water re
p
lenishment
Number of monitoring wells after
water re
p
lenishment
Number of
monitoring wells with
improved water
q
ualit
y
Ⅰ-Ⅲcategory Ⅳ-Ⅴcategory Ⅰ-Ⅲcategory Ⅳ-Ⅴcategory
Hutuo River 5 19 10 14 5
Fuyang rive 2 24 0 26 -2
Nan Juma River 6 5 10 1 4
Sum 13 48 20 41 7
Table 10: Water ecological improvement.
Replenishment reach Hutuo River Fuyang river Nan Juma River
Number of
aquatic
organisms/
species
Benthos
Replenishment reach 14 16 29
Reference reach 9 6 16
Phytoplankton
Replenishment reach 34 31 36
Reference reach 30 23 21
Zooplankton
Replenishment reach 35 34 55
Reference reach 27 20 36
Fish
Replenishment reach 5 4 6
Reference reach 3 2 2
Bank slope
vegetation
Replenishment reach 13
Reference reach 8
4.1.6 Evaluation of Public Satisfaction
Conduct surveys on water users, the public,
government workers, etc. near the banks of the river
in terms of the amount of water recharge, water level
rise, water quality improvement, and ecological
improvement. Regarding ecological water recharge,
90% of the people interviewed believed that the river
water volume had increased significantly and
expressed satisfaction with the results of ecological
water recharge. Regarding the benefits of ecological
water recharge, 83% of the interviewed people think
that the groundwater level has rebounded, 75% of the
interviewed people think that the ecological
landscape has been improved; 80% of the interviewed
people think that the water quality has improved after
Assessment Method on Groundwater Recharge Effect
265

the water supply. According to the survey and
statistical evaluation, the public satisfaction of
Hutuohe questionnaire survey is 90%, that of
Fuyanghe is 90%, and that of Nanjumahe is 80%.
4.2 Analysis of Evaluation Results
According to the index evaluation weights (Table 4)
and the measurement method (Table 5), and
considering that 2019 is a year of relatively dry
precipitation, the calculation results of the infiltration
recharge rate and groundwater level recovery rate are
revised, and the values of each indicator are re-valued
and multiplying by the weight and summing up, the
final evaluation scores of the three river sections are
obtained, as shown in Table 11.
Table 11: Index value and evaluation score of water
replenishment effect in three river sections.
Water
replenishment
section
Hutuo
River
Fuyang
rive
Nan
Juma
Rive
r
Infiltration
replenishment
rate
100 50 75
Groundwater
level recovery
rate
50 25 25
Water surface
area change rate
100 25 25
Water quality
improvement
75 50 100
Water ecology
im
p
rovement
50 100 100
Public
satisfaction
100 100 100
Score 81.5 45 65
It can be seen from Table 7 that Hutuo River’s
evaluation score is 81.5 points, and the evaluation
level is “very good”; Fuyang River’s evaluation score
is 45 points, and the evaluation level is “fair”; Nan
Juma River’s evaluation score is 65 points, and the
evaluation level is “good”. The evaluation scores of
various indicators in the three pilot river sections are
consistent with the actual water supplement effect.
The evaluation scores of groundwater level
recovery rate in the three pilot river sections are all
low, which is consistent with the actual situation of
water level monitoring. From the actual monitoring
data, the groundwater level in the Hutuo River area
increased by 0.33m on average, and the groundwater
level in the Fuyang River and Nanjuma River areas
decreased by 0.23m and 0.29m on average. The
Hutuo River's infiltration recharge rate and water
surface area change rate have the highest evaluation
scores, which are consistent with the actual water
recharge situation. Since the amount of water
recharge directly affects the amount of groundwater
infiltration recharge and the change of water surface
area, the more water recharge amount, the more
obvious the increase in water surface, and the more
groundwater infiltration recharge. Among the three
river sections, the Hutuo River has the largest water
supply, with 810 million m3, the Fuyang River has
350 million m3 of water, and the South Juma River
has 160 million m3 of water. The improvement of
water quality and water ecology is not only affected
by the amount of water recharge, but also related to
the natural background of the river, the quality of the
water recharge and the surrounding environment
along the river. On the whole, the water quality and
ecological environment assessment results of the
South Juma River are the best, consistent with the
actual situation.
According to the comprehensive evaluation
results, the Hutuo River’s evaluation grade is “very
good” because the two important indicators, the
infiltration recharge rate and the water surface area
change rate, play a decisive role. These two indicators
are mainly affected by the amount of water
supplemented by the river. The South Juma River is
rated as "good" because the two indicators of water
quality improvement and water ecology improvement
are the highest. Although the water supply is the
lowest in this section, but the water quality and
aquatic environment of the section are good; Fuyang
River The evaluation grade is "general", which is
specifically manifested in the low infiltration
recharge rate, groundwater recharge rate, water
surface area change rate, and water quality
improvement rate, mainly due to the low water
recharge in this section, and affected by factors such
as the increase of groundwater extraction for
irrigation in the later stage of water recharge, the
decrease of water recharge flow and less precipitation.
5 CONCLUSION
(1) The groundwater recharge effect in the study area
is remarkable. During the recharge period, the water
surface area was increased by 24km2 compared with
that before the recharge. The water quality of the river
was significantly improved, the ecology of the river
section was restored, the species of organisms
increased to a certain extent, and the vegetation on the
bank increased; The infiltration and recharge of
WRE 2021 - The International Conference on Water Resource and Environment
266

groundwater is about 950 million m3; under the
condition of a 40% reduction in precipitation and an
increase in groundwater extraction along the line by
15%, the groundwater level is generally stable, with
an average increase of 0.93m compared with areas not
affected by water recharge, and in some areas The
quality of groundwater has improved.
(2) Using the analytic hierarchy process, the
groundwater recharge effect evaluation index system
established by selecting indicators from the four
aspects of water quantity, water quality, water
ecology, and social impact, the index factors are
available and dynamic, the evaluation method has
operability and simplicity, and the evaluation result is
more comprehensive.
(3) The evaluation grades of the water recharge
effect of the Hutuo River, Nanjuma River and Fuyang
River are "very good", "good", and "fair" respectively,
the evaluation result is basically consistent with the
actual water supplement effect, it is proved that the
evaluation index system has certain applicability for
groundwater recharge effect evaluation, and it can
provide theoretical basis and technical support for
water resources management evaluation.
ACKNOWLEDGMENT
This work was supported by the National Key R&D
Program of China (Grant No. 2018YFE0106500).
REFERENCES
Bhagyawant, R. G. (2008). Studies on the effect of
percolation tank in augmenting the ground water
recharge. International Journal of Agricultural Science,
4(1), 359-362.
Cao, Y., & Shen, Y. F. (2019). Pore Water Vertical
Chemistry Distribution and Origin Analysisin Sino-
singapore Tianjin Eco-city. Journal of Jilin University
(Earth Science Edition), 49(4), 1109-11120.
Dillon, P. J. (2002). Management of Aquifer Recharge for
Sustainability. Netherlands: A. A. Balkema Pubishers.
Elango, L. (2015). Assessment of effect of recharge from a
check dam as a method of Managed Aquifer Recharge
by hydrogeological investigations. Environmental
Earth Sciences, 73(9), 5349-5361.
Han, Z., & Shao, J. L. (2014). Preprocessing Optimization
of Groundwater Flow Model Based on MODFLOW.
Journal of Jilin University (Earth Science Edition),
44(4), 1290-1296.
Huang, G. R., &
Hu, H. P. (2001). Research progress of
artificial recharge of groundwater. Zhwngzhou:
Yellow River Water Conservancy Press.
Lemer, D. N., &
Issar, A. S. (1990). Groundwater
Recharge. A Guide to Understanding and Estimating
Natural Recharge. International Conteibution to
Hydrogeology, Verlag Heinz Heise, 8, 345.
Li, Y. F., & Zheng, S. Y. (2005) Study on reinjection of
Yellow River. Xi’an: Shaanxi science and Technology
Press.
Liu, B., & Xiao, C. L. (2015). Application of Combining
SOM and RBF Neural Network Model for
Groundwater Levels Prediction. Journal of Jilin
University (Earth Science Edition), 45(1), 225-231.
Sanford, W. (2002). Recharge and Groundwater Models, an
Overview. Hydrogeology Journal, 10(1), 110-120.
Sun, Y., & Miao, L. W. (2001). Ying, Miao Liwen.
Investigation and Prospect Analysis of artificial deep
well reinjection in Beijing. Hydrogeology&
Engineering Geology, 1, 69-72.
Yu, J. Y., & Li, Q. F. (2000). The present situation and
preventive measures of groundwater overexploitation
in Shanghai. Groundwater, 22(4), 143-147.
Zhang, Z. Y., &Fei, Z. J. (2012). Regional Groundwater
Contamination Assessment in the North China Plain.
Journal of Jilin University (Earth Science Edition),
09(5), 1456-1461.
Zhuang, J. Q., & Zhang, J. B. (2013). Risk Assessment and
Prediction of the Shallow Landslide at Different
Precipitation in Loess Plateau. Journal of Jilin
University (Earth Science Edition), 43(3), 867-875.
Ziegler, A. C., Ross, H. C., Trombley, T. J., & Christensen,
V. G. (2001). Effects of Artificial Recharge on Water
Quality in the Equus Beds Aquifer, South-Central
Kansas, 1995-2000. U.S. Geological Survey.
Assessment Method on Groundwater Recharge Effect
267
