
Estimate the Embodied Carbon Emission and Study the Influence
Factors in the Sino-european Trade
Jing Ye
School of economics, Shanghai university, Shanghai 200444, China
Keywords Sino-European trade, Embodied carbon emission, Structural decomposition analysis
Abstract:
In this paper, the direct carbon emission calculation method is used to analyze the hidden carbon emissions
of each sector of China's trade with the EU. In this paper, the SDA analysis method is used to calculate the
proportion of four factors affecting the embodied carbon emissions. Among them, the contribution rate of the
improvement of energy use efficiency to the total embodied carbon reduction is 12.8%. Its technological
innovation was only 6.7%. It shows that China still has a lot of room for improvement in technological
innovation.
1 INTRODUCTION
As the greenhouse effect becomes more and more
significant, there are different opinions about the
causes of the greenhouse effect in the world, among
which the widely accepted theory is that the emission
of carbon dioxide causes the greenhouse effect.
Rising temperatures will cause extreme phenomena
such as heat waves, melting ice and rising sea levels,
which in turn will further cause security problems in
food, ecology, energy and water resources. As a
developing country, China has abundant human
resources and is in a period of rapid economic
development. Due to the restrictions of emission
reduction agreements, many energy-consuming
departments in developed countries have been
transferred to China, or they directly import high-
energy-consuming production and living needs from
China. This paper studies the growth factors of carbon
emissions implied by Trade between China and the
EU in 2010 and 2020, hoping to contribute to the
reduction of carbon emissions in the future.
As regards the relationship between trade and
carbon emissions, local and foreign scientists have
carried out extensive studies and analyses, in
particular the relationship between trade and carbon
emissions, the carbon emissions traded and the
factors influencing the carbon emissions traded
(Ackerman et al., 2017; Peters & Hertwich, 2020;
Weber & Matthews, 2018). Atkinson and Hamilton
(2020)
taking carbon dioxide and sulfur dioxide as
environmental pollution index, the environmental
effects of western, central and eastern regions of
China are analyzed respectively. The results show that
the environmental effects of foreign trade are closely
related to pollutant types and regional differences in
China. Chi et al. (2019) measuring the import
pollution content of sulfur dioxide, chemical oxygen,
dust and soot and the terms of trade of pollution, the
study on trade and environment issues shows that
international trade has a negative impact on the
environment of exporting countries. Yan and Yang
(2020) used the dynamic general equilibrium model
to study the relationship between pollutant emissions
and the international price of resources. The results
show that there is a positive proportional relationship
between the international price of resource products
and the emission of pollution in the stable state, and
it also indicates that under the open condition, the
emission of pollution cannot be restrained by setting
high prices of resource products.
In recent years, some scientists have begun to use
the combination (SDA) with a direct carbon intensity
measurement model to analyze the factors
influencing carbon emissions embodied in trade (Shui
& Harriss, 2016; Iftikhar et al., 2018).
Based on the existing research results at home and
abroad, this paper will use the direct carbon emission
model to calculate the carbon emissions implied by
trade between China and the EU. At the same time,
this paper also carries out structural decomposition
analysis of the four factors, and tries to reveal the
226
Ye, J.
Estimate the Embodied Carbon Emission and Study the Influence Factors in the Sino-european Trade.
In Proceedings of the 7th International Conference on Water Resource and Environment (WRE 2021), pages 226-230
ISBN: 978-989-758-560-9; ISSN: 1755-1315
Copyright
c
2022 by SCITEPRESS – Science and Technology Publications, Lda. All rights reserved

reasons that influence the growth of China's hidden
carbon emissions in trade.
2 ESTIMATE THE EMBODIED
CARBON EMISSION IN THE
SINO-EUROPEAN TRADE
2.1 Direct Carbon Intensity
Measurement
Direct carbon intensity is converted from energy
consumption in each sector to CO
2
emissions. The
specific formula is as follows:
XY E 1
X
X
⋮
X
⎣
⎢
⎢
⎢
⎡
∑
y
∑
y
⋮
∑
y
⎦
⎥
⎥
⎥
⎤
E
E
⋮
E
2
In equation (1), X is the matrix of total domestic
output, Y is the final use matrix in China, E is the exit
matrix.
In this paper, W is set as the direct carbon dioxide
emission coefficient matrix
𝒲
𝒳
3
α
k
represents the direct CO
2
emission coefficient
of various energy sources,
q
ik
/x
i
represents the energy
consumption intensity of type K in the industry sector
i.
x
i
represents the total output of product department
i.
q
ik
represents the total consumption of type K energy
in the product sector i.
Finally, the total implied carbon emission formula
of the country is obtained:
CWXWY WE 4
2.2 Data Description
The study involved energy data, economic data and
trade data. α K can be calculated according to the
guidance of IPCC. According to the energy data
published in China Statistical Yearbook, this paper
divides energy consumption into eight types by
department. They are fuel oil, crude oil, coal,
kerosene, coke, gasoline, diesel and natural gas.
The
process of calculating the carbon dioxide emission
coefficient
α
k
of these 8 major energy sources is as
follows:
𝛼
𝐶𝐸𝐹
𝐶𝑂𝐹
𝑁𝐶𝑉
44/12 5
K1,2,3,4........8
α
k
is the direct CO
2
emission coefficient of
different energy sources, the calculation results are
shown in Table 1.CEF is a carbon emission factor
provided by the IPCC. COF is a carbon and oxygen
binding factor (Carbon oxidation factor, take the
deficiency value 1). NCV stands for average low
calorific value of primary energy. Data are available
from the China Energy Statistical Yearbook. The units
of kerosene, crude oil, coal, coke, gasoline, and fuel
oil are 10Kt/ 10Kt.The natural gas unit is 10Kt/ BCM
(Billion Cubic Meters).
Table 1: Direct CO
2
emission coefficient of various energy sources (10Kt/ 10Kt, 10Kt/BCM).
Energ
y
Coal Coke Crude oil gasoline kerosene diesel Fuel oil Natural gas
α
k
2.03 2.66 3.07 3.19 3.08 3.16 3.22 218.4
Note: The data sources in the table are calculated according to Formula (5) and the data provided by China Energy Statistical Yearbook and
IPCC
The data of q
ik
and x
i
come from China Statistical
Yearbook. All data in m
i
and E come from China
Statistical Yearbook of Foreign Trade. The data of
China and EU interregional input-output tables are all
from WIOD.
2.3 Conclusions and Discussion
Based on the model, we calculate the total implied
carbon emissions of China's exports to the EU in 2010
and 2020(table 2).
Table 2: The total value of China's exports to the EU and
the total carbon emissions embodied in them
yea
r
2010 2020
Total carbon emissions
implied by exports (10Kt)
39640.27 53874.21
Total exports
(
b
illion dolla
r
s
)
2731.5 4449.7
From 2010 to 2020, the total embodied carbon
emissions from China's exports of goods to the EU
showed an upward trend. Compared with 2010, the
embodied carbon emissions caused by China's
Estimate the Embodied Carbon Emission and Study the Influence Factors in the Sino-european Trade
227
commodity exports to the EU rose from39640.27Kt
to 53874.21Kt in 2020.
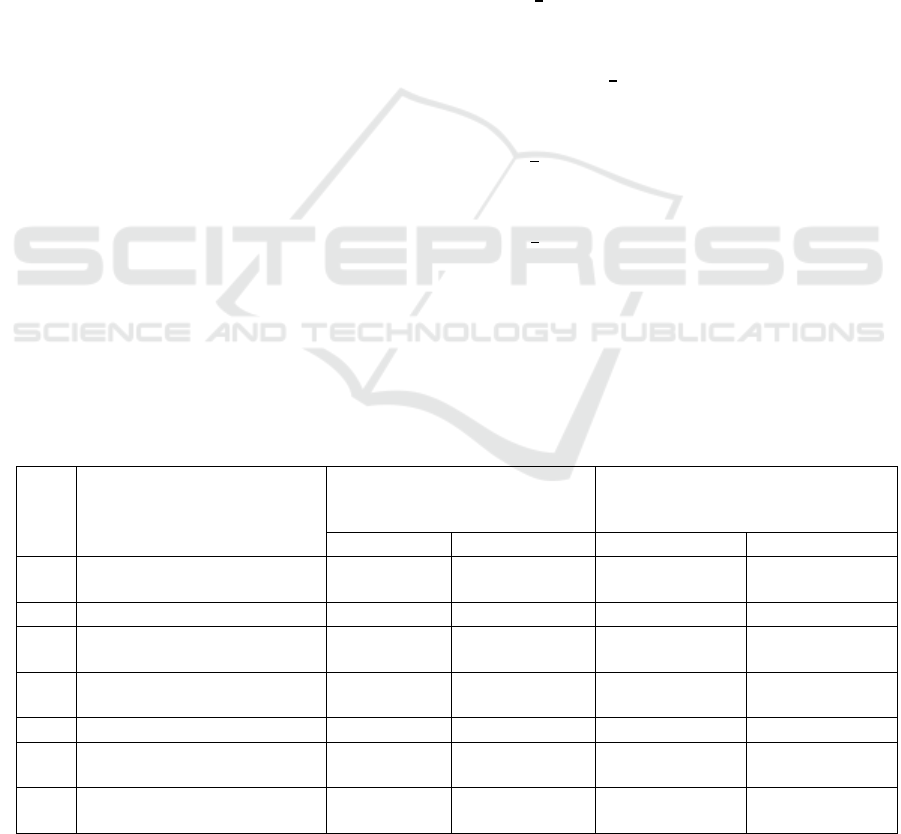
Table 3 shows the implied carbon emissions and
export amount of China's commodity sector exported
to EU.
3 STRUCTURAL DECOMPOSITI-
ON ANALYSIS OF THE
GROWTH OF IMPLIED
CARBON EMISSIONS IN
CHINA'S EXPORT TRADE TO
THE EU
3.1 Structural Decomposition Analysis
(SDA)
The SDA is to measure the influence of each variable
on the dependent variable.
This paper uses the SDA
to decompose the change of embodied carbon in
China's export trade to EU in 2010 and 2020.
CWXWI UY WE 6
C
WEWIIUA
E 7
EQK 8
C
WIIUA
QK 9
There are four main factors affecting carbon
emissions from China's export trade to the EU: energy
efficiency, production technology, export scale and
export structure. The structural decomposition of
equation (9) can be obtained by the bipolar
decomposition method (the calculation period is
marked as 1 and the base period is marked as 0):
∆C
C
C
G
∆
G
∆
G
∆
G
∆
(10)
G
∆
, G
∆
, G
∆
, G
∆
respectively
represent the contribution value of energy utilization
rate, production technology, export scale and export
structure to the change of China's embodied carbon
emissions from trade to EU in 2020 compared with
2010.
G
∆
∆W
I
IU
A
Q
K
∆WII
UA
Q
K
(11)
G
∆
∆W
∆I I UA
Q
K
W
∆I I UA
Q
K
(12)
𝐺
∆
W
I I UA
∆QK
W
I I
UA
∆QK
(13)
𝐺
∆
W
I I UA
Q
∆K W
I I
UA
Q
∆K 14
3.2 Results and Discussion
Decomposition results of implied carbon emission
growth factors of China's export trade to the EU
(Table 4).
Table 3: Implied carbon emissions from China's export goods sector to the EU.
Serial
number
Industry sectors
Implicit carbon emissions from
exports of goods to the EU by sector
(10Kt)
Proportion of embodied carbon
emissions from exports of goods to EU
b
y sector in total emissions (%)
2010 2020 2010 2020
1
Agriculture, forestry, animal
husbandry and fishery
187.56 206.77 0.46 0.38
2 Metal mining industry 466.38 98.28 1.16 0.18
3
Non-metallic mining and other
mining industries
272.13 332.16 0.68 0.61
4
Food, beverage and tobacco
p
rocessing industries
176.4 257.21 0.44 0.47
5 The textile industry 3522.45 5145.08 8.81 9.39
6
Garments, shoes, hats, leather,
eiderdown and other products
433.35 891.62 1.08 1.63
7
Wood processing and furniture
manufacturing
1060.27 2232.54 2.65 4.07
WRE 2021 - The International Conference on Water Resource and Environment
228

8
Paper printing, culture and
education, sports goods
manufacturing industry
1602.24 3130.73 4 5.71
9
Petroleum processing, coking and
nuclear fuel processing industr
y
632.44 295.11 1.58 0.54
10
Chemical industry, plastic and
rubber manufacturing
6313.39 13387.48 15.79 24.43
11
Nonmetallic mineral products
industry
2338.15 4517.46 5.85 8.24
12
Metal smelting and rolling
p
rocessing industry
9016.54 3532.01 22.56 6.44
13 Metal products industry 1077.13 1443.23 2.69 2.63
14
General, special equipment
manufacturing
8736.42 11490.01 21.85 20.97
15
Transportation equipment
manufacturing
756.21 1221.45 1.89 2.23
16
Electrical, machinery and
Equipment manufacturing
2462.13 5421.28 6.16 9.89
17
Instrument and cultural office
machinery manufacturing
industry
722.3 798.33 1.8 1.46
18 Crafts and other manufacturing 200.2 221.34 0.5 0.4
19 others 54. 61 169.98 0.13 0.31
Table 4: Decomposition results of implied carbon emission growth factors in China's export trade to EU.
Influencing factor
Contribution value (10Kt) Contribution (%)
formula results formula results
Energy efficiency
𝐺
∆
-1415.39
𝐺
∆
∆𝐶
-12.8
Production technology
G
∆
-993.96
G
∆
∆𝐶
-6.7
Exports to the EU
𝐺
∆
15458.31
𝐺
∆
∆𝐶
104.2
Export structure to EU
𝐺
∆
786.27
𝐺
∆
∆𝐶
5.3
It can be seen from table 4 that among the four
decomposition factors affecting the growth of carbon
emissions in China's export trade with the EU, the
improvement of energy efficiency and production
technology have played a certain role in reducing
carbon emissions.
4 CONCLUSION AND
COUNTERMEASURES
It is of great theoretical and practical significance to
calculate the carbon emissions of China EU trade and
decompose the factors affecting the growth of EU
export carbon emissions, so as to deeply understand
the specific law of China's carbon emissions,
advocate the formulation of fair and effective energy
conservation and emission reduction policies, and
draw the following conclusions and suggestions:
4.1 Conclusion
(1) From 2010 to 2020, the implied carbon emissions
carried by China's exports to the EU showed a
growing trend, with a cumulative increase of about
1.36 times.
(2) China is in the process of moving away from
the dominance of labor-intensive exports. In the long
run, industries with high added value and low energy
consumption will dominate exports.
(3) The improvement of China's energy efficiency
and production technology contributed to the
reduction of embodied carbon emissions from EU
exports, of which the improvement of energy
efficiency played a major role. The scale and structure
Estimate the Embodied Carbon Emission and Study the Influence Factors in the Sino-european Trade
229

of export to EU lead to the increase of carbon
emission implied by export commodities. Since
China's accession to the WTO in 2003, the foreign
trade volume has shown a trend of rapid growth. In
2020, the EU became China's largest trading partner.
The expansion of export scale makes China bear a
considerable part of the hidden carbon emissions for
the EU.
(4)
The EU's CBAM applies first to cement,
electricity, fertilizer, steel, and aluminum, and among
them, steel and aluminum are China's main export
commodities.
Chinese steelmakers will face higher
carbon tariffs than advanced foreign producers.
Aluminum exports will also be affected, with exports
falling sharply.
4.2 Policy Suggestions
(1) China should take an active part in international
carbon reduction technology cooperation projects.
The introduction of projects such as the open
utilization of green energy and the development of
environmental protection technology into China can
greatly shorten the adjustment time of China's energy
consumption structure. In addition, Chinese
enterprises can also have access to international
advanced technology, equipment and do a good job in
technological reserve for the technological update
and product transformation of Chinese enterprises.
(2) Although the Chinese government spends a lot
of money on energy conservation and emission
reduction every year, there is still a big gap in funding
for the more serious climate problem. Therefore,
climate finance is an effective way to mobilize funds
to address climate change. China should formulate
regulations on climate finance as soon as possible to
encourage international and domestic capital to invest
in energy conservation and emission reduction.
(3) In order to achieve the real reduction of
implied carbon emissions, we should not only rely on
"production responsibility system", but should adopt
"per capita consumption implied carbon emissions
responsibility system". This can effectively avoid
because of the implicit calculation error caused by the
transfer of carbon emissions, in addition, such not
only can the pressure force of greenhouse gas
emissions for each country, more able to assign the
responsibility of the climate change everyone, let
everyone feel climate change is not only the
governments, but also related to their own actions.
This study mainly measures the implied carbon
emissions of China's exports to the EU. However, due
to the difficulty of obtaining EU energy use data, the
implied carbon emissions of EU exports to China
cannot be measured. In future research, we can collect
and sort out EU energy use data to measure the carbon
emissions reflected by EU exports to China.
In this
document, the carbon change factors embodied in
export goods emissions are broken down and
analyzed from a global perspective. In future studies,
the analysis can be carried out by sector according to
SDA, so that the reasons for the growth of red carbon
emissions from each sector can be more deeply and
clearly calculated.
REFERENCES
Ackerman, F., Ishikawa, M., & Suga, M. (2017). The
carbon content of Japan-US trade. Energy Policy, 35,
4455-4462.
Atkinson, G., & Hamilton, K. (2020). Trade in 'virtual
carbon: Empirical results and implications for policy.
Global Environmental Change, 21(2), 563-574.
Chi, C., Ma, T., & Zhu, B. (2019). Towards a low-carbon
economy: Coping with technological bifurcations with
a carbon tax. Energy Economics, 34(6), 2081 -2088.
Iftikhar, Y., Wang, Z., & Zhang, B. (2018). Energy and CO
2
Emissions Efficiency of Major Economies: A Network
DEA Approach. Energy, 147(3), 197-207.
Peters, G. P., & Hertwich, E. G. (2020). CO
2
Embodied in
International Trade with Implications for Global
Climate Policy. Environmental Science and Technology,
42, 1401-1407.
Shui, B., & Harriss, R. C. (2016). The Role of CO
2
Embodiment in US-China trade. Energy Policy, 34,
4063-68.
Weber, C. L. & Matthews, H. S. (2018). Quantifying the
global and distributional aspects of American
household carbon footprint. Ecological Economics, 16,
379-391.
Yan, Y., & Yang, L. (2020). China’s foreign trade and
climate change: a case study of CO
2
emissions. Energy
Policy, 38, 350-356.
WRE 2021 - The International Conference on Water Resource and Environment
230
