
Research on the Configuration of Water Resources-social Economic
Coupling System based on SD Simulation
Yihuan He
*
and Shi An
School of Economics and Management, Harbin Institute of Technology, Harbin, China
Keywords: Water resources, social economy, coupled system, supply and demand balance, system dynamics
Abstract: With the rapid development of society and economy, water resources have become a "bottleneck" restricting
the sustainable development of society and economy. Based on the internal relationship between water
resources and social economy, Guangdong province water resources allocation system was designed and a
feedback mechanism was established by using Vensim software to build SD model (system dynamics). A
simulation model of the coupled system was established, and the validity and structural consistency of the
model were tested. Then, the distribution characteristics of multiple factors such as total population, GDP,
agricultural water consumption, industrial water consumption, domestic water consumption and ecological
environment water consumption in Guangdong province in 2020 were analyzed. The balance of supply and
demand between water resources and social economy was analyzed. This research could provide theoretical
guidance for the research of water resources-social economy coupling system, which is of great significance
to realize full utilization of water resources and sustainable development.
1 INTRODUCTION
With the rapid economic development and the
continuous population growth, the contradiction
between the supply and demand of water resources
caused by the uneven distribution of water resources
in time and space and the mismatch of the distribution
of water and soil resources in the region have become
increasingly intensified. How to balance the
relationship between regional water resources and
social, economic and ecological aspects has become
a key issue for regional sustainable development
(Huang et al., 2015; Yang et al., 2014; Wu et al.,
2020; Guenther et al., 2015; Behboudian et al., 2021;
Wang et al., 2010). The water environment provides
necessary resources and external conditions for social
and economic development, and the behavior of
water intake and sewage in the process of regional
social and economic development in turn affects the
health of the water environment (Lee et al., 1996;
Kling et al., 2009; Gleick et al., 2003; Wang et al.,
2019). Many researchers have studied the water
resources-social economic coupling System. Foreign
research on the coordinated development of water
resources and social economy started early and has a
high degree of attention (Booker et al., 1994; Faisal
et al., 1997). Current research focuses on the study of
water resources management under the existing
allocation model (Marino et al., 2009; Davies et al.,
2011). Domestic research on the coordinated
development of water resources and social economy
started late, but developed rapidly. The grey relational
degree algorithm, coupling degree model and system
dynamics model were used to studied (Zhang et al.,
2011; Du et al., 2015; Liu et al., 2020a; Chen et al.,
2013; Huang et al., 2019; Liu et al., 2020b). Based on
the grey relational analysis method, Liu et al. (2020a)
analyzed the correlation between the social economic
system indicators and the water resources system
indicators of Shanxi and Shaanxi provinces. And then
they studied the correlation degree of the water
resources-social economic coupling system. Liu et al.
(2020b) studied the coordination degree of the water
resources-social economic coupling system in
Guangdong Province from 1980 to 2017 by using the
coupling coordination degree evaluation method
combining the relative dispersion coefficient method
and the coupling function method.
The GDP of Guangdong Province has long ranked
first in our country, and it has abundant water
resources, numerous rivers and abundant rainfall in
coastal areas. However, due to insufficient utilization
of water resources and neglect of sewage treatment,
212
He, Y. and An, S.
Research on the Configuration of Water Resources-social Economic Coupling System based on SD Simulation.
In Proceedings of the 7th International Conference on Water Resource and Environment (WRE 2021), pages 212-218
ISBN: 978-989-758-560-9; ISSN: 1755-1315
Copyright
c
2022 by SCITEPRESS – Science and Technology Publications, Lda. All rights reserved
the water resources environment in Guangdong
Province has been damaged, leading to a prominent
contradiction between water supply and demand.
Based on the relationship between water resources
systems, this paper took agricultural water shortage
as the core and used Vensim software to build SD
models. This paper designs the allocation of water
resources in Guangdong Province. A feedback
mechanism and a system model were built. Then the
validity and structural consistency of this model were
tested. Finally, the balance of supply and demand
between water resource and social economy was
analyzed.
2 MATERIALS AND METHODS
Vensim software was used to construct the SD model
of the water resources carrying capacity of
Guangdong Province. The initial value of this model
adopted the statistical value of 2005, as shown in
Table 1. Enter the data in Table 1 into Vensim
software. Table 2 shows the 5 state variables (X), 5
rate variables (R), 30 auxiliary variables (A), and 18
constants (P), which were used to establish a
mathematical model describing the relationship
between system variables.
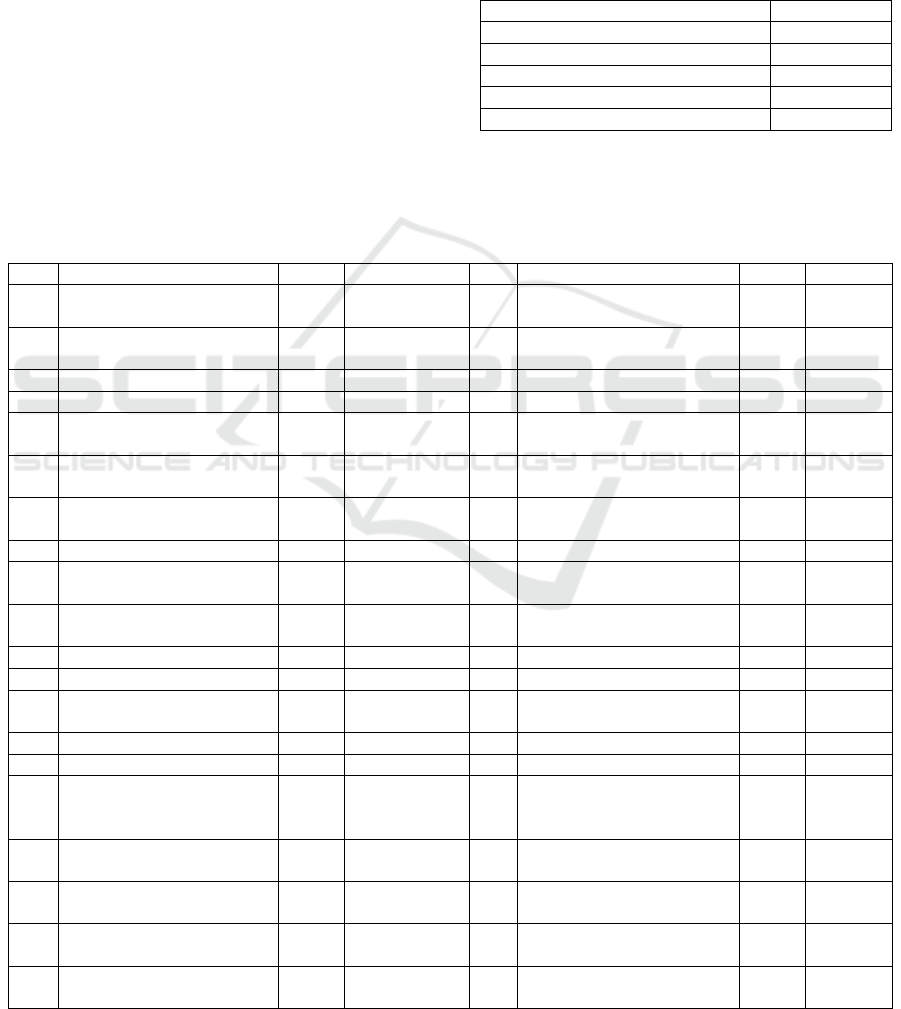
Table 1: Initial values of model state variables.
State variables Initial value
Total water resources 1933.4
Total
p
o
p
ulation 9008.38
Industrial water consum
p
tion 112.5
GDP 72812.6
Effective irrigation area 2066.64
Table 2: Description of system variable.
No. variable nature unit No. variable nature unit
1 Total water resources X 10
9
m
3
30
Domestic sewage discharge
coefficient
P Dmnl
2 Water growth R 10
9
m
3
31
Industrial water
consumption
X 10
9
m
3
3 Water growth rate P Dmnl 32 Industrial water increase R 10
9
m
3
4 Water
p
roduction modulus A m
3
/km
2
33 Industrial water
g
rowth rate P Dmnl
5 Area P km
2
34
Industrial wastewater
discharge
A 10
9
m
3
6 Yield factor A Dmnl 35
Industrial wastewater
dischar
g
e coefficient
P Dmnl
7
Ecological carrying
ca
p
acit
y
of water resources
A hm
2
/cap 36 Sewage discharge A 10
9
m
3
8 Water ecolo
g
ical foot
p
rint A hm
2
/ca
p
37 Sewa
g
e treatment volume A 10
9
m
3
9
Water resources ecological
deficit or surplus
A hm
2
/cap 38
Sewage treatment
coefficient
P Dmnl
10
Global average production
capacity of water resources
P m
3
/km
2
39 Sewage reuse amount A 10
9
m
3
11 Global water balance facto
r
P Dmnl 40 Sewage reuse coefficient P Dmnl
12 Total water consum
p
tion A 10
9
m
3
41 Rainwater utilization P 10
9
m
3
13
Total social water
resources
A 10
9
m
3
42 GDP X 10
9
yuan
14 Surface water resources A 10
9
m
3
43 GDP growth R 10
9
yuan
15 Groundwater resources A 10
9
m
3
44 GDP
g
rowth rate P Dmnl
16
Unconventional water
resources
A 10
9
m
3
45
10,000 yuan GDP
ecological footprint
A
m
3
/
thousand
y
uan
17 Total population X
Ten thousand
p
eo
p
le
46 Effective irrigation area X km
2
18 Population growth R
Ten thousand
p
eople
47
Increase in effective
irrigation area
R km
2
19 Population growth rate P Dmnl 48
Effective irrigation area
g
rowth rate
P Dmnl
20 Urbanization rate A Dmnl 49
Irrigation water
consum
p
tion of farmlan
d
A 10
9
m
3
Research on the Configuration of Water Resources-social Economic Coupling System based on SD Simulation
213
21 Urban population A
Ten thousand
p
eo
p
le
50 Farmland irrigation quota P m
3
/km
2
22 rural population A 10
9
m
3
51
Water consumption for
forestry, animal husbandry,
fisher
y
and livestoc
k
P 10
9
m
3
23
Urban domestic water
consumption
A 10
9
m
3
52
Agricultural water
consumption
A 10
9
m
3
24
Water quota for urban
residents
P L/ people·d 53 Public green area A km
2
25
Rural domestic water
consum
p
tion
A 10
9
m
3
54 Public green area per capita A
m
2
/
p
eo
p
le
26
Water quota for rural
residents
P
L/one
p
eo
p
le·
d
55 Road clean area A km
2
27
Urban public water
consumption
A 10
9
m
3
56
Environmental
conservation area
A km
2
28
Domestic water
consum
p
tion
A 10
9
m
3
57 Environmental water quota P m
3
/km
2
29 Domestic sewage discharge A 10
9
m
3
58
Ecological water
consum
p
tion
A 10
9
m
3
3 RESULTS AND DISCUSSION
The structural consistency inspection was finished by
using the "Check Model" and "Unit Check" included
in the Vensim software. The simulation values were
obtained by inputing historical parameters into the
model. And then fit of the model was verified by
comparing the simulated value with the historical real
value. Generally, the error within 10% is deemed to
pass the historical test. Sensitivity test is to test the
sensitivity of the system to parameter changes,
usually a strong system has less sensitivity. The water
resources carrying capacity of Guangdong Province
from 2015 to 2019 was simulated. The time step was
1 year. The initial value adopted the statistical values
for 2015. The population growth rate was 1.3%, the
GDP growth rate was 8.0%, and the urban residents'
water quota was 216 L/person·d, rural residential
water quota was 171L/person·d, industrial water use
growth rate was 1.02%, effective irrigation area
growth rate was 4%, and farmland irrigation quota
was 728/mu.
3.1 Structural Consistency Check
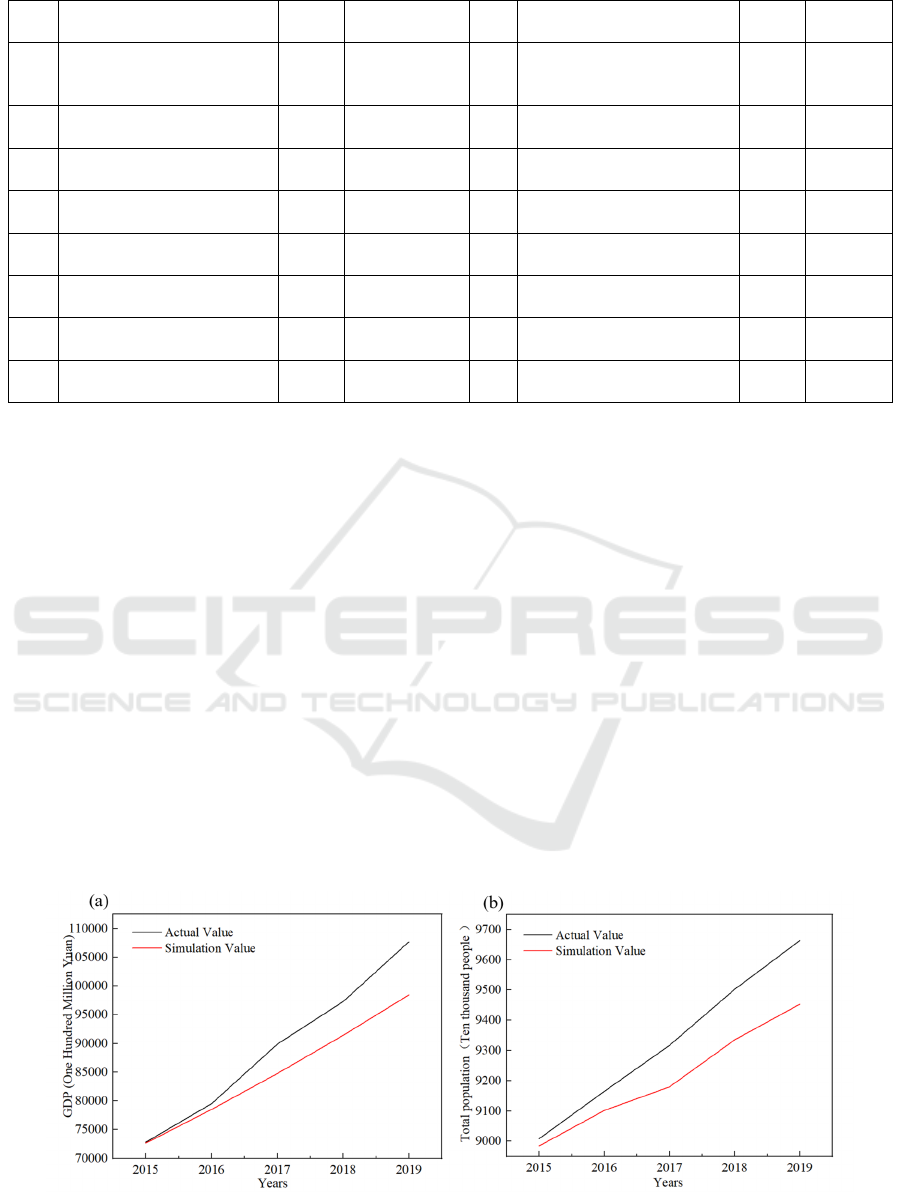
Figure 1 and Table 3 show the changes of total
population and GDP as well as the inspection results
of the main indicators of the system, respectively. The
total population and GDP value changed with time in
a relatively close range and basically remained the
same. The error between the total population and the
real value of GDP value and the simulation value was
less than 10%, which was within the allowable error
range of the system, indicating that the SD model of
the coupled system met the structural consistency
test.
Figure 1: Changes in total population and GDP: (a) real and simulated values of GDP (b) real and simulated values of
population.
WRE 2021 - The International Conference on Water Resource and Environment
214
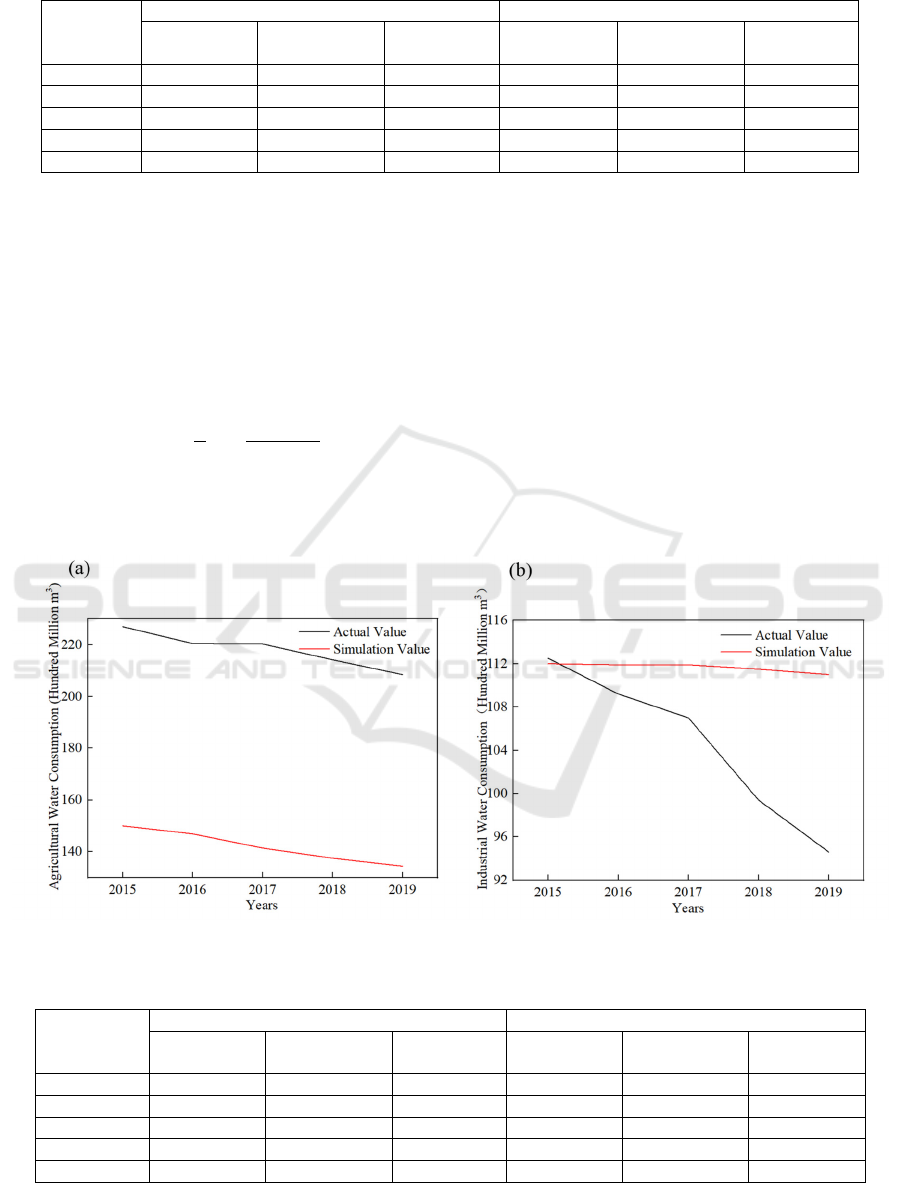
Table 3: Test results of main indicators of the system.
Year
Total
p
o
p
ulation GDP
Actual value
Simulation
value
Error Actual value
Simulation
value
Error
2015 9008.38 8984.4 0.27% 72812.6 72656.3 2.15%
2016 9164.90 9101.6 0.69% 79512.1 78515.6 1.25%
2017 9316.91 9179.7 1.47% 89879.2 84765.6 5.69%
2018 9502.12 9335.1 1.76% 97277.8 91406.3 6.04%
2019 9663.41 9453.1 2.18% 107671.1 98437.5 8.58%
3.2 History Check
History verification is an important method to
simulate the relevant data for a period of time in the
past through the model, and then compare it with the
actual data and observe the error to determine
whether the model is feasible. The governing
equation is as follows.
𝑀𝐴𝑅𝐸
𝐴
𝑅
𝐸
1
𝑛
𝑌
𝑌
𝑌
(1)
In the formula, t is time, n is the total number of
time series data, 𝑌
and 𝑌
are the simulated value and
actual value of variable Y at time t. MARE is the
mean value of ARE.
Figure 2 and Table 4 show the changes in
agricultural water consumption and industrial water
consumption, as well as the inspection results of the
main indicators of the system. The trends of the real
and simulated values of agricultural water
consumption and industrial water consumption are
basically consistent. The deviation of agricultural
water consumption (ARE) is less than 5%, while the
error of industrial water consumption is less than
18%. Both errors are less than 0.2. Within the
reasonable error range, it shows that the agricultural
water consumption and industrial water consumption
of the modified model have passed the historical test.
Figure 2: Changes in agricultural water consumption and industrial water consumption.
Table 4: Test results of main indicators of the system.
Year
A
g
ricultural water consum
p
tion Industrial water consum
p
tion
Actual value
Simulation
value
ARE Actual value
Simulation
value
ARE
2015 227.0 222 2.2% 112.5 112 0.44%
2016 220.5 218.3 0.9% 109.2 111.9 2.47%
2017 220.3 211.5 3.9% 107.0 111.9 4.58%
2018 214.2 209.9 2.0% 99.4 111.5 12.17%
2019 208.5 203.7 2.3% 94.6 111.0 17.34%
Research on the Configuration of Water Resources-social Economic Coupling System based on SD Simulation
215
3.3 Sensitivity Test
Model sensitivity testing includes numerical
sensitivity, behavior sensitivity and policy sensitivity.
When the parameter or structure changes, the change
to the simulation value is lower, that is, it has lower
behavior sensitivity and policy sensitivity. The
formula for sensitivity test is as follows.
𝑆
∆𝐿
𝐿
𝑋
∆𝑋
(2)
Among them, t is time; SL is the sensitivity of
state variable L to parameter X; Lt is the value of state
variable L at time t; is the value of parameter X at
time t; ΔLt is the change of state variable at time t;
ΔXt is the amount of change of the parameter X at
time t.
When the parameter Xj changes, the sensitivity of
N state variables (L1, L2, L3...Li…LN) to Xj are
(SL1, SL2, SL3, ...SLi...SLN). The formula of the
model's sensitivity SXj with respect to the parameter
Xj is as follows.
𝑆
1
𝑁
𝑆
(3)
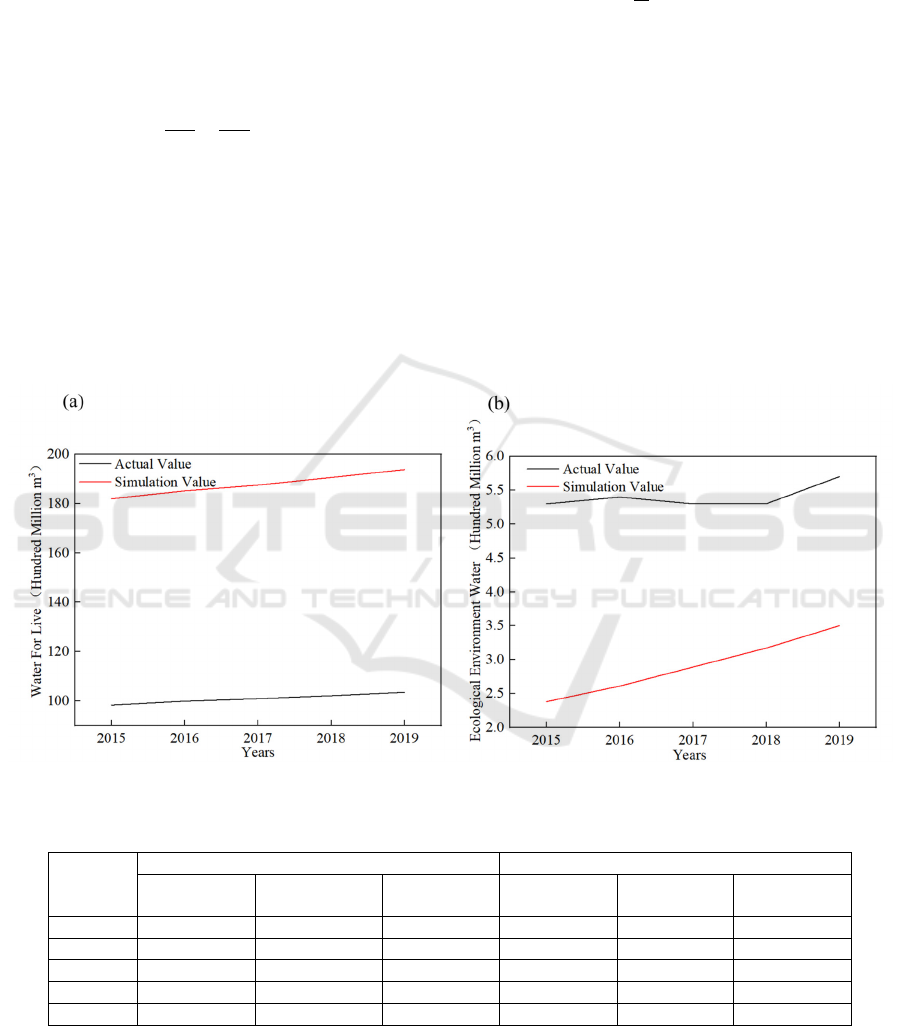
Figure 3 and Table 5 show the changes in
domestic water consumption and ecological
environment water consumption, as well as the
inspection results of the main indicators of this
system. The sensitivity of the simulation results had a
large deviation, which indicated that the results of the
domestic water consumption and the ecological
environment water consumption calculated by the
model have a large error. The large error was due to
the constraints of many factors among the three. In
other words, domestic water consumption was the
most sensitivitive in the SD model of the Guangdong
Water Resources-Social Economic Coupling System,
which was the most important factor in the SD model.
Figure 3: Changes in domestic water consumption and ecological environment water consumption.
Table 5: Test results of main indicators of the system.
Year
Water for live Ecolo
g
ical Environment Wate
r
Actual value
Simulation
value
Error Actual value
Simulation
value
Error
2015 98.3 182.0 85.15% 5.3 2.38 55.09%
2016 99.9 185.2 85.39% 5.4 2.61 51.67%
2017 100.9 187.5 85.83% 5.3 2.89 45.47%
2018 102.1 190.6 86.68% 5.3 3.17 40.19%
2019 103.5 193.8 87.25% 5.7 3.5 38.60%
Table 6 shows the total population, GDP,
agricultural water consumption, industrial water
consumption, domestic water consumption and
ecological environment water consumption of
Guangdong province in 2020. The error of total
population, GDP and agricultural water consumption
is less than 10%. Domestic water consumption has the
highest sensitivity in the SD model of Guangdong's
water resources-socio-economic-ecological coupling
system, and the error is relatively large.
WRE 2021 - The International Conference on Water Resource and Environment
216
Table 6: Calculation results of main indicators of the system in 2020.
Index
Results
total
population
GDP
agricultural
water
consumption
industrial water
consumption
Live water
consumption
ecological
environment
water
consumption
Actual
value
9738.21 11935.37 205.30 90.20 106.8 5.5
Simulation
value
9976.79 12997.61 209.61 102.11 127.19 6.51
Error 2.45% 8.9% 2.1% 13.2% 19.1% 18.4%
4 CONCULSION
Based on the inherent relationship between water
resources and social economy, the SD model of the
coupled system of water resources and social
economy in Guangdong Province was constructed.
Then the model was tested and the distribution
characteristics of multiple factors such as
Guangdong’s total population, GDP, agricultural
water consumption, industrial water consumption,
domestic water consumption and ecological
environment water consumption in 2020 were
analyzed. The error between the real value and the
simulated value for the total population and GDP was
less than 10%. ARE of agricultural water
consumption was less than 5%, and ARE of industrial
water consumption is less than 18%. Within a
reasonable error range, the SD model passed the
structural consistency test and the historical test. The
sensitivity results had large deviations. Domestic
water consumption was the most sensitive in the SD
model of Guangdong Water Resources-Social
Economic Coupling System. Therefore, saving
domestic water or making domestic water recycle
multiple times has great social significance.
REFERENCES
Behboudian, M., Kerachian, R., & Motlaghzadeh, K.
(2021). Evaluating water resources management
scenarios considering the hierarchical structure of
decision-makers and ecosystem services-based criteria.
Science of the Total Environment, 751, 141759.
Booker, J., & Young, R. (1994). Modeling intrastate and
interstate markets for Colorado river water resources.
Journal of Environmental Economics and
Management, 26(1), 66-87.
Chen, Z., Huang, Q., & Liu, Z. (2013). Analysis on the
characteristics of spatial and temporal changes of
dryness and wetness in guangdong from 1962 to 2007.
Progress in Water Science, 24(4), 469-476.
Davies, E., & Simonovic, S. (2011). Global water resources
modeling with an integrated model of the social-
economic-environmental system. Advances in Water
Resource, 6(34), 684-700.
Du, X., & Zhang, T. (2015). Simulation of the coupling
development of water resources environment and social
economic system- take dongting lake ecological
economic zone as an example. Geographic science,
35(9), 1109-1114.
Faisal, I., Young, R., & Warner, J. (1997). Integrated
economic-hydrologic modeling for groundwater basin
management. Water Resources Development, 13(1),
21-34.
Gleick, P. (2003). Global freshwater resources: soft-path
solutions for the 21st century. Science, 302(5650),
1524-1528.
Guenther, M., Greer, G., & Saunders, C., et al. (2015). The
wheel of water: the contribution of the agricultural
sector in Selwyn and Waimakariri districts to the
economy of Christchurch. Journal of Isotopes,
319(5865), 904-905.
Huang, C., Jiang, Z., & Yang, Z., et al. (2019). Evaluation
of water resources safety in Guangdong Province and
analysis of influencing factors based on entropy method
and analytic hierarchy process. Journal of Water
Resources and Water Engineering, 30(5), 140-147.
Huang, Y., Xu, L., & Hao, Y. (2015). Dual-level material
and psychological assessment of urban water security
in a water-stressed coastal city. Sustainability, 7(4),
3900-3918.
Kling, C., & Zhao, J. (2009). Welfare measures when
agents can learn: a unifying theory. The Economic
Journal, 119(540), 1560-1585.
Lee, D., & Howitt, R. (1996). Modeling regional
agricultural production and salinity control alternatives
for water quality policy analysis.
American Journal of
Agricultural Economics, 78(1), 41-53.
Liu, B., Huang, R., & Yu, H. (2020a). Evaluation of the
coordination degree between the socio-economic and
water resources system in Guangdong Province.
PEARL RIVER, 41(5), 38-42.
Liu, H., Wu, J., & Chen, X.(2020b). Analysis of grey
correlation degree between water resources system and
Research on the Configuration of Water Resources-social Economic Coupling System based on SD Simulation
217

socio-economic system. Tropical Geomorphology,
41(1), 31-36.
Marino, K. (2009). System dynamics analysis for managing
Iran's Zayandeh-Rud river basin. Water Resource
Manage, 23, 2163-2187.
Wang, H., Yan, D., & Jia, Y. (2010). Modern hydrology
and water resources subject system and research
frontiers and hot issues. Progress in Water Science, 4,
479-489.
Wang, X., & Shen, D. (2019). Discrimination of the
Similarities and Differences in the Development Logic
of Water Resources Economics at Home and Abroad.
Ecological Economy, 35(4), 146-151.
Wu, Z., & Ye, Q. (2020). Water pollution loads and shifting
within China's inter-province trade. Journal of Cleaner
Production, 259, 120879.
Yang, Q., Ding, Y., & De, V. (2014). Assessing regional
sustainability using a model of coordinated
development index: a case study of mainland china.
Sustainability, 6(12), 9282-9304.
Zhang, J., Zhang, X., & Wang, J. (2011). Coupling analysis
of agro-ecolomic system in gully area of Loess Plateau
in 1949-2008: A case study in Changwu County of
Shanxi Province.Chinese Journal of Applied Ecology,
22(3), 755-762.
WRE 2021 - The International Conference on Water Resource and Environment
218
