
Response of Phosphorus near Reservoirs in South Branch of the
Yangtze Estuary to the Upstream Runoff and Sediment Load
Variations
Xian Zhu
1,2
, Zhenshan Xu
1,2,*
, Ao Chu
1,2
, Hongwei Ding
3
, Min Gan
1,2
and Yongping Chen
1,2
1
State Key Laboratory of Hydrology-Water Resource and Hydraulic Engineering, Hohai University, China
2
College of Harbour, Coastal and Offshore Engineering, Hohai University, China
3
Nanjing Hydraulic Research Institute, China
Keywords: Phosphorus, The Yangtze estuary, Water quality, Numerical model
Abstract: The water quality of reservoirs in the south branch of the Yangtze estuary is strongly influenced by the
phosphorus loadings. The variations of runoff and sediment loads from upstream cause the temporal
variations of phosphorus loadings here, which poses potential risks to the reservoirs. The changes of runoff
and sediment loads from upstream in the future are uncertain because of human activities and global climate
change. An integrated water quality model was established to study the possible changes of phosphorus
loadings in the south branch of the Yangtze estuary in the future in response to variations of runoff and
sediment loads from upstream. The model contains hydrodynamic, sediment dynamics, and some
biochemical processes. The model is well-calibrated and verified based on the related data in 2018.
Different sets of runoff and sediment loads from upstream were then applied in this model to learn the
changes of concentration of total phosphorus (TP), phosphate (PO
4
3-
), and particle phosphorus (PP). Results
show that the TP concentration has no significant change with different conditions of input of runoff and
sediment loads. However, the PO
4
3-
and PP concentrations are significantly influenced by both the changes
of runoff and sediment loads. The annual mean value of PO
4
3-
concentration would increase by 10-25% if
the input of runoff increases by 20% or the sediment loads decrease by 20%. It would decrease by 8-20% if
the input of runoff decreases by 20% or the sediment loads increase by 20%. The annual mean value of PP
concentration would increase by 12-35% if the input of runoff decreases by 20% or the sediment loads
increase by 20%. It would decrease by around 15-30% if the input of runoff increases by 20% or the
sediment loads decrease by 20%. The changes of the PO
4
3-
and PP are caused by the convection and
diffusion of the flow, and the adsorption and desorption of sediments. Notwithstanding, these changes
would reconstitute the component of TP of reservoirs in the south branch of the Yangtze estuary. Although
the PP still takes the main proportion, the proportion of PO
4
3-
would increase significantly and the growth of
plankton would be promoted which may cause a high risk of eutrophication.
1 INTRODUCTION
Phosphorus (P) is one of the most important nutrient
elements determining ecosystem production
(Sanudo-Wilhelmy et al., 2001; Babu & Nath,
2005). However, excessed P loadings in water would
bring about eutrophication following with serious
water quality problems (Hilton et al., 2006). In the
past decades, anthropogenic inputs of P have
increased dramatically in many mega-estuaries, such
as the Yangtze, the Mississippi, and the Nile
(Goolsby et al., 1999; Ludwig et al., 2009; Xu et al.,
2013). The estuarine areas are always densely
populated and economically developed. Thus the
losses caused by eutrophication here are always
huge.
The Yangtze estuary is one of the most urbanized
coastal regions of China. The estuarine environment
has significantly deteriorated in recent decades
(Wang, 2006). The frequency of occurrence of algal
blooms has increased with each decade since 1970.
From 2000 to 2010 over 100 harmful algal blooms
were occurring (Liu et al., 2013). To solve this
problem, the government had made some policies to
reduce the P loadings from fertilizer, sewage
(domestic and industrial), and manure from livestock
Zhu, X., Xu, Z., Chu, A., Ding, H., Gan, M. and Chen, Y.
Response of Phosphorus Near Reservoirs in South Branch of the Yangtze Estuary to the Upstream Runoff and Sediment Load Variations.
In Proceedings of the 7th International Conference on Water Resource and Environment (WRE 2021), pages 179-188
ISBN: 978-989-758-560-9; ISSN: 1755-1315
Copyright
c
2022 by SCITEPRESS – Science and Technology Publications, Lda. All rights reserved
179
in the upstream river basin. The implementation of
these policies has achieved some progress. However,
because of human activities and global climate
change, the input of flow and sediment loadings
from upstream to the Yangtze estuary changes a lot,
which causes the adjustment of P loadings in the
estuary (Tang et al., 2020). The weather change
would change the rainfall in the Yangtze River
basin, which further changes the input of flow to the
estuary. The flow condition controls the diffusion
process, which may change the spatial distribution
of P. After the Three Gorges dam started to work in
2003, the sediment loadings to the estuary show a
sharp decrease (Chen et al., 2010; Ren et al., 2021).
In 2000-2010, the suspended sediment loadings in
the estuary decreased about 20-30% (Li, 2012). The
adsorption and desorption with suspended sediment
are considered as one of the main processes
controlling the P circulation in estuarine areas
(Froelich, 1988; Shen et al., 2008; Xu et al., 2015)
since the P has a high affinity with fine sediment
(Stone & English, 1993; Winterwerp & van
Kesteren, 2004). Thus, the sediment input condition
would change the loadings and constitution of P in
water. For preventing and solving new potential
water quality problems in reservoirs in the Yangtze
estuary, it is necessary to study the P responses to
variations of runoff and sediment loads from
upstream.
Numerical modeling is an effective approach to
study this problem. In the Yangtze estuary, several
researchers have used numerical models to study
water quality problems. However, water quality
processes in these models are mainly based on a
single convection-diffusion equation, which is not
adequate for much more complex estuary systems.
Although some new studies have included some
biochemical processes in their models (Wang et al.,
2016; Zhu et al., 2016; Ge et al., 2020), their results
can only reflect the current situation rather than
study the question imposed in this study.
To study the response of P near reservoirs in the
south branch in the Yangtze estuary to the variations
of runoff and sediment loads from upstream, an
integrated water quality model for the Yangtze
estuary is developed. The model includes the
sediment dynamic processes, the mineralization, and
the adsorption and desorption of sediment to achieve
the following objectives: (1) show the temporal and
spatial distribution of P in the south branch in 2018;
(2) study the changes of P loadings in the south
branch with the change of flow and sediment input;
(3) study the changes of the constitution of P in the
south branch with the change of flow and sediment
input. This study would also bring some
contributions to the knowledge of the geochemical
circulation of P in estuarine areas.
2 MATERIALS AND METHODS
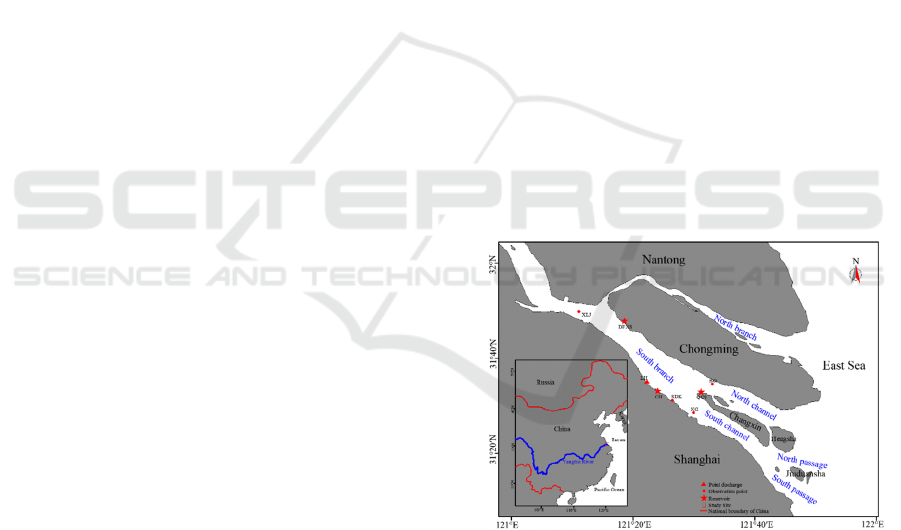
2.1 Study Area
The study area is the Yangtze estuary (from
Xuliujing to the mouth of the estuary).
Hydrodynamic and water quality data were
measured in several observation stations in this area
(red dots in Figure 1). The water level data in
Xuliujing (XLJ) and Shidongkou (SDK) stations are
applied for the calibration and verification of the
hydrodynamic model. In XLJ, SDK, Beigang (BG),
and Nangang (NG) stations, data of temperature,
dissolved oxygen concentration (DO), suspended
sediment concentration (SSC), total phosphorus
concentration (TP), and orthophosphate
concentration (PO
4
3-
) is applied for the calibration
and verification of the water quality model.
Three reservoirs settled in the south branch of the
Yangtze estuary are the main concerns in this
research. They are the Dongfengxisha (DFXS)
reservoir, the Chenhang (CH) reservoir, and the
Qingcaosha (QCS) reservoir (red stars in Figure 1)
Figure 1: Sketch map of the Yangtze estuary and the
distribution of the three reservoirs and the observation
stations used in this study.
WRE 2021 - The International Conference on Water Resource and Environment
180
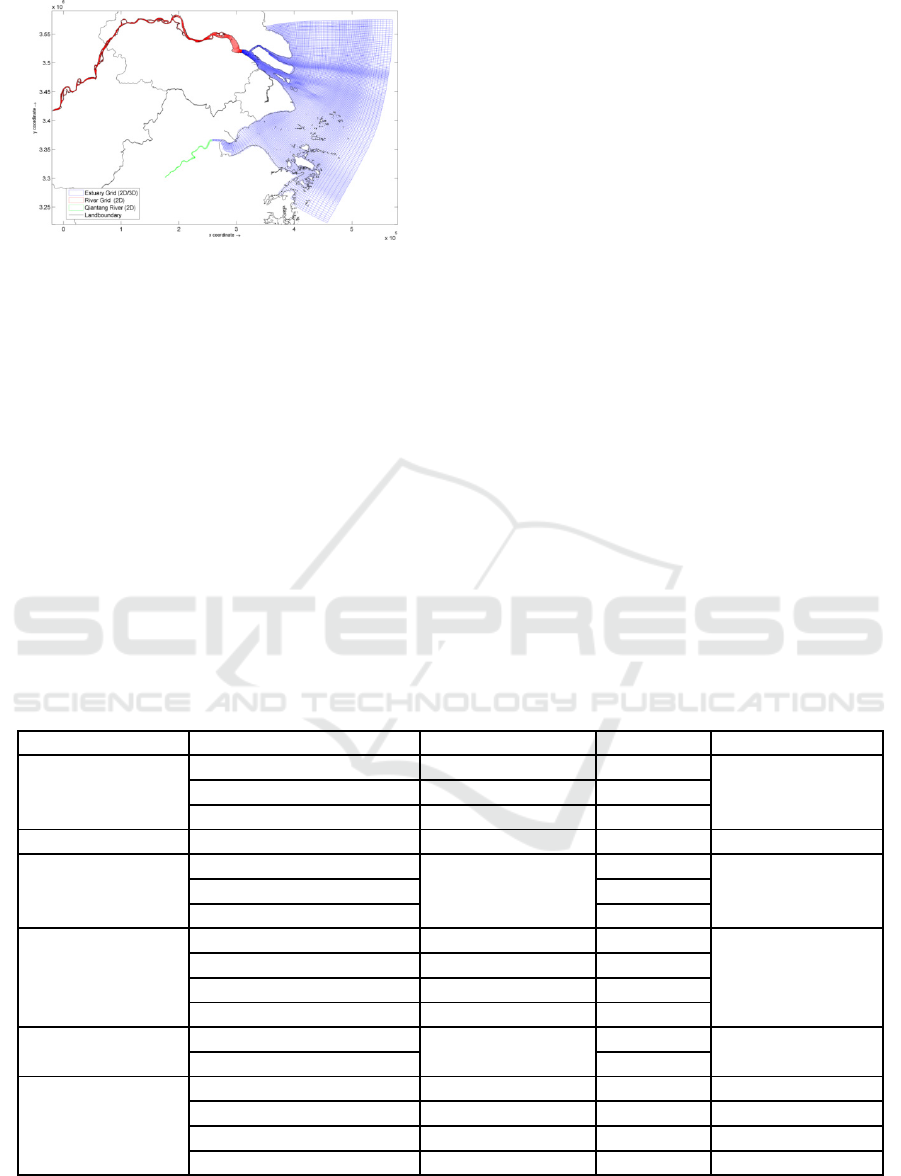
Figure 2: Model domain of the process-based Yangtze
estuary model (red grid: Datong-Xuliujing; blue grid:
Xuliujing-Sea; green grid: Lucipu-Haining). (Chu, 2019).
2.2 Hydrodynamic Model
The hydrodynamic model for the Yangtze estuary is
set up with the upstream boundary set at Datong, the
tidal limit, including part of the adjacent East China
Sea and the entire Hangzhou Bay based on Delft3D
(Chu, 2019). The hydrodynamic processes are
modeled in the hydrodynamic model. The model
domain is shown in Figure 2, which comprises three
regional models with two-dimensional simulation.
The bathymetry and coastal line measured in 2018
were used in this study. This hydrodynamic model is
well-calibrated and validated (Chu, 2019). More
details about the model domain can be learned in
Chu’s study (2019).
2.3 Water Quality Model
The water quality model is built based on the
hydrodynamic model by including the water quality
module of Delft3D. The water quality model
includes the temperature, the oxygen, the particle
inorganic matter, the dissolved inorganic matter, and
the organic matter. To be specific, they are the water
temperature, the dissolved oxygen, the suspended
and bed sediment, the total phosphorus (TP), the
particle phosphorus (PP) and, the orthophosphate
(PO
4
3-
) both in water and adsorbed onto sediment.
All upstream boundary conditions of all these
matters are set in Datong based on the measured data
in 2018. The data of the sea boundary are set as
constant according to the model calibration. Besides,
there is a point source pollution set as discharge in
the model (LH shown as in Figure 1), and the data
are also set based on the measurement.
Except for the convection-diffusion processes,
the following processes are also modeled: the heat
exchange, the reaeration of oxygen, the resuspension
and sedimentation of sediment, the adsorption and
desorption of sediment, and the mineralization of
organic phosphorus. Based on the literature and the
model calibration, the values of the main parameters
for all these processes are determined and listed in
Table 1.
Table 1: Values of major parameters of the water quality model.
Process Parameter Unit Value Reference
Heat exchange
FactRcHeat - 0.2
Default ZHeatExch ℃/d 0.1
TCKadsP - 1
Oxygen reaeration KLRear - 1 Default
Diffusion
XDisper
m
2
/s
10
Calibrated YDisper 10
VertDisper 0.001
Sediment motion
VSedIM1 m/d 7
Chu, 2019 &
Calibrated
TaucRSIDM N/m
2
0.3
TaucSIM1 N/m
2
0.15
VResDM 1/d 7
Mineralization
Ku_dFdcP20
1/d
0.18
Bowie et al., 1985
Kl_dFdcP20 0.15
Adsorption &
desorption
RcAdPO4AAP 1/d 0.08 Calibrated
RcAAPS1 1/d 0.04 Calibrated
Kads_20 (mol/L) (1-a) 3.8 Default
KdPO4AAP m
3
/g 0.7 Calibrated
Note: the specific meanings of the abbreviations in the table can be learned in the Manual of the Delft3d (D-Water Quality
Processes Library Description (Version 5.01), 2017)
Response of Phosphorus Near Reservoirs in South Branch of the Yangtze Estuary to the Upstream Runoff and Sediment Load Variations
181
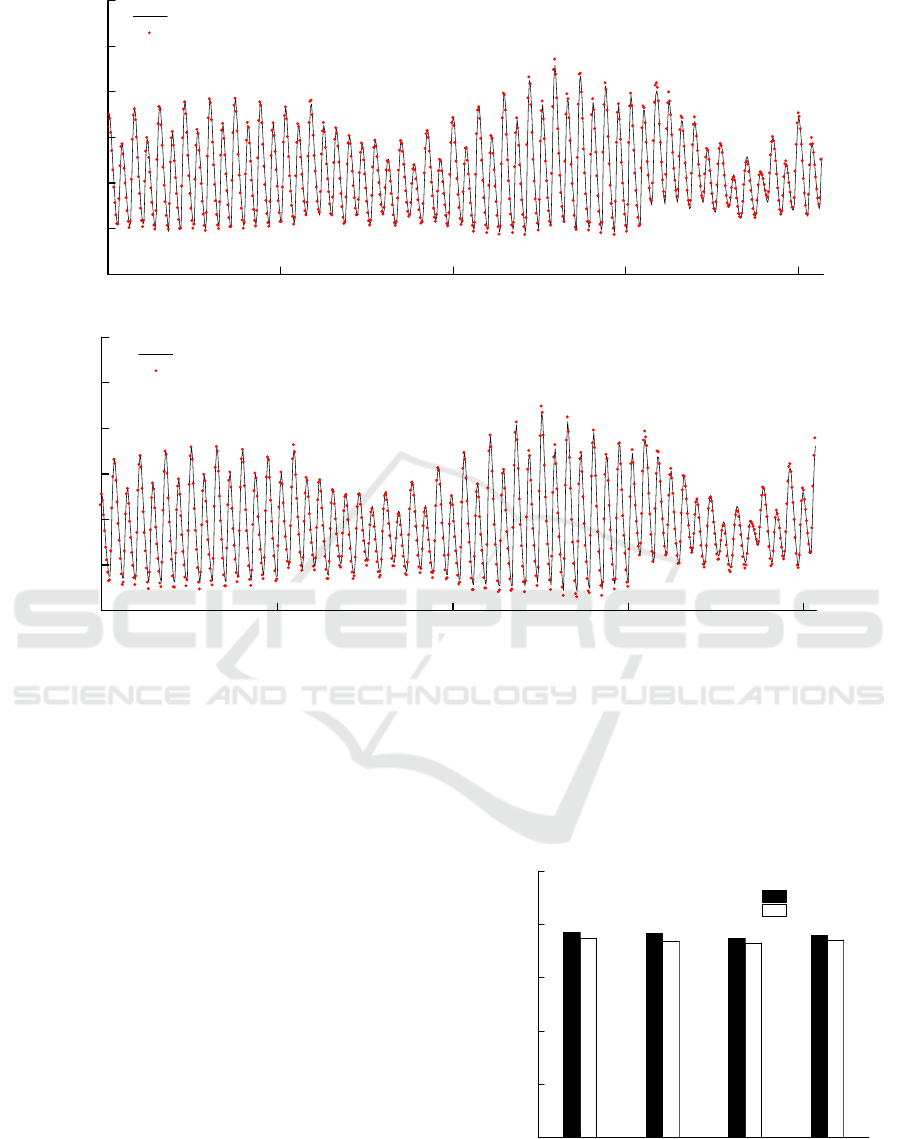
Figure 3: Verification of the water levels at (a) XLJ and (b) SDK stations.
The model is calibrated and verified with the
measured data in 2018. The well-calibrated and
verified model is considered as the original case
(Case 1). Then 4 cases based on the original one are
set to change the input of flow and sediment. The
flow condition of the upstream boundary increases
to 120% and decreases to 80% of the original to
learn the change of the flow (Case 2 and 3). The
sediment condition of the upstream boundary
increases to 120% and decreases to 80% of the
original to learn the change of the sediment (Case 4
and 5).
3 RESULTS AND DISCUSSION
3.1 Calibration and Verification
3.1.1 Hydrodynamic Model
An integrated verification of the hydrodynamic
model was carried in Chu’s work (Chu, 2019). In
this research, the following data are collected to
show the brief verification of the hydrodynamic
model, while more details about it can be learned in
Chu (2019). In Figure 3, hourly data of water level
in flood season in 2018 in XLJ and SDK stations are
well verified. The good verification indicates the
hydrodynamic conditions in the water quality model
are accurate and reliable.
2018/7/26 2018/8/2 2018/8/9 2018/8/16 2018/8/23
-1
0
1
2
3
4
5
Water level (m)
model
measure
2018/7/26 2018/8/2 2018/8/9 2018/8/16 2018/8/23
-1
0
1
2
3
4
5
Water level (m)
model
measure
XLJ SDK BG NG
0
5
10
15
20
25
Temperature (℃ )
Station
Measured
Model
WRE 2021 - The International Conference on Water Resource and Environment
182
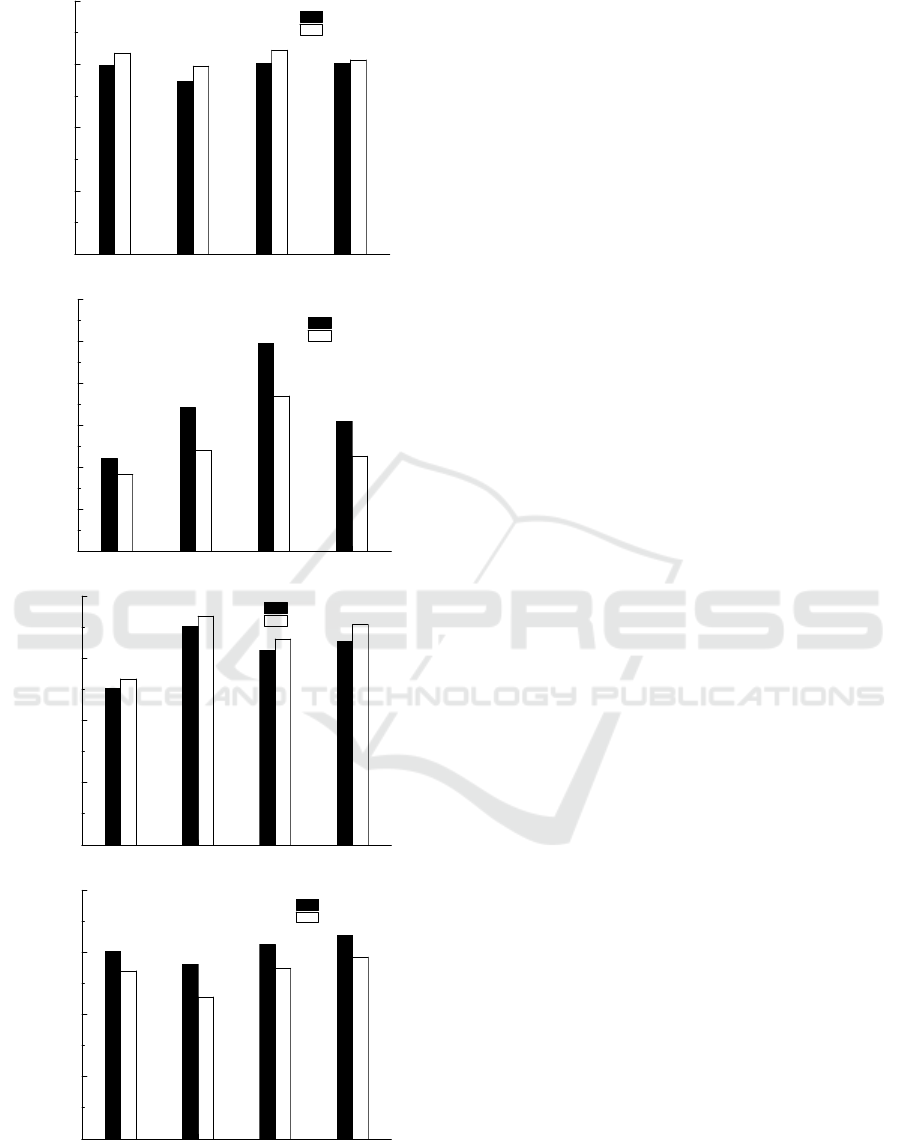
Figure 4: Comparison of the modeled water quality results
with the measured data in 2018 in the Yangtze estuary.
3.1.2 Water Quality Model
The annual average values of water quality
parameters along the south branch of the Yangtze
estuary were calculated for the comparison with the
model results. The modelled temperature, DO, SSC,
TP, and PO
4
3-
are all generally in good accordance
with the measured data (Figure 4). The average
relative errors for temperature, DO and SSC are
2.8%, 5.9%, and 25.1%, respectively. The average
relative errors for TP and PO
4
3-
are 6.1% and 13.1%,
respectively. The errors of temperature, DO and TP
are below 10%. The maximum error occurs in SSC,
but the errors are below 30% which is acceptable in
the simulation of sediment. The relatively significant
errors of SSC also cause the errors of PO
4
3-
to be
relatively large (over 10%). This is because
sediment is the important carrier of the PO
4
3-
in
water. In general, the model performed well in the
simulation of P concentration in the Yangtze
Estuary.
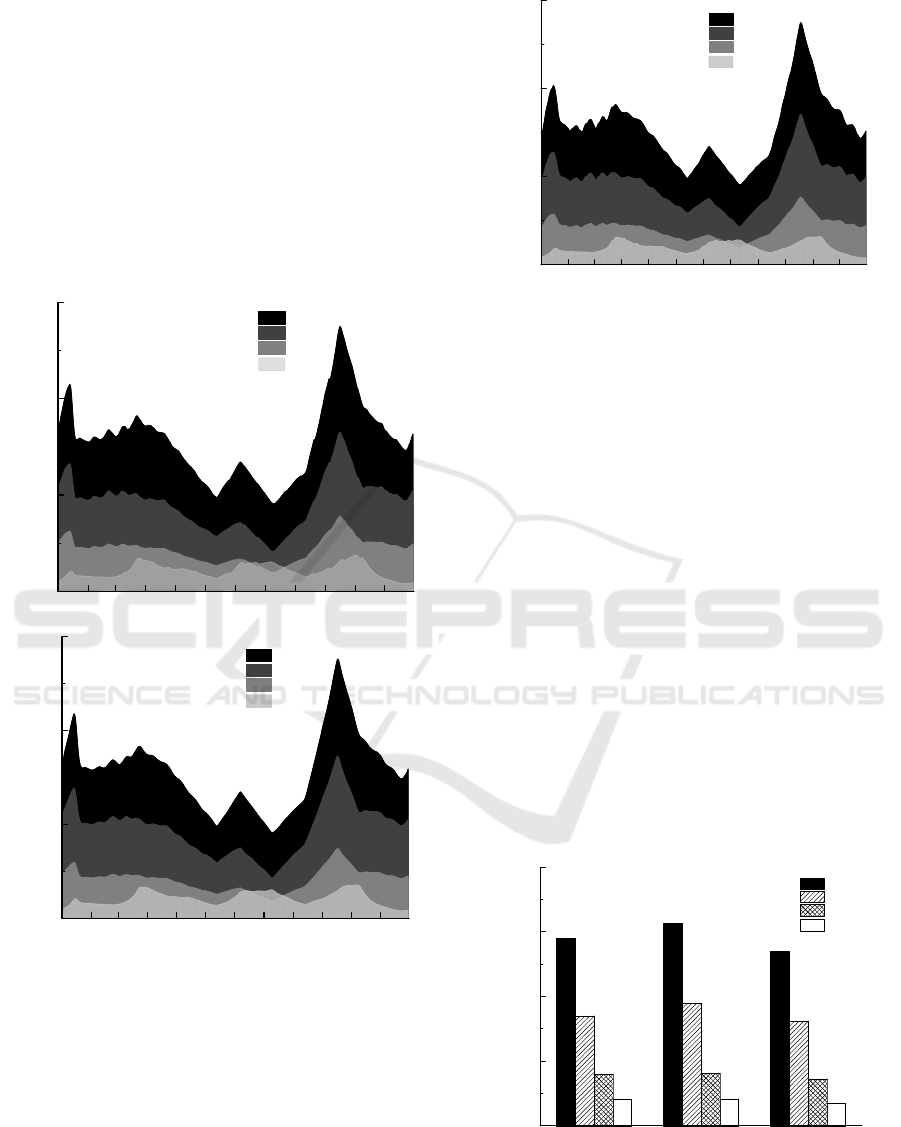
3.2 P Distribution in 2018
The results of the time series of TP, PP, dissolved
organic phosphorus (DOP), and PO
4
3-
in three
reservoirs in 2018 are shown in Figure 5. It can be
seen that the changing trend and concentration of
different P fractions among the three reservoirs are
very similar, which indicates the spatial distribution
of P in the south branch has little difference. The
concentration of different P fractions in water is in
the order of PP > DOP > PO
4
3-
. The PP takes over
50% proportion of TP. Thus, the changing trend of
PP generally determines the changing trend of TP.
The changing trend of TP, PP, and DOP are nearly
the same. The minimum values are from June to
August, while the maximum values are in October.
In January and October, the TP concentration
exceeds 0.2 mg/L. In the summertime, the TP
concentration reaches the minimum of the whole
year, but still over 0.1 mg/L. The maximum
concentration of the TP can reach around 0.27 mg/L
in October, the concentration of PP and DOP also
reach the maximum of 0.17 and 0.07 mg/L
respectively at this time. The PO
4
3-
concentration is
relatively stable, fluctuating between 0.01 - 0.03
mg/L.
Three reasons can explain the changing trend of P
loadings in the estuary. Firstly, the upstream
boundary conditions of different P fractions play the
main role. Secondly, the diffusion process controlled
by the flow input from upstream affects the P
concentration. In flood season, the flow input
XLJ SDK BG NG
0
3
6
9
12
Measured
Model
DO (mg/L)
Station
XLJ SDK BG NG
0
30
60
90
120
150
180
Measured
Model
SSC (mg/L)
Station
XLJ SDK BG NG
0.00
0.04
0.08
0.12
0.16
Measured
Model
TP (mg/L)
Station
XLJ SDK BG NG
0.00
0.01
0.02
0.03
0.04
Measured
Model
Ortho phosphate (mg/L)
Station
Response of Phosphorus Near Reservoirs in South Branch of the Yangtze Estuary to the Upstream Runoff and Sediment Load Variations
183
increase and the mixing process of P in the estuary
get promoted, which decreases the P concentration
in the south branch. In the dry season, the situation
is just the opposite. Thirdly, the adsorption and
desorption of sediment control the transform
between particle and dissolved P. The sediment
input from upstream determines the suspended
sediment concentration (SSC) in the estuary. The
amount of P adsorbed onto sediment would increase
if the SSC increases, and the PP concentration will
increase and relatively the dissolved P concentration
decrease.
Figure 5: The time-series results of TP, PP, DOP, and
PO
4
3-
in DFXS (a), CH (b), and QCS (c) reservoirs.
In Figure 6, the annual average concentration and
proportion of different P fractions in three reservoirs
are shown. The situation of the three reservoirs does
not show a significant difference. The annual
average concentration of TP is around 0.15 mg/L.
The annual average concentration of PP, DOP, and
PO
4
3-
are 0.08 - 0.095, 0.035 - 0.04 and 0.015 - 0.02
mg/L, respectively. Because of the discharge of the
Liuhe river near the CH reservoir, the P
concentrations in the CH reservoir are a bit higher
than those of the other two reservoirs. The annual
average concentration of P in the south branch in
2018 maintains a relatively low concentration after
2015 compared with those from 2000 to 2010 (Shen
et al., 2008; Hou et al., 2009). The constitution of TP
in three reservoirs is almost the same. The particle
phosphorus accounts for the largest proportion
reaching around 60%, while the phosphate took the
least proportion, with only 12 - 13%. The proportion
of DOP is 25 - 30%.
0.0
0.1
0.2
0.3
Concentration (mg/L)
TP
PP
DOP
PO
4
3-
Dec
Nov
Oct
Sep
Aug
Jul
Jun
May
AplMarFeb
Month
Jan
0.0
0.1
0.2
0.3
Concentration (mg/L)
TP
PP
DOP
PO
4
3-
Dec
Nov
Oct
Sep
Aug
Jul
Jun
May
Apl
Mar
Feb
Month
Jan
0.0
0.1
0.2
0.3
Concentration (mg/L)
TP
PP
DOP
PO
4
3-
Dec
Nov
Oct
Sep
Aug
Jul
Jun
May
AplMarFeb
Month
Jan
DFXS CH QCS
0.00
0.05
0.10
0.15
0.20
Concentration (mg/L)
TP
PP
DOP
PO
4
3-
(a)
(b)
(c)
WRE 2021 - The International Conference on Water Resource and Environment
184
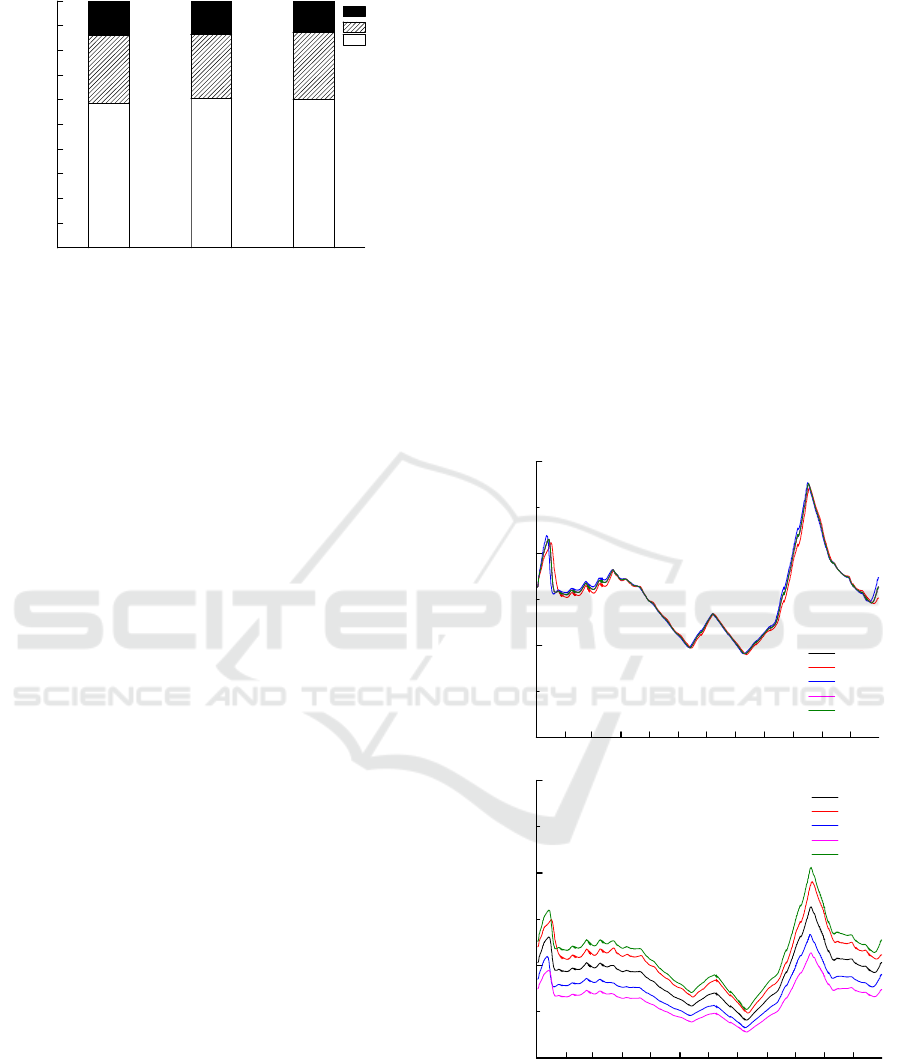
Figure 6: The annual average concentration (a) and
proportion (b) of different P fractions in the three
reservoirs.
3.3 Effect of Flow and Sediment Input
According to the modeling results in 2018, the P
distribution, concentration and constitution in three
reservoirs are generally the same. This similarity
also shows in the case studies. Thus, the results of
the one-year time series of TP, PP, and PO
4
3-
of the
original case (2018) and the 4 study cases of the
DFXS reservoir are taken as the representative of the
three reservoirs in the following analysis (Figure 7).
In each case, only the upstream boundary conditions
of flow or sediment are changed while other
conditions are consistent with the original case. The
changing trends of TP, PP, and PO
4
3-
of different
cases are generally the same as those of the original
case, which is controlled by the time series of P
concentration conditions of the upstream boundary.
The TP concentration of 5 cases shows little
difference. However, the concentrations of PP and
PO
4
3-
show changes with the various flow and
sediment input conditions.
The changing trends of the PP and PO
4
3-
are
inverse. With the increase of the flow (case2) and
the decrease of sediment input (case3), the PP shows
a decrease while the PO
4
3-
shows an increase. With
the decrease of the flow (case1) and the increase of
sediment input (case4), the PP shows an increase
while the PO
4
3-
shows a decrease. Generally, when
the flow input increase and the sediment input
decrease, the concentration of PP would decrease
and the concentration of PO
4
3-
would increase. On
the contrary, when the flow input decrease and the
sediment input increase, the concentration of PP
would increase and the concentration of PO
4
3-
would
decrease. These changes are affected by the
convection and diffusion, and the adsorption and
desorption processes of sediment. The suspended
sediment concentration (SSC) would decrease
because of the diffusion process with the flow input
increase. Both the increase of the diffusion process
and the decrease of SSC would further decrease the
PP concentration in the south branch. However, the
situation of the PO
4
3-
is relatively complex under
these conditions. The increase of the flow input
promotes the mixing processes of PO
4
3-
, which
decreases the PO
4
3-
concentration in the south
branch. On the contrary, the increase of the flow
input decreases SSC, the amount of carrier of PO
4
3-
,
which increases the PO
4
3-
concentration in the south
branch. It can be concluded that the effect of
adsorption and desorption on the PO
4
3-
concentration
is more significant than that of diffusion because of
the increase of PO
4
3-
in case2 and decrease of it in
case1. In the real nature, the effect of adsorption and
desorption of sediment on the PO
4
3-
concentration
would even become more significant when taking
the release of P during the sediment resuspension
into consideration, like the situation in the MTZ
(Shen et al., 2008; Li et al., 2019).
DFXS CH QCS
0
10
20
30
40
50
60
70
80
90
100
Percentage (%)
PO
4
3-
DOP
PP
0.0
0.1
0.2
0.3
TP (mg/L)
origin
case1
case2
case3
case4
Dec
Nov
Oct
Sep
Aug
Jul
Jun
May
Apl
Mar
Feb
Month
Jan
0.0
0.1
0.2
0.3
PP (mg/L)
origin
case1
case2
case3
case4
Dec
Nov
Oct
Sep
Aug
Jul
Jun
May
Apl
Mar
Feb
Month
Jan
Response of Phosphorus Near Reservoirs in South Branch of the Yangtze Estuary to the Upstream Runoff and Sediment Load Variations
185
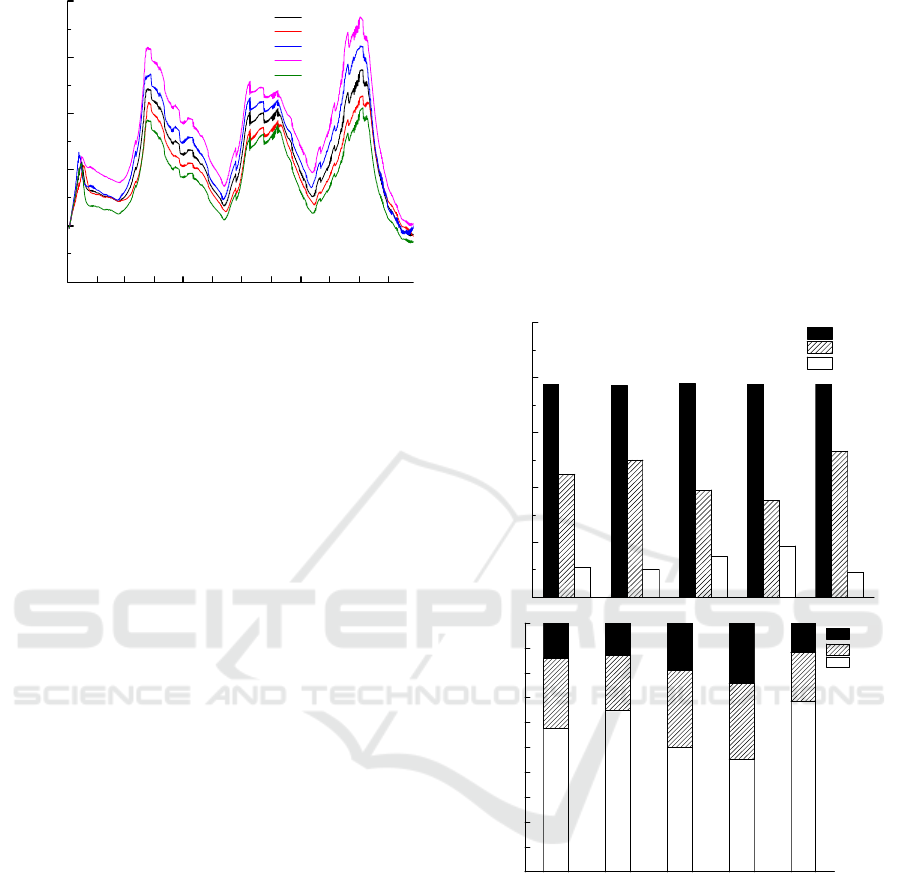
Figure 7: The time-series results of (a) TP, (b) PP, and (c)
PO
4
3-
of different cases in the DFXS reservoir.
The annual average concentration and proportion
of different P fractions of different cases in DFXS
reservoirs are shown in Figure 8. The PO
4
3-
concentration increases about 10% and 25%,
respectively when the flow input increase by 20%
and sediment input decrease by 20%. The PO
4
3-
concentration decreases about 8% and 20%,
respectively when the flow input decrease by 20%
and sediment input increase by 20%. The PP
concentration increases about 12% and 35%,
respectively when the flow input increase by 20%
and sediment input decrease by 20%. The PP
concentration decreases about 15% and 30%,
respectively when the flow input decrease by 20%
and sediment input increase by 20%. The amplitude
of variations of cases with changes of sediment input
(case3 and 4) are larger than those with changes of
flow input (case1 and 2). This further verifies that
the effect of adsorption and desorption of sediment
would play more significant roles in the P
distribution than the diffusion process does.
The constant TP concentration and various PP
and PO
4
3-
concentrations between different study
cases indicate a shift of the P fractions in water. The
proportion of DOP is generally stable between 20-
30%. PP always takes the most proportion among all
cases, although it decreases to 45-50% when the
sediment input decreases by 20%. The absolute
difference of the PO
4
3-
of different cases is not big,
but its relative changes are significant. Its proportion
is nearly twice as much as the original when the
sediment input decrease by 20%. This shift of the
constitution of the P would bring some potential
water quality problems. The construction of dams in
the Yangtze basin, especially the Three Gorges dam
completed in 2003, decreased the sediment input to
the estuary from nearly 480 Mt/a in the 1950s to less
than 150 Mt/a in the 2010s (Chen et al., 2010). The
construction of dams will continue during the next
few decades (Chen et al., 2010). This will keep
decreasing the sediment input and increasing the
proportion of PO
4
3-
. The government has taken
action to reduce the nutrients fluxes into the estuary
in recent years. Although the TP concentration has
decreased, PO
4
3-
concentration would stay at a high
level or even increase because of the increase of its
proportion. In the geochemical circulation of P,
PO
4
3-
is the only fraction that can be directly taken
by the food web, like algae (Meybeck, 1982). Thus,
the high concentration of PO
4
3-
would still keep the
water eutrophicated.
Figure 8: The annual average proportion of PP, DOP, and
PO
4
3-
among TP of different cases in DFXS reservoir.
4 CONCLUSION
Because of human activities and global climate
change, the flow and sediment input from upstream
to the Yangtze estuary change a lot, which brings
about the variation of P loadings and some potential
water quality problems. An integrated water quality
model was established with Delft3d to study the P
distribution in 2018 in the south branch of the
Yangtze estuary and its possible changes in the
future in response to variations of runoff and
0.00
0.01
0.02
0.03
0.04
0.05
PO
4
3-
(mg/L)
origin
case1
case2
case3
case4
Dec
Nov
Oct
Sep
Aug
Jul
Jun
May
AplMarFeb
Month
Jan
origin case1 case2 case3 case4
0.00
0.04
0.08
0.12
0.16
0.20
Concentration (mg/L)
TP
PP
PO
4
3-
origin case1 case2 case3 case4
0
10
20
30
40
50
60
70
80
90
100
Percentage (%)
PO
4
3-
DOP
PP
WRE 2021 - The International Conference on Water Resource and Environment
186

sediment loads from upstream. The general
conclusions are as follow:
(a) In 2018, the average TP concentration is
around 0.15 mg/L, but it can reach over 0.2 mg/L in
October. The particle P fractions took the largest
proportion (over 60%), while the PO
4
3-
occupied the
least proportion (around 10%). The P concentration
in the south branch in the dry season is higher than
that in the flood season.
(b) Both PP and PO
4
3-
concentrations change
with the changes of flow and sediment input, which
brings about the reconstitution of the component of
TP in the south branch. When the flow input
increases or the sediment input decreases, the PP
concentration would increase and PO
4
3-
concentration would decrease. When the flow input
decreases or the sediment input increases, the PP
concentration would decrease and PO
4
3-
concentration would increase.
(c) The diffusion process and adsorption and
desorption of sediment are the main processes
controlling the response of P to the upstream runoff
and sediment load variations. The adsorption and
desorption would play a more significant role than
the diffusion process does.
ACKNOWLEDGEMENTS
This work was partly supported by the National
Natural Science Foundation of China (51620105005,
51979076) and the Fundamental Research Funds for
the Central Universities of China (Grant No.
B200202057, B200204017).
REFERENCES
Babu, C. P., & Nath, B. N. (2005). Processes controlling
forms of phosphorus in surficial sediments from the
eastern Arabian Sea impinged by varying bottom
water oxygenation conditions. Deep Sea Research, 14,
1965-1980.
Bowie, G. L., Mills, W. B., Porcella, D. B., Campbell, C.
L., & Chamberlin, C. E. (1985). Rates, Constants, and
Kinetics Formulations in Surface Water Quality
Modeling. USA: Environmental Protection Agency.
Chen, Z., Wang, Z., Finlayson, B., Chen, J., & Yin, D.
(2010). Implications of flow control by the Three
Gorges Dam on sediment and channel dynamics of the
middle Yangtze (Changjiang) River, China. Geology,
11, 1043-1046.
Chu A. (2019). Analysis and Modelling of
Morphodynamics of the Yangtze Estuary. Netherlands:
Delft University of Technology.
Froelich, P. N. (1988). Kinetic Control of Dissolved
Phosphate in Natural Rivers and Estuaries: A Primer
on the Phosphate Buffer Mechanism. Limnology and
Oceanography, 33(4), 649-668.
Goolsby, D. A., Battaglin, W. A., Lawrence, G. B., Artz,
R. S., Aulenbach, B. T., Hooper, R. P., Keeney, D. R.,
& Stensland, G. J. (1999). Flux and Sources of
Nutrients in the Mississippi – Atchafalaya River Basin,
National Ocean Service.
Hilton, J., O'Hare, M., Bowes, M.J., & Jones, J .I. (2006).
How green is my river? A new paradigm of
eutrophication in rivers. Science of Total Environment,
365(1-3), 66-83.
Hou, L. J., Liu, M., Yang, Y., Ou, D.N., Lin, X., Chen, H.,
& Xu, S. Y. (2009). Phosphorus speciation and
availability in intertidal sediments of the Yangtze
Estuary, China. Applied Geochemistry, 1, 120-128.
Ge J., Shi S., Liu J., Xu Yi., Chen C., Richard, B., & Ding
P. (2020). Interannual Variabilities of Nutrients and
Phytoplankton off the Changjiang Estuary in Response
to Changing River Inputs. Journal of Geophysical
Research: Oceans, 125(3), e2019JC015595.
Li, H., Yang, G., Ma, J., Wei, Y., Kang, L., He, Y., & He,
Q. (2019). The role of turbulence in internal
phosphorus release: Turbulence intensity matters.
Environmental Pollution, 252, 84-93.
Li, P. (2012). Variations in estuarine and coastal
suspended sediment concentration and delta
accretion/erosion in response to decline in sediment
supply from the Yangtze River. Shanghai: East China
Normal University.
Liu, L., Zhou, J., Zheng, B., Cai, W., Lin, K., & Tang, J.
(2013). Temporal and spatial distribution of red tide
outbreaks in the Yangtze River Estuary and adjacent
waters, China. Marine Pollution Bulletin, 72(1), 213-
221.
Ludwig, W., Dumont, E., Meybeck, M., & Heussner, S.
(2009). River discharges of water and nutrients to the
Mediterranean and Black Sea: Major drivers for
ecosystem changes during past and future decades?
Progress in Oceanography, 80(3-4), 199-217.
Meybeck, M. (1982). Carbon, nitrogen, and phosphorus
transport by world rivers. American Journal of
Science, 4, 401-450.
Ren S., Zhang B., Wang W., Yuan Y., & Guo C. (2021).
Sedimentation and its response to mangement
strategies of the Three Gorges Reservior, Yangtze
River, China. Catena, 199, 105096.
Sanudo-Wilhelmy, A. B., Kustka, C. J., Gobler, D. A.,
Hutchins, M., Yang, K., Lwiza, J., Burns, D. G.,
Capone, J. A., Raven, E., & Carpenter, J. (2001).
Phosphorus limitation of nitrogen fixation by
Trichodesmium in the central Atlantic Ocean. Nature,
6833, 66-102.
Shen, Z., Zhou, S., & Pei, S. (2008). Transfer and
transport of phosphorus and silica in the turbidity
maximum zone of the Changjiang estuary. Estuarine,
Coastal and Shelf Science, 78(3), 481-492.
Stone, M., & English, M. C. (1993). Geochemical
composition, phosphorus speciation and mass
Response of Phosphorus Near Reservoirs in South Branch of the Yangtze Estuary to the Upstream Runoff and Sediment Load Variations
187

transport of fine-grained sediment in two Lake Erie
tributaries. Hydrobiologia, 253, 17-29.
Tang X., Li R., Han D., & Scholz M. (2020). Response of
Eutrophication Development to Variations in Nutrients
and Hydrological Regime: A case study in the
Changjiang River (Yangtze) Basin. Water, 12(6), 1634.
Wang, B. (2006). Cultural eutrophication in the
Changjiang (Yangtze River) plume: History and
perspective. Estuarine, Coastal and Shelf Science,
69(3), 471-477.
Wang, B., Lu, S., Lin, W., Yang, Y., & Wang, D. (2016).
Water quality model with multiform of N/P transport
and transformation in the Yangtze River Estuary.
Journal of Hydrodynamics, 28(3), 423-430.
Winterwerp, J. C., & van Kesteren, W. G. M. (2004).
Introduction to the Physics of Cohesive Sediment in
the Marine Environment. Elsevier: Developments in
Sedimentology.
Xu, H., Wolanski, E., & Chen, Z. (2013). Suspended
particulate matter affects the nutrient budget of turbid
estuaries: Modification of the LOICZ model and
application to the Yangtze Estuary. Estuarine, Coastal
and Shelf Science, 127, 59-62.
Xu, H., Newton, A., Wolanski, E., & Chen, Z. Y. (2015).
The fate of phosphorus in the Yangtze (Changjiang)
Estuary, China, under multi-stressors: Hindsight and
forecast. Estuarine, Coastal and Shelf Science, 163, 1-
6.
Zhu, Y., Hipsey, M. R., McCowan, A., Beardall, J., &
Cook, P. L. M. (2016). The role of bioirrigation in
sediment phosphorus dynamics and blooms of toxic
cyanobacteria in a temperate lagoon. Environmental
Modelling & Software, 86, 277-304.
WRE 2021 - The International Conference on Water Resource and Environment
188
