
The Release Characteristics of Nutrients from Contaminated
Sediment and Guiding for Dredging Depth
Mingming Wang
1,2,*
, Jun Wei
1
, Xiaowen Pan
1
, Libing Wang
1
and Pengxiao Zhao
1
1
Power China Huadong Engineering Corporation Limited, 311122, Hangzho
u
, China
2
College of Water Science, Beijing Normal University, 100000, Beijing, China
Keywords: Sediment, Release characteristics, Dredging depth
Abstract:
Dredging is an efficient method for removing contaminated sediment, and the release characteristics of
pollutants are important parameters for dredging engineering design. In this paper, the release characteristics
of nutrients from contaminated sediment were examined. The dredging depth was determined by the
adsorption-desorption equilibrium method. In the sedimentation experiment, the suspended sediment needed
72 h to stabilize, and the deeper sediments showed less effective sedimentation,the diaphanetity for 0~20
cm sediment is 16 cm. In the releasing test, the characteristics of NH
4
-N, shown as “L”, was different from
P, which had an extreme concentration. The maximum releasing concentration for P is the layer of 20~40
cm sediment, and that for NH
4
-N is 0~20 cm. The corresponding equilibrium concentration is 0.1 and 0.16
mg/L for P in the static and dynamic station, respectively, and that for NH
4
-N is 2.0 and 3.2 mg/L. On the
basis of the vertical release equilibrium profile and sedimentation test, the dredging depth in this study was
recommended to be 80 ± 5 cm.
1 INTRODUCTION
Contaminated sediment occurs frequently because of
urbanization and industrialization without effective
protection (Polrot et al., 2021; Wang et al., 2018)
Contaminated sediments enrich contaminants to
higher concentration than the background value such
as nutrients, heavy metals, pesticides, fertilizers,
microplastics, and other persistent organic pollutants,
which have severe effect on the water system(Wang
et al., 2020; Zhou et al., 2021). The water quality
degradation and ecological destruction are the direct
consequence. Among these, eutrophication resulting
from the surplus of nutrients (nitrogen and
phosphorus) is one of the problems.
Because of safety concerns and less effect in
harnessing, degradation of water quality and
eutrophication of fresh water lakes have caught
global attention. Generally, the excess input of
nutrients, nitrogen and phosphorus, are regarded as
the main reason (Sondergaard et al., 2017).
However, more studies have verified that
interruption of exogenous input cannot turn around
the degradation, and that endogenous pollution
during the process of eutrophication is the major
reason for the lake problems (Tu et al., 2019).
Among the remediation technologies such in situ
capping, solidification/stabilization, oxidation-
reduction and other ex situ treatment (Wang et al.,
2018), sediment dredging can fundamentally solve
the problem of endogenous pollution (Zhong et al.,
2018) , which is widely accepted in water
environment treatment, but the relevant engineering
and design need to mature according to the specific
situation. In most case, ex situ remediation is the
first choice in many restoration projects because of
the severity of the pollution and doubts that in situ
remediation methods can provide stable results over
the long-term. However, in the lower level of
pollution area or deeper site, in situ treatments is
alternative.
Shitang (ST) Lake, a typical inland lake located
at the edge of a city, functions in climate regulation
and landscape. In years of high speed economic
development, the breeding industry both for fish and
poultry has been permitted in and around the lake.
Consequently, bait, fodder, and excrement have been
inputted into lake system, and then the pollutants
were gradually have been enriched in the sediment,
this resulted in endogenous pollution (Wang et al.,
2021). Hence, on the basis of exogenous control,
endogenous removal is necessary and benefits
164
Wang, M., Wei, J., Pan, X., Wang, L. and Zhao, P.
The Release Characteristics of Nutrients from Contaminated Sediment and Guiding for Dredging Depth.
In Proceedings of the 7th International Conference on Water Resource and Environment (WRE 2021), pages 164-170
ISBN: 978-989-758-560-9; ISSN: 1755-1315
Copyright
c
2022 by SCITEPRESS – Science and Technology Publications, Lda. All rights reserved
processes for lake ecotopic recovery.
Dredging is an efficient method for removing
contaminated sediment, but how to decide the
dredging depth is always controversial (Wang et al.,
2021). According to the adsorption-desorption
equilibrium method, this study examined the release
characteristics of pollutants in different stations. The
dredging depth was confirmed from the point of
controlling pollutants and the objective of water
quality. The method and result can be consulted by
some related engineering.
2 SAMPLE COLLECTION AND
STUDY METHOD
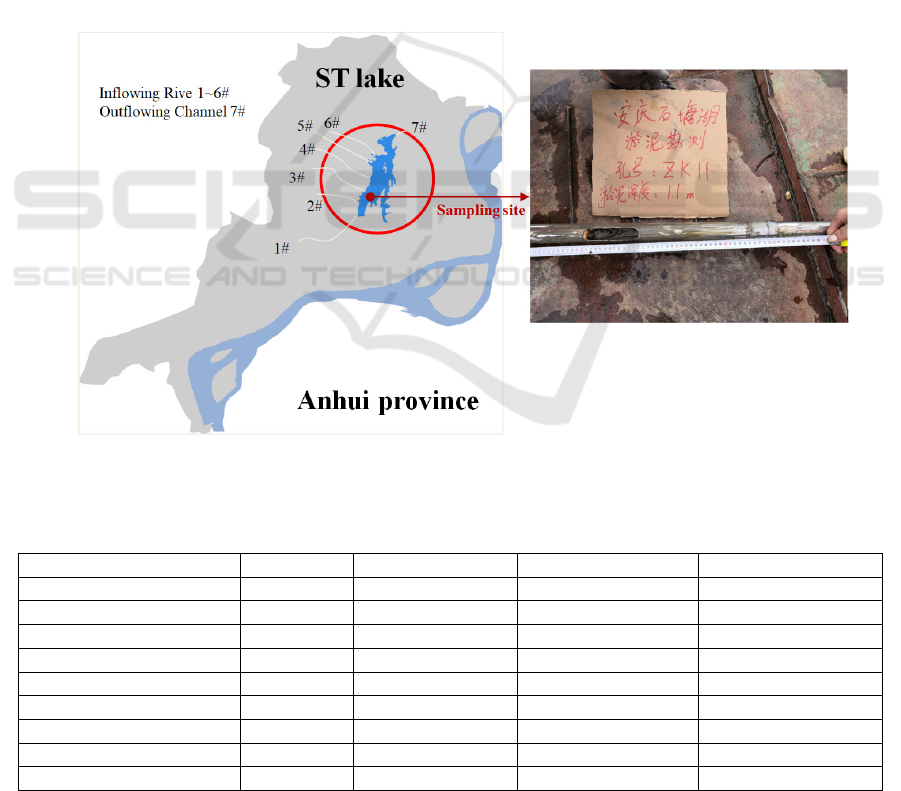
2.1 Site Description
ST Lake is located in Anqin Province, a city at the
lower reaches of the Yangtze River. This lake was
investigated because of its function zoning, which is
a standby source of drinking water. Its water quality
is becoming worse, and the water quality goal is the
National Standard for Surface Water (GB3838-2002)
Class III (NSSW-III). There are 6 rivers flowing into
lake and only 1 flowing channel out of lake (Figure
1), related water qualities are shown in Table 1.
According to previous evaluation, the lake is
moderate eutrophication and situation is getting
worse. Moreover, the sediment deposition in the
south of the lake is more serious than north, reaching
more than 100 cm. The dredging engineering thus
mainly focused on this area, and corresponding
sediment is sampled in this site to study the release
characteristics of nutrients from contaminated
sediment and guide for dredging depth.
Figure 1: Investigation site and sampling exhibition.
Table 1: Rivers and lake water quality.
Site
pH TP (mg/L) NH
3
-N (mg/L) TOC (mg/L)
NSSW-III
6~9 0.05 1.0 -
1#
8.8 0.12 0.42 11.3
2#
8.5 0.10 0.63 14.7
3#
8.9 0.10 0.64 9.8
4#
8.8 0.17 0.58 15.5
5#
8.9 0.12 0.52 12.4
6#
8.8 0.11 0.39 25.6
7#
8.9 0.14 0.59 15.2
Sediment Sampling Site
8.9 0.14 0.461 7.7
Note: 1~6# is 6 inflowing river and water sample is collected at estuary, 7# is outflowing channel and water sample is
collected at the head of the channel.
The Release Characteristics of Nutrients from Contaminated Sediment and Guiding for Dredging Depth
165
2.2 Sediment Collection
Two sites in the serious deposition area
(approximately 1.1 m) were decided for sediment
collection according to the lake district survey data.
The sediment from the surface layer to the depth of 1
m were equally divided into five layers (0-20 cm,
20-40 cm, 40-60 cm, 60-80 cm, and 80-100 cm),
collected by a cylindrical sampler, sealed, and
transported to the laboratory.
2.3 Experiment and Analytical Method
2.3.1 Settleability Testing
The mixture sediment (1 g, dry weight) was
transferred into a 1,000 mL graduated cylinder, and
water was added up to the scale mark. The settling
times were 0, 12, 24, 36, 48, and 72 h, and we
recorded the process of settling. Moreover, five
different layer sediments (0.1 g, dry weight) were
placed into respective 500 mL beakers, and 500 mL
of water was added. After standing for 48 h, the
sedimentation effect was recorded. The settleability
was determined by diaphaneity according to disk
method.
2.3.2 Static Releasing
In order to simulate the pollutant release
characteristics of the different layer sediments, five
different layer sediments were blended with water at
a ratio of 1:10 in consideration of both the ratio of
water and sediment in the lake and the effect of the
hinge suction method. The mixture was fully stirred
by magnetic stirrers for 2 min at indoor temperature
(23±2 ℃). After standing for 7 days, the
concentration variations of TP and NH
4
-N and
solution pH were recorded.
2.3.3 Dynamic Release
In order to simulate the pollutant release
characteristics of the hinge suction process and to
evaluate the maximum release capacity, five
different layer sediments were blended with water at
a ratio of 1:10, and stirred by magnetic stirrers. We
then recorded the TP and NH
4
-N concentrations of
the liquor at 2, 4, 6, 8, 12, 24, 36 and 48 h and
solution pH.
2.3.4 Analytical Method
In this study, all solution TP and NH
4
-N are
measured by persulfate digestion and Nessler’s
reagent method, respectively.
3 RESULTS
3.1 Settleability of the Sediment
Sediment settleability is one of the important
properties for dredging engineering (Polrot et al.,
2021). After the sediment and water mixture was
dredged and transported to land, its settleability
parameter was used to decide the scale of sediment
treatment plant especially for pretreatment such as
preliminary precipitation (Smith et al., 2009). As
shown in Table 2 and Figure 2, the diaphaneity of
sedimentation process was clearly recorded from 0
to 72 h, in which the higher value of diaphaneity
means better settleability. At the beginning (<12 h),
the sedimentation process and layer separation was
not obvious, the diaphaneity was only 0.3 cm. At 24
h, layer separation and the muddy water interface
could be observed clearly. After that, the liquid
supernatant became more limpid. Until 72 h, the
diaphaneity of the liquid supernatant is 12 cm that
was unchanged and showed no difference with 48 h;
thus, the optimum precipitation time was determined
to be 48 h.
Table 2: The diaphanetity of the mixture sediment at different standing time point and different layer sediments after
standing 48 hours.
Mixture sediment Diaphaneity Different layer sediment Diaphaneity
0 hour 0 cm Original state 0 cm
12 hour 0.3 cm 0~20 cm 16 cm
24 hour 2 cm 20~40 cm 12 cm
36 hour 6 cm 40~60 cm 7 cm
48 hour 12 cm 60~80 cm 5 cm
72 hour 12 cm 80~100 cm 4 cm
WRE 2021 - The International Conference on Water Resource and Environment
166
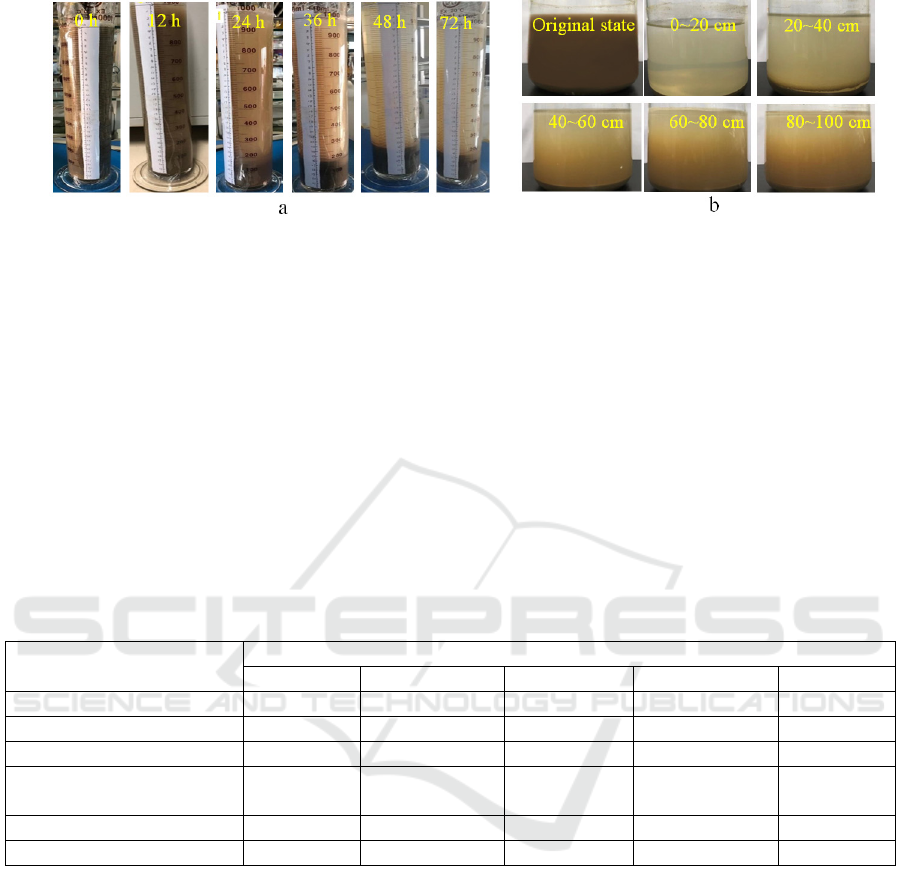
Figure 2: The sedimentation of the mixture sediment from 0 to 72 h (a) and sedimentation efficiency of different layer
sediments from 0 to 100 cm (b).
The settleability of the different layer sediments
in another test is also shown in Table 2. After 48 h
static settlement, there was an obvious difference
between the superficial-layer (0-40 cm) and
deeper-layer (40-100 cm) sediments. The deeper the
sediment was, the worse was the sedimentation
efficiency. In the upper layer (0-40 cm), the water
can become clarifying, and the diaphaneity is ≥12
cm . But at deeper layers, the sediment stays almost
suspended, the diaphaneity from 60 cm to 80 cm is
≤4 cm. The settling property is the most important
parameter that decides the dosage of flocculating
agent in the process of sediment treatment, as well as
the water-body turbidity or the water environment
recovery efficiency after dredging (Li et al., 2021).
Moreover, the settling property of the sediment
controlled by many sides included particle size,
particle concentration, particle charge, disturbance,
and so forth (Wang et al., 2020). Among these
aspects, particle size is a deciding factor. As shown
in Table 3, the difference in size distribution of the
different layer sediments is clear. The 0-20 cm layer
contained lower content of clay particles, which
suggests better setting property and vice versa.
Table 3: The size distribution of different layer sediments.
Size distribution
De
p
th
(
cm
)
0-20 20-40 40-60 60-80 80-100
Cla
y
p
article
(
<0.005 mm
)
18 24 43 41.9 53
Silt
(
0.075
–
0.005 mm
)
76.5 51.3 52.3 53.5 42.3
Fine
g
ravel
(
0.25
–
0.075 mm
)
5.5 13.7 4.7 4.6 4.7
Medium sand (0.5–0.0.25
mm
)
0 6.3 0 0 0
Coral san
d
(
2
–
0.5 mm
)
0 3.8 0 0 0
Gravel
(
10
–
2 mm
)
0 0.9 0 0 0
3.2 Release Characteristics of P
The release characteristics of P from different layer
sediments in the static and dynamic states are shown
in Figure 3. The release characteristics of P from
different layer sediments were similar both in the
static and dynamic tests, as well as pH value that is
8-9 in all test solution. The concentration of P
increased for a certain period and then decreased
until equilibrium. Other study also concluded that
disturbance can make pollutants increase in water for
a period of time and then decrease to the initial state
resulting from desorption and adsorption. However,
in Hu’s study this phenomenon also found in release
characteristics of COD and TN instead of TP (Hu et
al., 2021). The released amounts were different for
various sediment layers. The release capacities for
the 20-40 cm and 80-100 cm layers were the
maximum and minimum, respectively. The highest
concentration was 0.18 mg/L at the first day in static
test and was almost equal to the dynamic, but the
dynamic concentrations were higher than the static
concentrations for any sediment layer in equilibrium
station that is similar with other study. In the static
test, the equilibration time and the equilibration
concentration were about 3 day and 0.10 mg/L,
respectively, and those in the dynamic test were 12 h
and 0.16 mg/L, respectively. The equilibration in the
static test showed less reaction time related to the
dynamic test.
The Release Characteristics of Nutrients from Contaminated Sediment and Guiding for Dredging Depth
167
Figure 3: The static (a) and dynamic (b) release of P from different depths of contaminated sediment.
Figure 4: The static (a) and dynamic (b) release of NH4-N from different depths of contaminated sediment.
3.3 Release Characteristics of NH
4
-N
The release characteristics of NH
4
-N from different
layer sediments in the static and dynamic states are
shown in Figure 4. All layer sediments for NH
4
-N
release characteristics were similar to those of P in
general. The release process of NH
4
-N is shown as
“L” as well as other studies (Hu et al., 2021; Pan et
al., 2019). Unlike P, the release capacity of NH
4
-N
for the 0-20 cm and 80-100 cm layers were the
maximum and minimum, respectively. The
equilibrium concentration was 0.2 mg/L on the first
day in the static test; this concentration was lower
than that in the dynamic test. Moreover, in the static
test, the 60-80 cm and 80-100 cm layers barely
released NH
4
-N into the water. However, intense
disturbance can promote nitrification resulting in the
decrease of NH
4
-N, and this phenomenon has no
appeared in this study (Pan et al., 2019), in which
NH
4
-N concentration has no decline with time.
4 DISCUSSION
The design of dredging depth is an important part in
dredging engineering (Bianchini et al., 2019).
Normally, the process of adsorption and release is
balanceable between the interfaces of water and
sediment (Horppila, 2019). When dredging
engineering is conducted, the balance is broken, the
sub-layer sediment is exposed to water, and the
unstable pollutants can be released from the
sediment to the water. However, this process of
pollutant release is almost static after dredging from
01234567
0.00
0.05
0.10
0.15
0.20
0.25
Stable point
Concentration
(
mg/L
)
Releasin
g
time
(
da
y
)
NSSW-III limitation
a
0~20cm 20~40cm 40~60cm 60~80cm 80~100c
m
0 1020304050
5
0
5
0
5
Stable point
()
Releasing time hour
NSSW-III limitation
b
0~20cm 20~40cm 40~60cm 60~80cm 80~100c
m
01234567
0.0
0.5
1.0
1.5
2.0
2.5
3.0
3.5
4.0
Stable point
Concentration
(
mg/L
)
()
Releasing time day
NSSW-III limitation
a
0 1020304050
NSSW-III limitation
Stable point
()
Releasing hour
b
WRE 2021 - The International Conference on Water Resource and Environment
168
sediment. The release equilibrium of P and NH
4
-N at
different depths of contaminated sediment in static
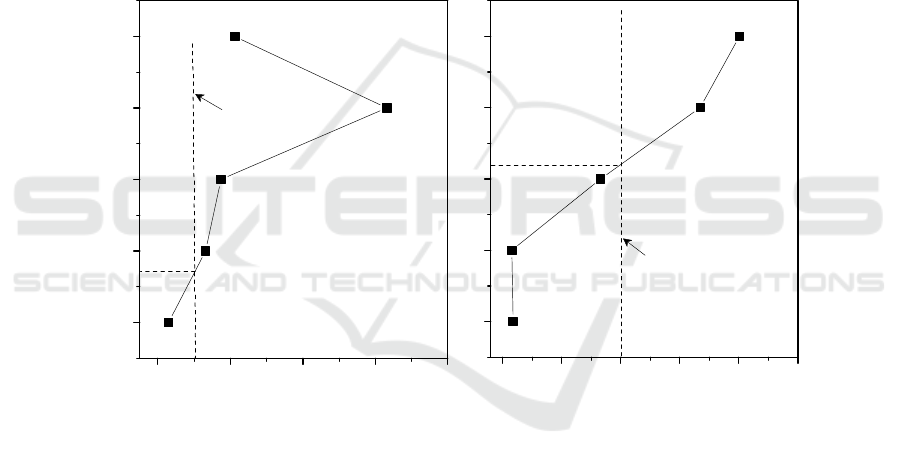
are shown in Figure 5. According to bathmometry,
the dredging depth was about 60 cm for P, and that
for NH
4
-N was 80 cm. Moreover, taking the
NSSW-III into consideration, which was 0.05 mg/L
for P and 1.0 for NH
4
-N, the dredging depth needed
to be designed as 85 cm for P and 56 cm for NH
4
-N.
The recovery of transparency in the water system
and mud-water mixture also needed to be taken into
consideration. According to our experiment results,
the deeper sediments had less effective
sedimentation, which meant deeper dredging needs
more time to recover transparency in the water
system, as well as more time and more coagulant to
pretreat the mud-water mixture in a sediment
treatment plant (Wang et al., 2020). Moreover,
dredging more sediment from the water system to
land increased the comprehensive cost, and there
were studies also indicating that dredging deep was
not positive correlated with water quality recovery
and ecology restoration (Wasserman et al., 2016;
Zhang et al., 2010). Overall, the dredging depth was
designed as 80 ± 5 cm under the cost control and
goal control.
However, dredging is just one method of
remediation water environment. In order to recover
water sysem’s ecological function effectively, other
projects also need to be conducted such as
controlling area source pollution, harnessing sewage
outlet, protecting inflowing river water quality and
so on. Besides, ecological remediation under water is
necessary to keep a long-term benefit for water
system following dredging engineering.
Figure 5: The release equilibrium of P (a) and NH4-N (b) at different depths of contaminated sediment.
REFERENCES
Bianchini, A., Cento, F., Guzzini, A., Pellegrini, M., &
Saccani, C. (2019). Sediment management in coastal
infrastructures: Techno-economic and environmental
impact assessment of alternative technologies to
dredging. Journal of Environmental Management, 248,
1-17.
Horppila, J. (2019). Sediment nutrients, ecological status
and restoration of lakes. Water Research, 160(1),
206-208.
Hu, M., Liu, X., & Xue, J. (2021). Water depth and
disturbance impact on pollutants release from sediment
in Beiyun River. Acta Scientiae Circumstantiae, 41(1),
174-180.
Li, J., He, X., Wei, J., Bao, Y., Tang, Q., Nambajimana, J.,
Nsabimana, G., & Khurram, D. (2021). Multifractal
features of the particle-size distribution of suspended
sediment in the Three Gorges Reservoir, China.
International Journal of sediment Research, 36(4),
489-500.
Pan, T., Qi, J., & Wu, Q. (2019). Release law of nitrogen
and phosphorus pollutants in sediments of Beiyun
River Basin. Environmental Monitoring in China,
35(1), 51-58.
Polrot, A., Kirby, J. R., Birkett, J. W., & Sharples, G. P.
(2021). Combining sediment management and
bioremediation in muddy ports and harbours: A
review. Environmental Pollution, 289(1), 1-11.
0.0 0.5 1.0 1.5 2.0 2.5
NH
4
-N
()
Concentratio
n
m
g
/L
NSSW-III
()
1.0 , 56
b
0.04 0.06 0.08 0.10 0.12
-100
-80
-60
-40
-20
P
Depth
(
cm
)
()
Concentration mg/L
NSSW-III
(,)
0.05 85
a
The Release Characteristics of Nutrients from Contaminated Sediment and Guiding for Dredging Depth
169

Sondergaard, M., Lauridsen, T. L., Johansson, L. S., &
Jeppesen, E. (2017). Nitrogen or phosphorus limitation
in lakes and its impact on phytoplankton biomass and
submerged macrophyte cover. Hydrobiologia, 795(1),
35-48.
Smith, K. E., Banks, M. K., & Schwab, A. P. (2009).
Dewatering of contaminated sediments: Greenhouse
and field studies. Ecological Engineering, 35(10),
1523-1528.
Tu, L., Jarosch, K. A., Schneider, T., & Grosjean, M.
(2019). Phosphorus fractions in sediments and their
relevance for historical lake eutrophication in the
Ponte Tresa basin (Lake Lugano, Switzerland) since
1959. The Science of the Total Environment, 685(1),
806-817.
Wang, L., Shao, Y., Zhao, Z., Chen, S., & Shao, X.
(2020). Optimized utilization studies of dredging
sediment for making water treatment ceramsite based
on an extreme vertex design. Journal of Water Process
Engineering, 38(1), 1-11.
Wang, M., Zhu, Y., Cheng, L., Andserson, B., Zhao, X.,
Wang, D., & Ding, A. (2018). Review on utilization of
biochar for metal-contaminated soil and sediment
remediation, Journal of Environmental Sciences, 63(1),
156-173.
Wang, Q., Liao, Z., Yao, D., Yang, Z., Wu, Y., & Tang, C.
(2021). Phosphorus immobilization in water and
sediment using iron-based materials: A review.
Science of The Total Environment, 767, 144-246.
Wasserman, J. C, Wasserman, M. A. V., Barrocas, P. R.
G., & Almeida, A. M. (2016). Predicting pollutant
concentrations in the water column during dredging
operations: Implications for sediment quality criteria.
Marine Pollution Bulletin, 108(1), 24-32.
Zhang, S., Zhou, Q, Xu, D., Lin, J., Cheng, S., & Wu, Z.
(2010). Effects of sediment dredging on water quality
and zooplankton community structure in a shallow of
eutrophic lake. Journal of Environmental Sciences,
22(2), 218-224.
Zhong, J. C., Yu, J H., Zheng, X. L., Wen, S. L., Liu, D.
H., & Fan, C. X. (2018). Effects of Dredging Season
on Sediment Properties and Nutrient Fluxes across the
Sediment–Water Interface in Meiliang Bay of Lake
Taihu, China. Water, 10(11), 23-35.
Zhou, Z., Zhang, P., Zhang, G., Wang, S., Cai, Y., &
Wang, H. (2021). Vertical microplastic distribution in
sediments of Fuhe River estuary to Baiyangdian
Wetland in Northern China. Chemosphere, 280(1),
1-9.
WRE 2021 - The International Conference on Water Resource and Environment
170
