
Heavy Metal Pollution Assessment in the Sediment of Rao River,
China using the Geo-accumulation Vector
Bao Qian
1,*
, Zhe Wang
2
and Feng Yan
3
1
Bureau of Hydrology, Changjiang Water Resources Commission, CWRC, Wuhan 430010, China
2
Hydrology Bureau of Haihe River Water Conservancy Commission, the Ministry of Water Resources,
Tianjin 300170, China
3
School of Civil Engineering and Architecture, Nanchang University, Nanchang 330031, China
Keywords:
Heavy metal, Geo-accumulation vector, Sediment, Rao River
Abstract: The heavy metal plays an significant role in the sediment pollution of the river. However, for the
heterogeneity of mineral composition, the background values of elements in sediment often contains
uncertainties, which is hard to be treated by the conventional geo-accumulation index. In the present work,
the geo-accumulation vector is introduced to deal with the uncertainty of background value and evaluate the
pollution of heavy metal in the sediment of Rao River, China. The results show that: the order of pollution
degree is: source < upper reaches < estuary < lower reaches < middle reaches. Dexing City, Poyang City
and Jingdezhen City are the most polluted area along Rao River, which respectively belong to “moderately
to heavily contaminated”, “moderately to heavily contaminated”, and “moderately contaminated” grades,
and respectively have risk probabilities of 28%, 8% and 40% to deteriorate. The mean values of the
elements in global shale should not be used as the background values of Rao River. Otherwise, the
evaluation results of Cu and Cd may be overoptimistic. Compared with the conventional method, the
geo-accumulation vector has apparent advantages in dealing with the uncertainty of background values and
the recognizing the cross-grade risk.
1 INTRODUCTION
Heavy metal is among the most common river
pollutants that are teratogenic and hard to degrade
(Xu et al., 2018; Peng et al., 2014). Heavy metal
adsorbs onto sediment particles, and its density is
greater than that of liquid (Peng et al., 2014; Yan et
al., 2018). Thus, the heavy metal load in water
environment is easily to be deposited into sediment
(Peng et al., 2014; Yan et al., 2018). When the
physicochemical environment in water–soil interface
is changed, heavy metal could be released into water
environment and result in secondary pollution (Yan
et al., 2018; Yan et al., 2019a; Yuan et al., 2015). In
addition, heavy metal can also be absorbed by
submerged macrophyte and benthos and then injure
human health by enrichment in food chain (Yan et al.,
2018; Yan et al., 2019b; Yuan et al., 2015). To sum
up, the heavy metal pollution assessment in the
sediment is among the constant research endeavors in
river water environment protection.
To assess the pollution of heavy metal in the
sediment, Muller (1969) put forward
geo-accumulation index model, which determined the
pollution degree of heavy metal quantization by
synthesizing measured and background value
information (Shi et al., 2009). Geo-accumulation
index is widely used globally to evaluate heavy metal
sediment. For example, Pathak et al. (2013) used the
geo-accumulation index to study the metal content of
surface sediment of an industrial area adjoining
Delhi, India. Zhang et al. applied geo-accumulation
index to qualify the heavy metal pollution in ediments
of Yangtze River (Zhang et al., 2009). Additionally,
Men et al. (2018) used geo-accumulation index to
assess the pollution of heavy metal in Beijing, China.
The conventional geo-accumulation index
considers the background value of the heavy metal to
be definite and unique, and often used the mean value
of the element in global shale as the background
information (Matschullat et al., 2000; Snežana et al.,
2017). However, recent study suggests that this
hypothesis does not seem to be reasonable.
140
Qian, B., Wang, Z. and Yan, F.
Heavy Metal Pollution Assessment in the Sediment of Rao River, China using the Geo-accumulation Vector.
In Proceedings of the 7th International Conference on Water Resource and Environment (WRE 2021), pages 140-150
ISBN: 978-989-758-560-9; ISSN: 1755-1315
Copyright
c
2022 by SCITEPRESS – Science and Technology Publications, Lda. All rights reserved
Matschullat showed that the inhomogeneity of
sediment mineral distribution results in great
deference between local area heavy metal
background and whole global element averages
(Matschullat et al., 2000). Furthermore, Snežana
found that background investigation, such as core
acquisition or statistical distribution selection, is
always random (Snežana et al., 2017). This behavior
leads to a degree of uncertainty in the heavy metals
background value, which may significantly affect the
application of geo-accumulation index.
Based on statistics principle, Yan et al. improved
proposed geo-accumulation vector model to solve the
background value uncertainty (Yan et al., 2019a).
Heavy metal background is no longer treated as a
fixed value but as a random variable in
geo-accumulation vector (Yan et al., 2019c).
Accordingly, evaluation result is not a unique value,
but the probability of pollution status belongs to each
level. Geo-accumulation vector was preliminary
applied on heavy metal sediment evaluation in West
Dongting, which had apparent advantages in rank
evaluation and risk factor identification.
The Rao River flows through the Dexing Copper
Mine, which is the biggest copper mine in Asia (Ma
et al., 2015). Rao River is one of the most
heavy-metal polluted rivers in China (Zhang et al.,
1995). However, the background value uncertainty
greatly affected the results of heavy metal pollution
evaluation in Rao River. The objectives of this study
are: (i) assessing the pollution status of heavy metal
in the sediment of Rao River based on the
geo-accumulation vector model; (ii) identifying the
risk factor and pollution source of each segment of
Rao River; and (iii) further discussing the differences
between geo-accumulation index and
geo-accumulation vector in environmental
assessment.
2 MATERIALS AND METHODS
2.1 Study Area and Methods of
Chemical Analysis
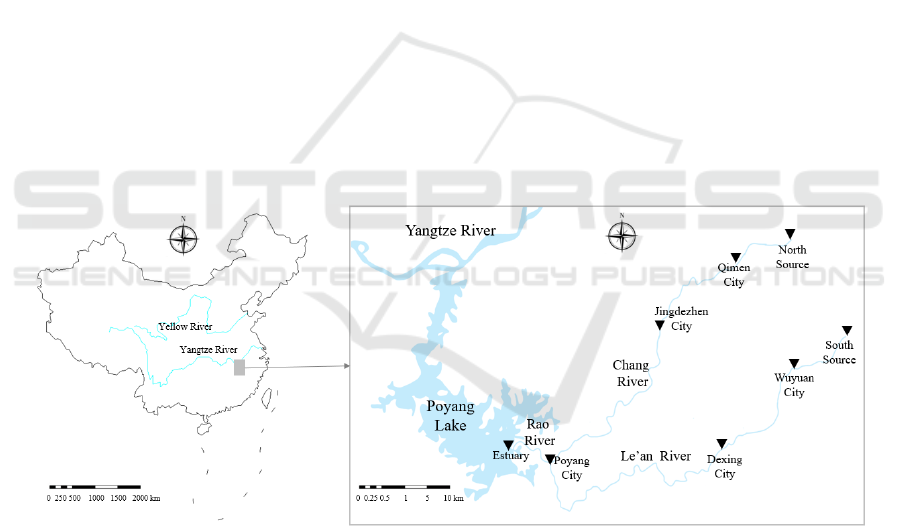
As shown in Figure 1, Rao River is located in central
China. With an annual runoff of 10.7 billion m
3
, Rao
River covers a drainage area of 14,367 kilometers
(Ma et al., 2015; Zhang, 1995). Rao River has two
sources, the northern and southern of which are
Chang River and Le’an River, respectively. Rao
River flows into Poyang Lake, the largest freshwater
lake of China.
Figure 1: Location of the study area (Filled reverse triangles represent the sampling point).
The land types and economic structure of the cities
along the Rao River are quite different. In the upper
reaches of Rao River, which majorly contains Qimen
City and Wuyuan City, the mountainous proportion
exceeds 85%. As a result, the prime economic
structure is tourism. The middle reaches of Rao River
lies in the mountain-to-plain transitional zone, which
contains abundant mineral resources. The prime
economic types are therefore industry and mining.
For example, Jingdezhen City is famous for its
ceramic industry in the world; and Dexing City has
the largest opencast copper mine in Asia. The lower
reaches Rao River lies in the Poyang City, the land
type of which is plain, and the prime economic type is
agriculture.
According to Yan et al., the main pollutants in the
Rao river basin are copper (Cu), lead (Pb), and
cadmium (Cd) (Yan et al., 2018). Therefore, these
three indexes are selected for evaluation in this study.
To accurately reflect the heavy metal pollution of the
Heavy Metal Pollution Assessment in the Sediment of Rao River, China using the Geo-accumulation Vector
141

river, eight sampling sites were set up in Rao River,
as illustrated in Figure 1. Because of the
inhomogeneous geological condition of the sediment
in Rao River, the geochemical backgrounds of the
heavy metals are uncertain intervals instead of
concrete values. According to Zhang., the
geochemical background of Cu, Pb, and Cd are 14.16
mg/kg-41.97 mg/kg, 13.36 mg/kg-29.38mg/kg, and
0.065 mg/kg-0.257 mg/kg, respectively (Zhang et al.,
1995).
The sampling, pretreating, digesting, and
measuring methods refer to the Chinese Soil
Environmental Quality Risk Control Standard for
Soil Contamination of Agricultural Land (Ministry of
Ecological and Environment of the People’s Republic
of China, 2018). On 14 December 2019, three parallel
samples were collected from each site, which were
conserved in clean polyethylene bags and sent to the
Bureau of Hydrology, Changjiang Water Resources
Commission for further analysis. The sediment was
first screened through a 1 mm sieve and then
naturally air dried. The samples were ground in an
agate mortar (SP-40, Shanghai Shupei Corporation,
China) and then homogenized and sieved through a
100 μm mesh. After that, 0.5 g samples were digested
in a microwave oven (CEM MARS, PyNN
Corporation, USA) with an acid mixture (9 mL of
14.0 M HNO
3
, 3 mL of 11.7 M HCl, 2 mL of
23.0 M HF, and 2.5 mL of 8.8 H
2
O
2
). The samples
were then condensed to 1–2 mL for total metal
analysis.
There were two experimental instrument to make
environmental monitoring: the graphite furnace
atomic absorption spectrophotometry (ICE3500,
Thermofisher Corporation, USA), and the flame
atomic absorption spectrophotometry (SK-2003,
Persee Corporation, China). Compared with the flame
atomic absorption spectrophotometry, the graphite
furnace atomic absorption spectrophotometry had a
higher sensitivity, but a lower repeatability. As a
result, the graphite furnace atomic absorption
spectrophotometry was used to use to measure Cd,
the concentration of which was relatively lower;
while the flame atomic absorption spectrophotometry
was used to use to measure Cu and Pb, the
concentration of which were relatively higher.
The GSS-7 reference material from the Chinese
Environmental Monitoring Center was used to ensure
quality, where “GSS-7” was the number of the red
soil area in South China. The parallel errors were
controlled within 10%, and their average value of
three parallel samples was selected as the
concentration data to be evaluated.
2.2 Geo-accumulation Index
If M heavy metals are provided to participate in the
evaluation, the background and measured values of
the mth are b
m
and c
m
, respectively. Then the
geo-accumulation index of the mth heavy metals is
calculated as follows:
(1)
According to the value of I
m
, the pollution status of
heavy metal m can be classified into the following
categories: uncontaminated (I
m
≤0), uncontaminated
to moderately contaminated (0<I
m
≤1), moderately
contaminated (1<I
m
≤2), moderately to heavily
contaminated (2<I
m
≤3), heavily contaminated
(3<I
m
≤4), heavily to extremely contaminated
(4<I
m
≤5) and extremely contaminated (I
m
>5) (Ke et
al., 2017; Maanan et al., 2017).
In existing literature, the following methods are
used to select background values: (i) using the mean
value of the element in global shale as the background
information and (ii) using geochemistry investigation
of the deep core in the evaluation area as the
background information (Matschullat et al., 2000;
Snežana et al., 2017).
Although the background values determined by
method (i) are unique, certain differences in
background values exist between the global scale and
the evaluation area locally because of the
inhomogeneity of the continental geological structure
with the mineral composition (Matschullat et al.,
2000; Snežana et al., 2017). The results obtained
from the method (ii) can approximately reflect the
original status of heavy metals in the region.
However, because of the randomness of core
sampling and the selection of statistical distribution,
the background values of heavy metals in sediment
are generally not exact values but uncertain interval
b
m
∈[l
m
, s
m
] (Snežana et al., 2017). In addition, the
traditional geo-accumulation index experiences
difficulty dealing with the problem of heavy metal
pollution evaluation due to the uncertainty of
background values.
2.3 Geo-accumulation Vector
In contrast to the traditional geo-accumulation index
model, the ground accumulation vector model uses
vector P
m
={p
1m
,p
2m
,…,p
7m
} to reflect the pollution
condition, where p
jm
is the probability of the
2
log
1.5
m
m
m
c
I
b
WRE 2021 - The International Conference on Water Resource and Environment
142

pollution of the mth heavy metal belongs to grade j
(Yan et al., 2019b).
The universal calculation method can be derived
as follows (Yan et al., 2019c):
For grade 1:
(2)
for j =2,3... 6:
3
2
32
2
23
32
(2log 1) = ()
1.5 3 2 3 2
m
j
m
m
j
c
mmm
jm mmm
jj
c
m
b
ccc
ppj j p b fbdb
b
(3)
and for grade 7:
(4)
In Eq. (2) to Eq. (4), f(b
m
) is the probability
density function of b
m
, which can be generally
calculated according to the statistical characteristics
of the measured values of the core elements (Yan et
al., 2019b). When investigation information is not
enough to determine the approximate distribution of
b
m
,Yan et al. proved that the uniform distribution
U(l
m
, s
m
) is the most likely distribution of f(b
m
) at this
time based on the maximum entropy principle (Yan
et al., 2019b).
In this case, the calculation method of p
jm
is as
follows:
For grade 1:
(5)
for j =2,3... 6:
23
2
23
3
23
32
23
23
22
1
33
2/3
22
33
2/3
22
33
2/3 2/3
22
33
22
0Or
33
j
j
mm
mm
j
j
j
mm
mm
mm
mm
j
jj
mm
mm
jm
mm
mm
jj
jj
mm
mm
mm
mm
j
j
mm
mm
cc
ls
sc
cc
ls
sl
cl
cc
p
ls
sl
cc
cc
ls
sl
cc
sl
(6)
and grade 7:
(7)
Using first-order moment principle for grade
recognition, the pollution feature value of
P
m
is
defined as follows:
7
1
(1.5)
mjm
j
Epj
(8)
When Eq. (9) is established,
P
m
belongs to grade
k:
21
m
kEk
. (9)
The risk degree r
m
is defined as follows:
7
1
mjm
jk
rp
. (10)
Apparently,
r
m
quantifies the probability that P
m
belongs to the grates worse than grade
k considering
the uncertainties in background values.
As mentioned previously, the geo-accumulation
vector
P
m
={p
1m
,p
2m
,…,p
7m
} reflects the probability
that the pollution status of the
mth heavy metal
belongs to each grade (Yan et al., 2019b). To
quantify the comprehensive contamination status of
heavy metals in the study area, Yan et al. further
constructed a comprehensive geo-accumulation
vector
Q={q
1
,q
2
,…,q
7
}, where q
j
reflects the
probability that the comprehensive contamination of
heavy metals in sediments belongs to grade
j (Yan et
al., 2019a). The formula is calculated as follows:
12
1.5
(log 0) ( ) ( )
1.5 1.5
m
m
mm
mmmm
c
m
b
cc
p
ppbfbdb
b
/48
5
72
0
(log 5) ( 2 ) ( ) ( )
1.5 1.5 48
m
m
c
mm m
mmmm
mm
b
cc c
pp p pb fbdb
bb
1
0
1.5
2/3
1.5
1
1.5
m
m
mm
m
mmm
mm
m
m
c
s
sc
c
p
ls
sl
c
l
7
0
48
/48
48
1
48
m
m
mm m
mmm
mm
m
m
c
l
cl c
pls
sl
c
s
Heavy Metal Pollution Assessment in the Sediment of Rao River, China using the Geo-accumulation Vector
143
1
1, 2,....,7
M
jjjm
m
qwpj
, (11)
where w
m
is the weight of the mth heavy metal.
The grade recognition method of Q is similar to
that of P
m
. The coefficient p
jm
in Eq. (8) is just
replaced with q
j
.
Geo-accumulation vector is not a denial to
geo-accumulation index. It expands and deepens the
traditional geo-accumulation index to uncertainty
analysis essentially. Furthermore, to make the
discussion more intuitive, p
jm
, r
m
, and q
j
can also be
represented in forms of percentages (Yan et al.,
2019b).
3 RESULT AND DISCUSSION
3.1 Concentrations of Pollutants
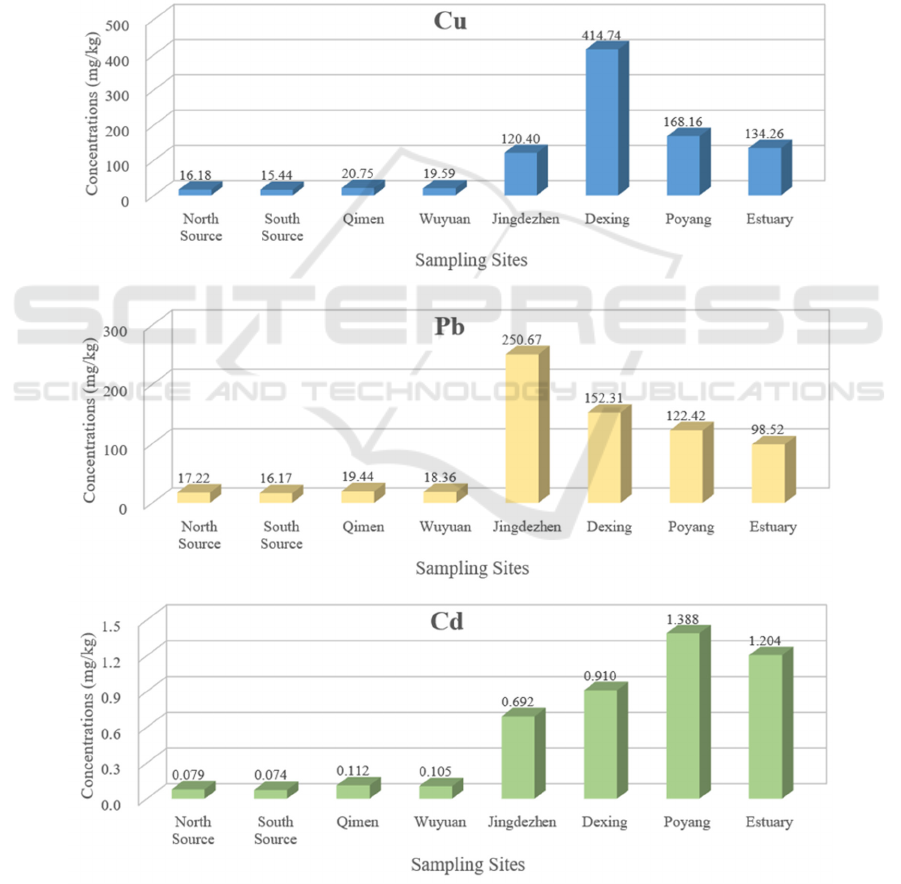
The concentrations of the pollutants in the sediment
are illustrated in Figure 2.
Figure 2: Concentrations of the heavy metals in the sediment along Rao River.
WRE 2021 - The International Conference on Water Resource and Environment
144
As is shown in Figure 2, the general trends of the
contents of Cu and Zn are as follows: source < upper
reaches< estuary< lower reaches< middle reaches.
Contrary, the general trend of the content of Cd
increases as following: source <upper reaches
<middle reaches<estuary<lower reaches. The reason
for this phenomenon is the difference in the
distribution of pollution sources. According to the
research of Yan et al, the pollution loads of Cu and Zn
majorly come from the industrial activity and mining
in Dexing City and Jingdezhen City, which lie along
the middle reaches of Rao River; while the pollution
loads of Cd majorly comes from the leaching from the
red soil of the farmland in the lower reaches of Rao
River
(Yan et al., 2018).
The mean contents of Cu, Pb and Cd in source
region are 15.81mg/kg, 16.70mg/kg and 0.077mg/kg,
respectively. Such behavior is close to the lower limit
of background values of heavy metals in the
sediments of Rao River’s water system.
The mean contents of Cu, Pb and Cd in upper
reaches region are 20.17 mg/kg, 18.90 mg/kg and
0.109 mg/kg, respectively. Among which, the heavy
metals contents in the sediments of Qimen City is
about 5% higher than that in Wuyuan City. In
comparison with source region, the heavy metals
contents of the sediments upper reaches increasingly
appear in different degrees. The increase range of Pb
and Cu is approximately 20%, whereas that of Cd is
over 40%.
The difference of heavy metals contents in middle
reaches is so large that the contents of Cu in Dexing
City reach up to 414.74 mg/kg, which is around 3.5
times that of Jingdezhen City. The Pb content in
Jingdezhen City is 250.67 mg/kg, which is 1.6 times
that of Dexing City. Generally, the contents of Cu, Pb
and Cd in the middle reaches are about 13, 10 and 7
times of that in the upper reaches and are far beyond
the upper limit of background value in Rao River.
The contents of Cu, Pb and Cd in the sediments of
lower reaches are 168.16 mg/kg,122.4 2mg/kg, and
1.388 mg/kg, respectively. In contrast to the middle
reaches, the contents of Cu and Pb in the lower
reaches decline by about 40%, whereas the content of
Cd increases by about 60%. In addition, the contents
of Cu, Pb and Cd in estuary region are 134.26 mg/kg,
98.52 mg/kg and 1.204 mg/kg, respectively. In
comparison with lower reaches, the contents of heavy
metals in sediments of estuary region decreases by
about 20%.
3.2 The Geo-accumulation Vectors of
Pollutants
According to Section 2.3, the geo-accumulation
vectors of pollutants are calculated and summarized
in Table 1.
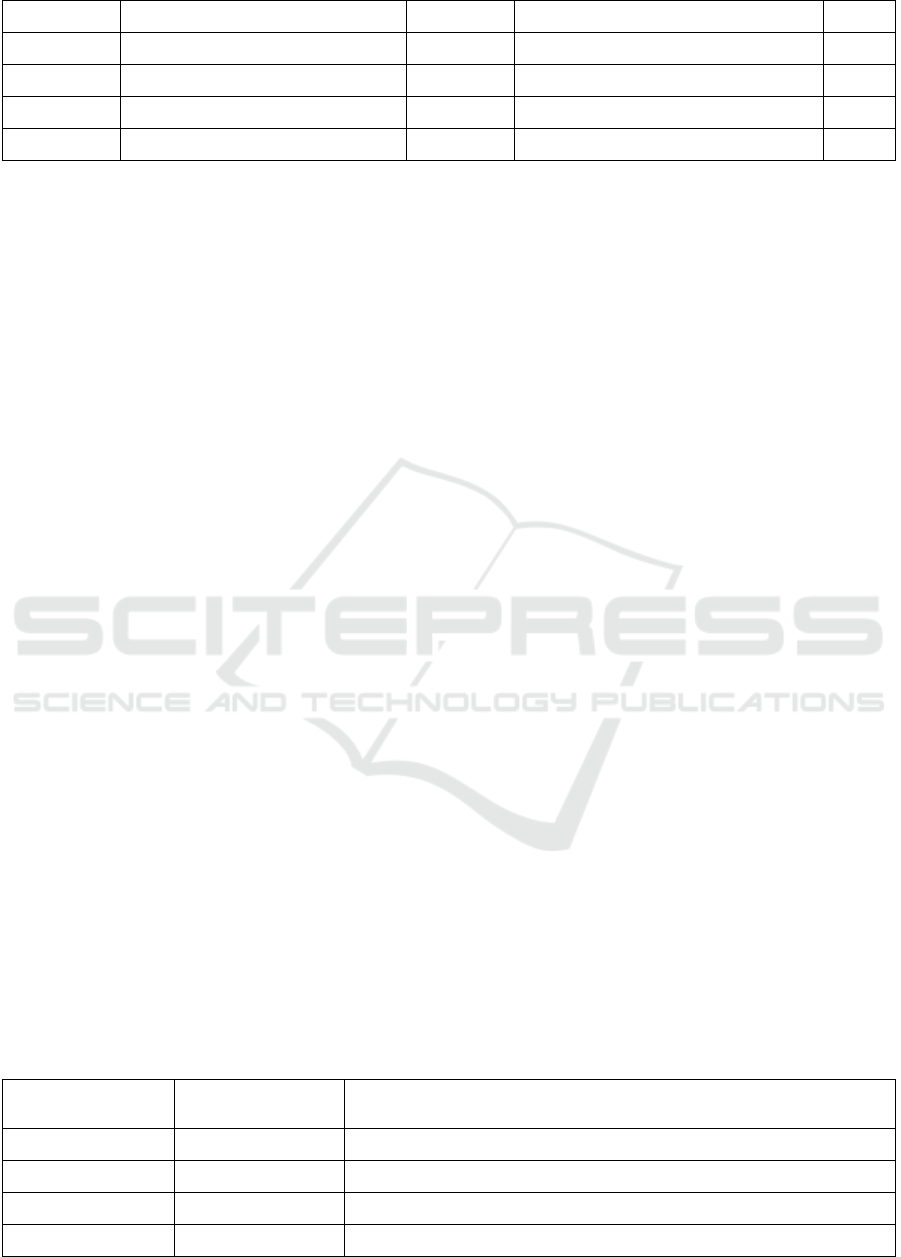
Table 1: Summary of calculated geo-accumulation vectors of pollutants.
Sampling
Sites
Geo-accumulation Vector
Feature
value
Grade
Risk
degree
Cu
North Source {1.00,0.00,0.00,0.00,0.00,0.00,0.00} -0.50 uncontaminated 0.00
South Source {1.00,0.00,0.00,0.00,0.00,0.00,0.00} -0.50 uncontaminated 0.00
Qimen {1.00,0.00,0.00,0.00,0.00,0.00,0.00} -0.50 uncontaminated 0.00
Wuyuan {1.00,0.00,0.00,0.00,0.00,0.00,0.00} -0.50 uncontaminated 0.00
Jingdezhen {0.00,0.37,0.57,0.06,0.00,0.00,0.00} 1.19 moderately contaminated 0.06
Dexing {0.00,0.00,0.00,0.27,0.62,0.11,0.00} 3.34 heavily contaminated 0.11
Poyang {0.00,0.00,0.51,0.49,0.00,0.00,0.00} 1.99 moderately contaminated 0.49
Estuary {0.00,0.00,0.70,0.30,0.00,0.00,0.00} 1.80 moderately contaminated 0.30
Pb
North Source {1.00,0.00,0.00,0.00,0.00,0.00,0.00} -0.50 uncontaminated 0.00
South Source {1.00,0.00,0.00,0.00,0.00,0.00,0.00} -0.50 uncontaminated 0.00
Qimen {1.00,0.00,0.00,0.00,0.00,0.00,0.00} -0.50 uncontaminated 0.00
Wuyuan {1.00,0.00,0.00,0.00,0.00,0.00,0.00} -0.50 uncontaminated 0.00
Heavy Metal Pollution Assessment in the Sediment of Rao River, China using the Geo-accumulation Vector
145
Sampling
Sites
Geo-accumulation Vector
Feature
value
Grade
Risk
degree
Jingdezhen {0.00,0.00,0.00,0.53,0.47,0.00,0.00} 2.97 moderately to heavily contaminated 0.47
Dexing {0.00,0.00,0.25,0.75,0.00,0.00,0.00} 2.25 moderately to heavily contaminated 0.00
Poyang {0.00,0.00,0.56,0.44,0.00,0.00,0.00} 1.94 moderately contaminated 0.44
Estuary {0.00,0.00,0.81,0.19,0.00,0.00,0.00} 1.69 moderately contaminated 0.19
Cd
North Source {1.00,0.00,0.00,0.00,0.00,0.00,0.00} -0.50 uncontaminated 0.00
South Source {1.00,0.00,0.00,0.00,0.00,0.00,0.00} -0.50 uncontaminated 0.00
Qimen {0.96,0.04,0.00,0.00,0.00,0.00,0.00} -0.46 uncontaminated 0.04
Wuyuan {0.96,0.04,0.00,0.00,0.00,0.00,0.00} -0.46 uncontaminated 0.04
Jingdezhen {0.00,0.14,0.60,0.26,0.00,0.00,0.00} 1.62 moderately contaminated 0.26
Dexing {0.00,0.00,0.46,0.54,0.00,0.00,0.00} 2.04 moderately to heavily contaminated 0.00
Poyang {0.00,0.00,0.14,0.60,0.26,0.00,0.00} 2.62 moderately to heavily contaminated 0.26
Estuary {0.00,0.00,0.30,0.52,0.18,0.00,0.00} 2.38 moderately to heavily contaminated 0.18
As shown in the Table 1, in the source region, all
the metals certainly belong to the “uncontaminated”
grade. In the upper reaches, Cu and Pb are still
certainly belong to “uncontaminated”. Although Cd
is also classified “uncontaminated,” a 4% risk of
being in the “uncontaminated to moderately
contaminated” grade exists.
At two sampling cities in the middle reaches, the
distinction among each heavy metals’
geo-accumulation vectors is substantial. In
Jingdezhen City, the pollution sequence is
Pb>Cd>Cu. Pb belongs to the “moderately to heavily
contaminated” level, and a 47% risk of worsening
toward “heavily contaminated” is present. Cu and Cd
are classified “moderately contaminated,” and the
probability of being classified “moderately to heavily
contaminated” is 6% and 26%, respectively. In
Dexing City, the pollution sequence is Cu>Cd>Pb.
Cu belongs to the “heavily contaminated” level, and a
11% risk of worsening toward “heavily to extremely
contaminated” exists. Pb and Cd are classified as
“moderately to heavily contaminated”, and the
probabilities of being classified “heavily
contaminated” are 44% and 19%, respectively.
In the lower reaches and estuary regions, the
sorting of the pollution is Cd>Cu>Pb. The Cd of these
two regions belongs to the “moderately to heavily
contaminated” level, and the risks of being classified
“heavily contaminated” are 26% and 18%,
respectively. Likewise, Cu belongs to the
“moderately contaminated” level, and the probability
of being classified “moderately to heavily
contaminated” are 49% and 30%, respectively.
Similarly, Pb also belongs to “moderately
contaminated” grade, and 44% and 19% chances of
worsening to “moderately to heavily contaminated”,
respectively.
3.3 Comprehensive Geo-Accumulation
Vectors Results
Based on the entropy weighting model, the weighted
vector {0.39, 0.30, 0.31} is generated for {Cu, Pb,
Cd}
(Yan et al., 2019c; Yi et al., 2018). Then,
according to the Eq. (11), the comprehensive
geo-accumulation vectors are calculated and
summarized in Table 2.
Table 2: Summary of calculated comprehensive geo-accumulation vectors.
Sampling
Sites
Geo-accumulation Vector
Feature
value
Grade
Risk
degree
North Source {1.00,0.00,0.00,0.00,0.00,0.00,0.00} -0.50 uncontaminated 0.00
South Source {1.00,0.00,0.00,0.00,0.00,0.00,0.00} -0.50 uncontaminated 0.00
Qimen {0.99,0.01,0.00,0.00,0.00,0.00,0.00} -0.49 uncontaminated 0.01
WRE 2021 - The International Conference on Water Resource and Environment
146
Wuyuan {0.99,0.01,0.00,0.00,0.00,0.00,0.00} -0.49 uncontaminated 0.01
Jingdezhen {0.00,0.19,0.41,0.26,0.14,0.00,0.00} 1.85 moderately contaminated 0.40
Dexing {0.00,0.00,0.22,0.50,0.24,0.04,0.00} 2.60 moderately to heavily contaminated 0.28
Poyang {0.00,0.00,0.41,0.51,0.08,0.00,0.00} 2.17 moderately to heavily contaminated 0.08
Estuary {0.00,0.00,0.60,0.34,0.06,0.00,0.00} 1.96 moderately contaminated 0.40
As shown in Table 2, the order of heavy metals
pollution in Rao River’s sediment is: source < upper
reaches < estuary < lower reaches < middle reaches.
The source region certainly belongs to
“uncontaminated.” Although the upper reaches
region is also classified “uncontaminated,” a 1% risk
of worsening to “uncontaminated to moderately
contaminated” exists.
In the middle reaches, the pollution level of
sediment in Dexing City is “moderately to heavily
contaminated,” and the risk of worsening toward
worse level is 28%. Similarly, the pollution level of
sediment in Jingdezhen City is “moderately
contaminated,” and a 40% risk of worsening to a
terrible grade exists. Combined with the discussion in
Section 3.2, Cu and Pb cause the deterioration of
heavy metals pollution of sediment in Dexing City
and Jingdezhen City, respectively.
In the lower reaches and estuary region, the
pollution level of heavy metals in sediment is
“moderately to heavily contaminated” and
“moderately contaminated,” respectively. The risks
of worsening are 8% and 40%, respectively.
Combined with the discussion of Section 3.2, the risk
of deterioration is mainly due to Cd.
As mentioned in Section 2.1, it is easily to find that
the economic structure and land use type become the
major influencing factors of heavy metals pollution in
Rao River.
The source and upper reaches regions of Rao River
located in the mountainous areas with high forest
coverage, where the economic structure is dominated
by the less polluting tourism industry. It is therefore
suggested that the pollution levels are pretty low in
source and upper reaches areas belonging to
“uncontaminated.”
According to the research of Yan et al, the
industrial structure of the middle reaches in Rao River
is dominated by industrial activity and mining, whose
pollution load is great
(Yan et al., 2018). Thus, the
pollution condition of heavy metals in sediment of
middle reaches is the most serious. Dexing Copper
Mine is the largest open copper mine, and Cu in slag
is easily leached by rain, which can confluence into
the river network with the slope. As a consequence,
the main risk factor of sediment in Dexing City is Cu.
The industrial structure of Jingdezhen is dominated
by ceramic production. Because of the Pb element in
the paint of ceramics, the Pb load in industrial
wastewater is quite prominent. Based on these
findings, the main controlling factor of sediment in
Jingdezhen City would be Pb.
The lower reaches of Rao River are located in a
plain area, and the soil is mainly red soil with weak
acidity, which is conducive to the release of Cd.
Besides, the crops in the lower reaches region of Rao
River are Indica Rice, which can absorb cadmium
well. Farmers are used to returning stalks to their
fields after harvest. As rice stalks rot, Cd can easily
enter the river network along with farmland runoff.
Hence, the main controlling factor in the lower
reaches of Rao River seems to be Cd.
3.4 Comparison between
Geo-accumulation Index and
Geo-accumulation Vector
The mean values of the Cu, Pb and Cd in global shale
are 45 mg/kg, 20 mg/kg and 0.3 mg/kg, respectively
(
Matschullat et al., 2000; Snežana et al., 2017).
According to the Eq. (1), the geo-accumulation
indices are calculated and summarized in Table 3.
Table 3: Summary of calculated geo-accumulation indices of Rao River.
Sampling
Sites
Geo-accumulation
index
Grade
Cu
North Source -2.06 uncontaminated
South Source -2.13 uncontaminated
Qimen -1.70 uncontaminated
Heavy Metal Pollution Assessment in the Sediment of Rao River, China using the Geo-accumulation Vector
147
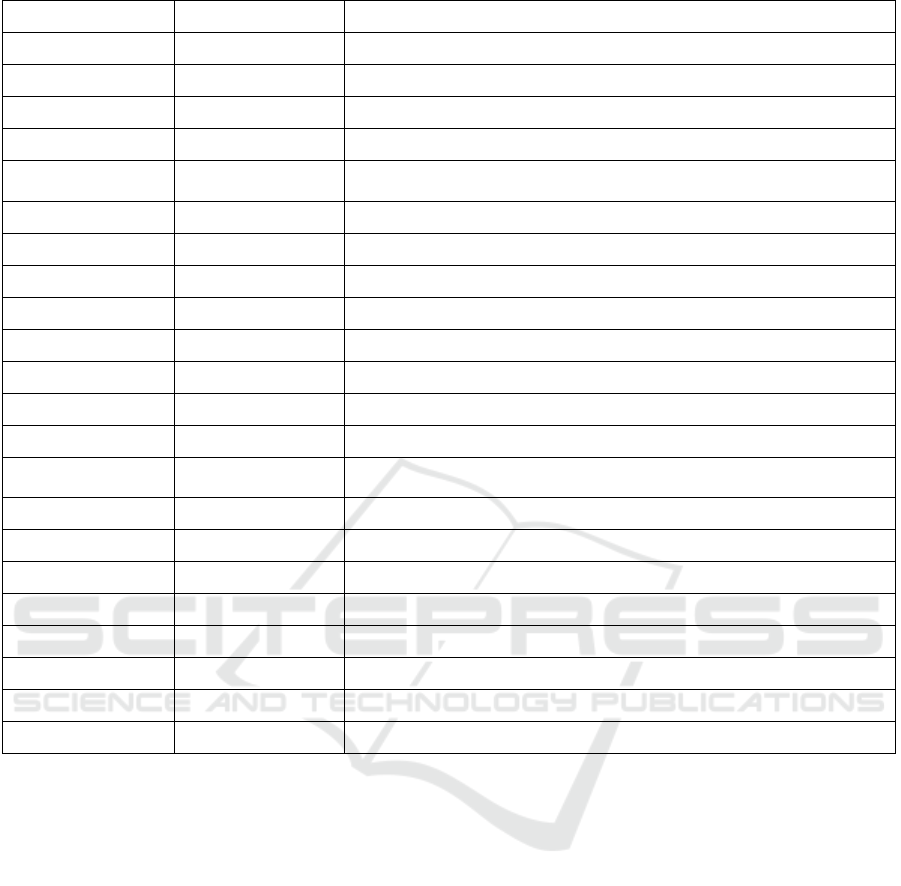
Wuyuan -1.78 uncontaminated
Jingdezhen 0.83 uncontaminated to moderately contaminated
Dexing 2.62 moderately to heavily contaminated
Poyang 1.32 moderately contaminated
Estuary 0.99 uncontaminated to moderately contaminated
Pb
North Source -0.80 uncontaminated
South Source -0.89 uncontaminated
Qimen -0.63 uncontaminated
Wuyuan -0.71 uncontaminated
Jingdezhen 3.06 heavily contaminated
Dexing 2.34 moderately to heavily contaminated
Poyang 2.03 moderately to heavily contaminated
Estuary 1.72 moderately contaminated
Cd
North Source -2.51 uncontaminated
South Source -2.60 uncontaminated
Qimen -2.01 uncontaminated
Wuyuan -2.10 uncontaminated
Jingdezhen 0.62 uncontaminated to moderately contaminated
Dexing 1.02 moderately contaminated
Poyang 1.63 moderately contaminated
Estuary 1.42 moderately contaminated
Compared between Table 2 and Table 3, it is easily
to find that there are two differences between the
geo-accumulation index and geo-accumulation vector.
(i) In the evaluation of Cu and Cd, the evaluation
results of the geo-accumulation index are looser than
the geo-accumulation vector.
In the middle reaches, lower reaches and estuary
region, the pollution grades of Cu and Cd in Table 3
are about one category lower than those in Table 1.
The reason for this phenomenon is that the local
background values is not identified with their mean
values in global shale. For example, the background
values of Cu and Cd in the sediment of Rao River are
14.16 mg/kg-41.97 mg/kg, and 0.065 mg/kg-0.257
mg/kg, respectively. While their mean values in
global shale are 45 mg/kg and 0.3 mg/kg. Obviously,
compared with global shale, the natural content of Cu
in the sediment of Rao River is much lower. As the
result, using the global average value as the local
background may lead to the distortion that some
anthropogenic heavy metals are regarded as the
natural background, which makes the evaluation
overoptimistic.
(ii) Compared with the geo-accumulation vector, it
is hard for the geo-accumulation index to identify
risks.
As shown in Table 3, the geo-accumulation index
of Cu in the estuary region is 0.99, which is nearly to
the “moderately contaminated” grade. However, the
geo-accumulation index cannot recognize this
cross-grade risk, rather would be considered that it
certainly seems to be “uncontaminated to moderately
contaminated”.
By contrary, the geo-accumulation vector solves
this problem through introducing the risk degree. For
example, as indicated in Table 1, the pollution feature
value of Cu in Poyang City is 1.99, which belongs to
the “moderately contaminated” grade. Considering its
risk degree is 0.49, we can further deduce that the
pollution of Cu in Poyang City has a potential
WRE 2021 - The International Conference on Water Resource and Environment
148

possibility of 49% to worsen to the “moderately to
heavily contaminated” grade.
4 CONCLUSIONS
In the sediment of Rao River, the pollution degrees of
heavy metals have significant regional differences,
and the main causes for these differences are the
economic structure and land use type. The order of
pollution degree is: source < upper reaches < estuary
< lower reaches < middle reaches. Dexing City,
Poyang City and Jingdezhen City are the most
polluted area along Rao River, which belong to
“moderately to heavily contaminated”, “moderately
to heavily contaminated” and “moderately
contaminated” grades, respectively, and have risk
probabilities of 28%, 8% and 40% to deteriorate,
respectively. The critical controlling heavy metals of
these 3 cities are Cu, Pb and Cd, respectively. The
fundamental causes would be their ceramic industry,
copper mining, and the red soil.
For the heterogeneity of mineral composition, the
mean values of the elements in global shale should
not be used as the background values of Rao River.
Otherwise, the evaluation results of Cu and Cd may
be overoptimistic.
Compared with the conventional geo-accumulation
index, the geo-accumulation vector has apparent
advantages in dealing with the uncertainty of
background values and the recognizing the
cross-grade risk.
FUNDING
This research was funded by Strategic Priority
Research Program Project of the Chinese Academy of
Sciences (XDA23040100), Water conservancy fund
project of Hunan Province (XSKJ2019081-30;
XSKJ2019081-32), the National Natural Science
Foundation of China, grant number 52069012.
CONFLICTS OF INTEREST
The authors declare no conflict of interest.
REFERENCES
Ke, X., Gui, S., Huang, H., Zhang, H., Wang, C., & Guo,
W. (2017). Ecological risk assessment and source
identification for heavy metals in surface sediment from
the Liaohe river protected area, China. Chemosphere,
175, 473-481.
Ma, G., Wang, S., Wang, Y., Zuo, D., & Yu, Y. (2015).
Emporal and spatial distribution characteristics of
nitrogen and phosphorus and diffuse source pollution
load simulation of Poyang Lake Basin. Acta Scientiae
Circumstantiae, 35(5), 1285-1291.
Maanan, M., Saddik, M., Maanan, M., Chaibi, M., &
Assobhei, O., Zourarah, B. (2015). Environmental and
ecological risk assessment of heavy metals in sediments
of Nador lagoon, Morocco. Ecological Indicators, 48,
616-626.
Matschullat, J., Ottenstein, R., & Reimann, C. (2000).
Geochemical background – can we calculate it?
Environmental Geology, 39(9), 990–1000.
Men, C., Liu, R., Xu, F., Wang, Q., Guo, L., & Shen, Z.
(2018). Pollution characteristics, risk assessment, and
source apportionment of heavy metals in road dust in
Beijing, China. Science of the Total Environment, 612,
138-147.
Ministry of Ecological and Environment of the People’s
Republic of China. (2018). Soil Environmental Quality
Risk Control Standard for Soil Contamination of
Agricultural Land. Beijing: China Environmental
Science Press.
Muller, G. (1969). Index of geo-accumulation in sediments
of Rhine River. Geochemical Journal, 2, 108 -118.
Pathak, A. K., Yadav, S., Kumar, P., & Kumar, R. (2013).
Source apportionment and spatial–temporal variations
in the metal content of surface dust collected from an
industrial area adjoining Delhi, India. Science of the
Total Environment, 443, 662-672.
Peng, S., Jun, X., Yafeng, W., & Liding, C. (2014).
Assessment of ecological and human health risks of
heavy metal contamination in agriculture soils
disturbed by pipeline construction. International
Journal of Environmental Research and Public Health,
11(3), 2504-2520.
Shi, G., Chen, Z., Bi, C., Li, Y., Teng, J., Wang, L., & Xu,
S. (2009). Comprehensive assessment of toxic metals in
urban and suburban street deposited sediments (SDSs)
in the biggest metropolitan area of China.
Environmental Pollution, 158(3), 694-703.
Snežana, Š., Milica, K. G., & Nebojša, V. (2017).
Importance of background values in assessing the
impact of heavy metals in river ecosystems: case study
of Tisza River, Serbia. Environ Geochem Health, 40(4),
1247-1263.
Xu, D., Gao, B., Peng, W., Lu, J., & Gao, L. (2018).
Thallium pollution in sediments response to
consecutive water seasons in Three Gorges Reservoir
using geochemical baseline concentrations. Journal of
Hydrology, 564
, 740-747.
Yan, F., Liu, C., & Wei, B. (2018). Evaluation of heavy
metal pollution in the sediment of Poyang Lake based
on stochastic geo-accumulation model (SGM). The
Science of the Total Environment, 659, 1-6.
Heavy Metal Pollution Assessment in the Sediment of Rao River, China using the Geo-accumulation Vector
149

Yan, F., Qian, B., & Chen, Y. (2019a). Stochastic potential
ecological risk model for heavy metal contamination in
sediment. Ecological Indicators, 102, 246-251.
Yan, F., Qian, B., Xiao, X., & Ma, L. (2019b).
Geo-accumulation vector model for evaluating the
heavy metal pollution in the sediments of Western
Dongting Lake. Journal of Hydrology, 567(7),
112-124.
Yan, F., Yi, F., & Chen, L. (2019c). Improved Entropy
Weighting Model in Water Quality Evaluation. Water
Resources Management, 33, 15-24.
Yi, F., Li, C., & Feng, Y. (2018). Two precautions of
entropy-weighting model in drought-risk assessment.
Natural Hazards, 93(69), 1-9.
Yuan, X., Leng, L., Huang, H., Chen, X., Wang, H., Xiao,
Z., Zhai, Y., Chen, H., & Zeng, G. (2015). Speciation
and environmental risk assessment of heavy metal in
bio-oil from liquefaction/pyrolysis of sewage sludge.
Chemosphere, 120, 645-652.
Zhang, L. (1995). Study on chemical elements in water
environment. Beijing: China Environmental Science
Press.
Zhang, W., Feng, H., Chang, J., Qu, J., Xie, H., & Yu, L.
(2009). Heavy metal contamination in surface
sediments of Yangtze River intertidal zone: An
assessment from different indexes. Environmental
Pollution, 157(5), 1533-1543.
WRE 2021 - The International Conference on Water Resource and Environment
150
