
Study on Evaluation of Water Resources Carrying Capacity based on
Supply and Demand Balance Analysis: Take Julu County, Hebei
Province as an Example
Yuan Meng
*
, Zhenhua Xu, Hongjie Liu and Yu Su
Department of Civil Engineering, Beijing City University, Beijing 100083, China
Keywords:
Water resources carrying capacity, Supply and demand balance analysis, Trend forecast
Abstract:
The shortage of water resources is a rigid constraint factor that limits the development of regional economy
and society. The purpose of this study is to scientifically calculate the carrying capacity of water resources,
taking into account factors such as natural endowment of resources & environment and pressure of social &
economic development. Based on the analysis of supply and demand balance, the idea of water resources
carrying capacity calculation based on supply-demand balance analysis is constructed, which includes four
steps: "resource endowment analysis - pressure state analysis - supply - demand balance analysis - carrying
capacity calculation". Taking Julu County of Hebei Province as a case, based on the calculation of water
resources supply and demand, and the analysis of supply and demand balance under multi-scenario
simulation, the water resources carrying capacity is comprehensively calculated. The results show that,
considering precipitation and surface runoff, exploitable groundwater, regional water transfer and reclaimed
water reuse projects, the total available water resources at the end of the planning period are 89.11 million
m3. After comprehensively popularizing agricultural water-saving irrigation, ensuring domestic water
consumption of urban and rural residents and optimizing the water-saving industrial structure, the total
water resources demand at the end of the planning period is 76.74 million m3. Through the analysis of the
balance between supply and demand, the water resources structure optimization scheme is formed, and the
comprehensive carrying capacity of water resources is calculated, including 420,700 urban population,
173,000 rural population, 32,700 hectares of cultivated land, 4,474 hectares of urban construction land,
3,453 hectares of village construction land and 2,401 hectares of industrial land, thus realizing the rigid
constraint goal of "determining city, land, people and production by water".
1 INTRODUCT
1.1 Background
Resources and environment are the material basis of
economic and social development and the basic
carrier of economic development. At the same time,
the changes in the structure and state of resources
and environment seriously restrict the speed of
economic development (
Liu et al., 2020). In terms of
carrying capacity of resources and environment,
social and economic development is generally
restricted by water and soil. More than 80% of the
carrying capacity of urban agriculture and urban
construction in China is restricted by water,
especially in water-deficient cities such as Ningxia
and Hebei provinces (Song
et al., in press). With the
rapid development of economy and society in the
future, urban water demand is increasing rigidly, and
water resources is facing a more severe situation.
The Decision of the Central Committee of the
Communist Party of China on Several Major Issues
Concerning Comprehensively Deepening Reform at
the Third Plenary Session of the 18th CPC Central
Committee put forward that "a monitoring and early
warning mechanism for carrying capacity of
resources and environment should be established,
and restrictive measures should be taken for areas
with water and soil resources overload,
environmental capacity and marine resources"
(Wang
et al., 2020). In 2014, 2019 and 2020, General
Secretary Xi Jinping put forward that water
resources should be regarded as the biggest rigid
constraint in development, and it is necessary to
insist on determining city, land, population and
industry by water, taking water resources as the
Meng, Y., Xu, Z., Liu, H. and Su, Y.
Study on Evaluation of Water Resources Carrying Capacity based on Supply and Demand Balance Analysis: Take Julu County, Hebei Province as an Example.
In Proceedings of the 7th International Conference on Water Resource and Environment (WRE 2021), pages 109-122
ISBN: 978-989-758-560-9; ISSN: 1755-1315
Copyright
c
2022 by SCITEPRESS – Science and Technology Publications, Lda. All rights reserved
109

biggest rigid constraint and rationally planning the
development of population, city and industry (Song
et al., 2020). General Secretary Xi Jinping particularly
emphasized that when planning land space and
regional economic layout, it was necessary to
implement the strategy of main functional areas,
scientifically plan the protection pattern of land
space development and effectively standardize the
order of space development on the basis of the
carrying capacity of resources and environment and
the suitability evaluation of land space development.
1.2 Research Reviews
The carrying capacity of water resources refers to
the water resources in a certain area. It’s the largest
agricultural, industrial, urban scale and population
that can be carried. This ability is a comprehensive
goal that changes with the development of economy
and society. Foreign studies on water resources
carrying capacity mainly focus on urban water
supply and agricultural production (Li
et al., 2020). In
China, the research on water resources carrying
capacity began in the late 1980s. In 1989, Xinjiang
Water Resources Soft Science Research Group put
forward the concept and evaluation model of water
resources carrying capacity, and adopted the
conventional trend method to study the water
resources carrying capacity of Urumqi River Basin
in Xinjiang (Tang
et al., 2021). At present, the main
evaluation methods of water resources carrying
capacity include empirical formula method,
comprehensive evaluation method and system
dynamics method (Du
et al., 2020). Among them, the
empirical formula method is a formula derived and
summarized by the dimensional principles, which
come from production practice. Its advantage is
simple calculation and easy popularization and
application, but less consideration is given to the
connection between resources and economy and
society. The basic idea of comprehensive evaluation
method is to calculate through the selected indicators
and evaluation standards, and then comprehensively
evaluate the bearing capacity according to the
calculated values. The disadvantages are that it is
difficult to unify the selection of indicators and
determine the evaluation standards. The system
analysis method mainly adopts the system dynamic
model, optimization model and control target
inversion model, etc., which has the advantage of
considering the complexity and systematisms of
"economic society - water resources - ecological
environment", but the deficiency is that the
calculation method is complex, the process is
cumbersome and difficult to popularize and apply
(Zhang
et al., 2019).
In a word, the influencing factors of water
resources carrying capacity include social
development, resource endowment, supporting
status and environmental protection, which are
comprehensive reflection of the balance between
supply and demand of water resources (Zhang
et al.,
2020). Bearing capacity can be understood as a
system consisting of four elements: bearing support,
bearing pressure, action relationship and elastic
result. Some studies have built up “Pressure state
response” models to calculate the resources carrying
capacities (Niu
et al., 2020). Bearing support has the
characteristics of objectivity and structure, while
bearing pressure has the characteristics of initiative
and relativity. The action relationship is restricted by
the action mechanism of subject and object, and
bearing capacity is influenced by social values,
which is an elastic result (Ma
et al., 2020).
1.3 Research Approach
This paper constructs an idea of water resources
carrying capacity calculation based on supply-
demand balance analysis (Figure 1), which includes
four steps: "resource endowment analysis-pressure
state analysis-supply demand balance analysis-
carrying capacity calculation". Based on the
calculation of water supply and demand, and the
supply-demand balance analysis under multi-
scenario simulation, the optimization scheme of
water resources utilization structure is obtained,
according to "determining city by water, land by
water, population by water, and industry by water".
WRE 2021 - The International Conference on Water Resource and Environment
110
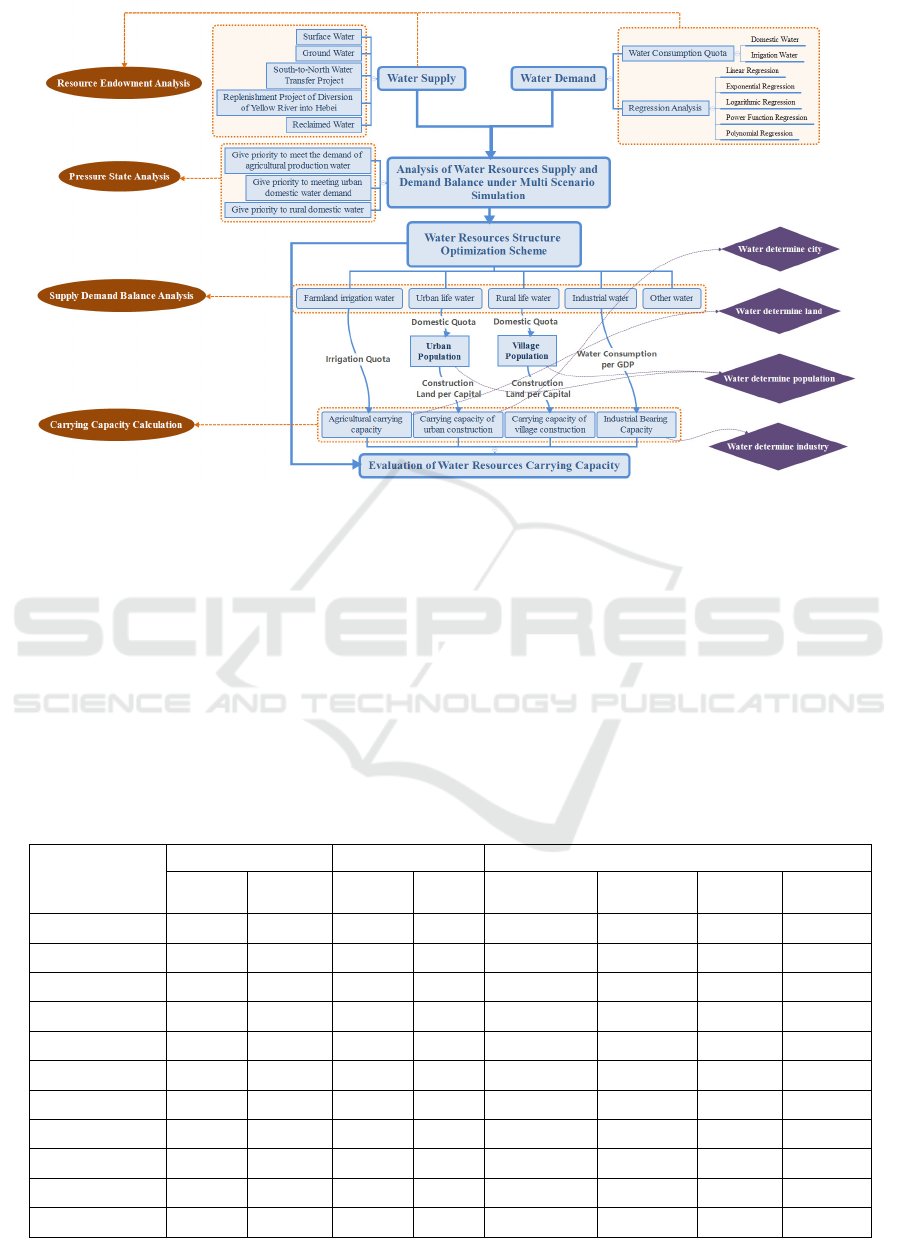
Figure 1: Approach of calculating water resources carrying capacity.
2 WATER RESOURCE
ENDOWMENT ANALYSIS
2.1 Surface Water
According to the spatial distribution results of
surface water in each township in Julu County Water
Resources Evaluation Report (Table 1), the annual
runoff under the guarantee rate of 50% in Julu
County Water Resources Overall Utilization and
Protection Plan is 1,158,600 m
3
. According to the
utilization rate of surface water: the surface runoff
under the guaranteed rate of 50%, the utilization rate
of surface water is 0.68; Under the guarantee rate of
75%, the utilization rate of surface water is 0.87.
The formula: surface water = annual runoff ×
surface water utilization rate can be calculated, and
when the guarantee rate is 50%, the available surface
water in Julu County is 790,000 m
3
.
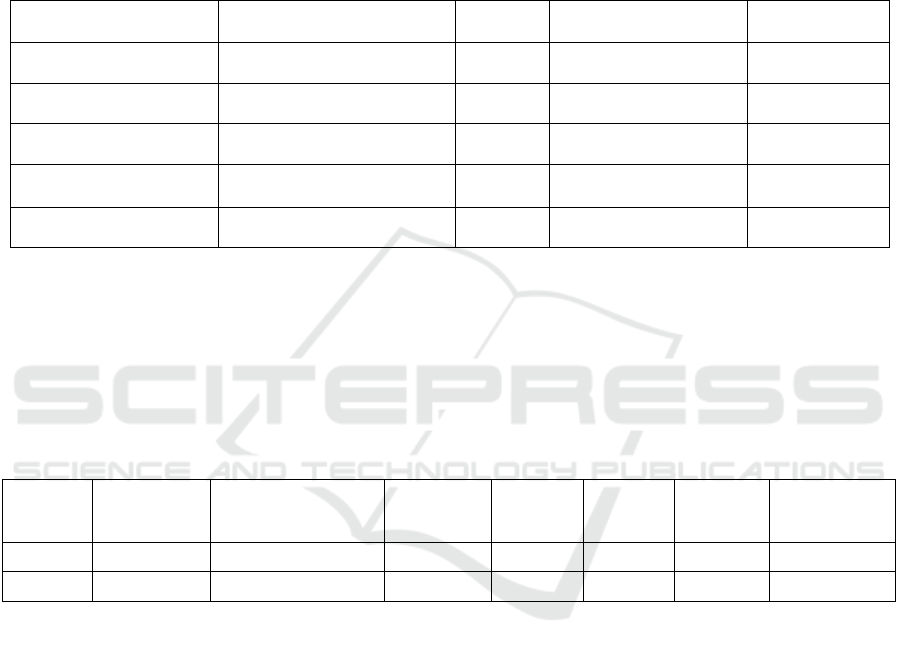
Table 1: Distribution of surface water resources in Julu County.
Administrative
divisions
Average value Parameter Annual runoff at different frequencies (10,000 m3)
Runoff
de
p
th
Runoff
volume
Cv Cs/Cv 20% 50% 75% 95%
Julu 6.2 54.83 1.65 2 75.11 15.9 2.03 0
Xiguocheng 7.6 23.87 1.65 2 32.7 6.92 0.88 0
Guanting 6.1 44 1.65 2 60.28 12.76 1.63 0
Yantuan 6 40.33 1.65 2 55.25 11.7 1.49 0
Xiaolvzhai 7.2 25.64 1.65 2 35.13 7.44 0.95 0
Wanghuzhai 6.9 26.46 1.65 2 36.26 7.67 0.98 0
Zhangwangtuan 5.9 48.88 1.65 2 66.96 14.17 1.81 0
Sujiaying 5.8 46.79 1.65 2 64.1 13.57 1.73 0
Dicun 6 46.34 1.65 2 63.49 13.44 1.71 0
Guanzhai 6.2 37.1 1.65 2 50.83 10.76 1.37 0
County 6.3 399.5 1.65 2 547.32 115.86 14.78 0
References: Julu County Water Resources Evaluation Report
Study on Evaluation of Water Resources Carrying Capacity based on Supply and Demand Balance Analysis: Take Julu County, Hebei
Province as an Example
111

2.2 Ground Water
Combined with the spatial distribution results of
groundwater in Julu County Water Resources
Evaluation Report and groundwater prediction
results in Julu County Water Resources Overall
Utilization and Protection Plan, the total available
groundwater resources in Julu County is 34,330,000
m
3
. Julu County is a saline water area, and deep
groundwater has been developed and utilized.
According to the actual situation, considering the
conditions of not causing ground subsidence and
upper saltwater infiltration downward, the annual
allowable exploitation amount under the limited
head drop value is determined. From 1991 to 2005,
the annual average over-flow recharge of shallow
water to deep groundwater was 19,115,000 m
3
, the
annual average lateral recharge of deep water was
2,354,300 m
3
, and the annual average lateral outflow
of deep water was 1,883,400 m
3
, so the annual
allowable exploitation of deep groundwater in Julu
County was 19,585,900 m
3
.
2.3 South-to-North Water Transfer
Project
The "South-to-North Water Transfer Project" is a
strategic project of the People's Republic of China,
which is divided into three routes: east, middle and
west. The starting point of the eastern route project
is located at Jiangdu Water Control Project in
Yangzhou, Jiangsu Province. The starting point of
the middle line project is located in Danjiangkou
Reservoir in the middle and upper reaches of
Hanjiang River, and the water supply areas are
Henan, Hebei, Beijing and Tianjin.
The South-to-North Water Transfer Project in
Xingtai City is an important infrastructure to solve
the serious shortage of water resources, realize the
optimal allocation of water resources, ensure the
safety of water supply in county towns, and improve
the agricultural production conditions and ecological
environment. Besides huge economic benefits, it
also has extensive social benefits. It is a strategic
project with dual functions of public welfare and
management. The direct water supply targets of the
South-to-North Water Transfer Project are cities
(including county towns and key industrial areas)
and industries. The overall water shortage situation
in the water receiving area can be improved by
returning water to agriculture, limiting the
exploitation of groundwater and making full use of
the increased backwater in cities.
According to the Master Plan of South-to-North
Water Transfer Project, the average annual water
transfer amount of the first phase of the Middle
Route Project is 9,500,000,000 m
3
, with
3,500,000,000 m
3
in Hebei Province. According to
"Opinions on Water Distribution and Scale
Adjustment of Supporting Projects in Hebei
Province in the Middle Route of South-to-North
Water Transfer Project", the water quantity in
Xingtai City is 333,350,000m
3
, and combined with
the secondary supply and demand analysis results of
"Water Resources Planning of South-to-North Water
Transfer Project in Xingtai City, Hebei Province",
the target water supply quantity in Julu County is
5,970,000 m
3
, which is mainly used for urban
domestic water and industrial water.
2.4 Replenishment Project of Diversion
of Yellow River into Hebei
In the water diversion project from the Yellow River
to Hebei Province, the water conveyance line draws
water from the gate of Huanghequ Village in Henan
Province, uses Puqing South Main Canal in Puyang
City, and passes through Weihe River to enter Hebei
Province. In Hebei Province, the existing canals are
basically used to deliver water, passing through
Dongfeng Canal, Laozhang River and Jiaodongpai
River to xian county Hub, passing through Hutuo
River North Dike, and then using Zita Main Canal,
Guyanghe River, Xiaobai River and Renwen Main
Canal to deliver water to Baiyangdian Lake.
After the South-to-North Water Transfer Project
is fully supplied, the index of water diversion from
the Yellow River in Hebei Province is
620,000,000m
3
, and the water diversion time is
April in winter. The designed discharge at the head
of the project is 150 m
3
/s, of which the designed
discharge at the water receiving area in Hebei
Province is 61.4m³/s. The water transfer line from
the Yellow River to Hebei passes through 10
counties in Xingtai, and the amount of water
allocated to Julu County is 18,550,000m
3
.
2.5 Reclaimed Water
To solve and alleviate the increase of water resources
demand and the aggravation of water pollution
caused by urbanization, it is necessary to improve the
efficiency of water resources recycling. The
recycling of urban water resources is conducive to
reducing the demand for freshwater resources and
alleviating the water supply pressure of urban water
resources (Zeng
et al., 2021). According to the
WRE 2021 - The International Conference on Water Resource and Environment
112
industrial development and residents' living water
level in Julu County, using industrial water, urban
public service and urban living water to calculate the
sewage discharge, the recovery rate is 80%, the loss
in the treatment process is 10%, and the utilization
rate of treated reclaimed water is 80%. The reclaimed
water reuse amount is about 9,880,000 m
3
.
2.6 Total Water Resources Supply
To sum up, the total amount of available water
resources in Julu County by 2025 and 2035 is shown
in Table 2.
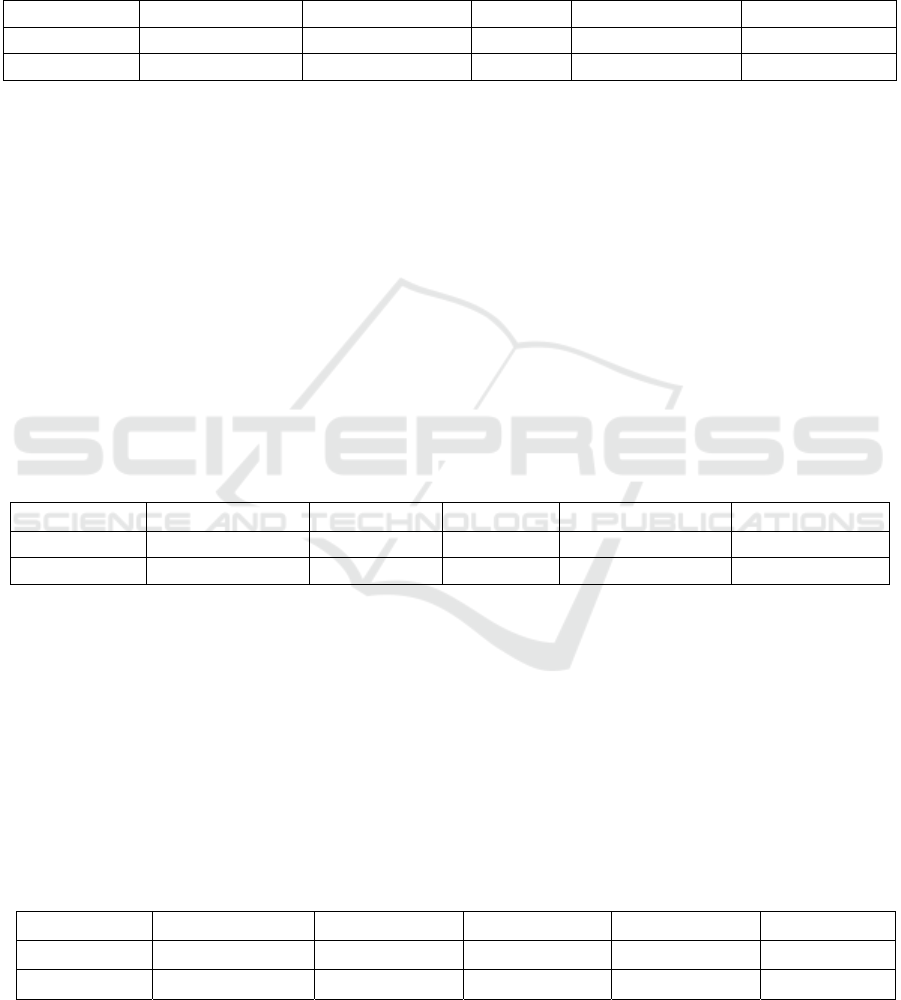
Table 2: Total available water resources in Julu County in 2025 and 2035.
Unit: 10,000 m3
Planning
period
Total
Surface
water
Ground
water
South-to-north
water diversion
Diverting water from the
Yellow River into the main
canal of Hebei Province
Reclaimed
water
2025
8531 78 5392 597 1855 608
2035
8911 78 5392 597 1855 988
3 WATER RESOURCE
PRESSURE STATE ANALYSIS
Linear and non-linear regression analysis methods
are used to predict the production and domestic
water consumption and structure in the planning
period by fitting historical data. However, the
regression analysis method is only an objective
mathematical statistical analysis method based on
history, and the regression model should be
optimized in combination with social and economic
development and water saving measures.
3.1 Farmland Irrigation
According to the total water resources minus the
current (2018) water consumption for forestry,
animal husbandry, fishery and livestock, urban
public, ecological environment, residents' living and
industrial water, the theoretical maximum scale of
farmland irrigation water can be calculated, which
will be 69,291,800 m
3
and 73,091,800 m
3
by 2025
and 2035 respectively.
Using the regression analysis results (Table 3), the
polynomial regression fitting effect is the best,
which is mainly due to the farmland irrigation water
after a continuous decline during 2014-2017, and a
small increase in 2018, so from the model point of
view, it is more in line with the change trend of the
polynomial model. But in fact, the irrigation water
consumption of Julu County will continue to decline
with the increase of water-saving irrigation area,
adjustment of crop planting structure and irrigation
mode, promotion of Double Ridge Film Mulching
and furrow sowing technology. In addition, the
results of linear regression and exponential
regression obviously do not conform to the actual
situation, so the power function regression equation
is used to predict.
Table 3: Regression analysis results of farmland irrigation water.
Regression equation R
2
Forecast value in 2025
(
10,000 m
3
)
Forecast in 2035
(
10,000 m
3
)
Linear regression y=-487.21x+8039.4 0.5595 1705.67 -2679.22
Exponential regression y=8036.2e
-0.07x
0.5378 3469.31 1722.81
Logarithmic regression y=-1404ln(x)+7922.3 0.7509 6407.13 6037.54
Power function
re
g
ression
y=7904.3x
-0.202
0.7235 4784.86 4233.45
Polynomial regression y=357.87x2-2634.4x+10544 0.9821 30464.48 125796.28
Study on Evaluation of Water Resources Carrying Capacity based on Supply and Demand Balance Analysis: Take Julu County, Hebei
Province as an Example
113
3.2 Water Consumption for Forestry,
Animal Husbandry, Fishery and
Livestock
The continuous decline of water consumption during
2014-2018, the fitting effect of various regression
methods is good, and the difference is not big (Table
4). From R
2
, the highest is logarithmic regression,
that is, the quantity of forestry, animal husbandry,
fishery and animal husbandry will continue to
decline, but the decline rate will gradually
slowdown, which is more in line with the relevant
forestry and fruit industry and animal husbandry
development plan of Julu County, so logarithmic
regression equation is used for prediction.
Table 4: Regression analysis results of water use for forestry, animal husbandry, fishery and livestock.
Regression equation R
2
Forecast value in 2025
(10,000 m
3
)
Forecast in 2035
(10,000 m
3
)
Linear regression y=-103.73x+1363.7 0.8433 15.21 -918.36
Exponential regression y=1396.6e
-0.098x
0.8579 430.87 161.71
Logarithmic regression y=-265.2ln(x)+1306.5 0.8908 1020.30 950.49
Power function
regression
y=1316.4x
-0.245
0.8690 716.12 617.30
Polynomial regression y=12.461x2-178.5x+1450.9 0.8604 1103.28 3555.02
3.3 Industrial Water Consumption
From the model fitting results (Table 5), the
polynomial regression is the best, but the prediction
result in 2035 is extremely high, which does not
conform to the actual situation. Considering the
development target of annual industrial added value
and the promotion of industrial water-saving
measures in Julu County, the prediction result of
polynomial regression in 2025 is taken as the
maximum value of industrial water consumption.
Table 5: Regression analysis results of industrial water.
Regression equation R
2
Forecast value in 2025
(10,000 m
3
)
Forecast in 2035
(10,000 m
3
)
Linear regression y=-8.538x+181.54 0.3533 70.55 -6.30
Exponential regression y=180.12e
-0.051x
0.3137 97.67 58.65
Logarithmic regression y=-26.61ln(x)+181.41 0.5546 152.69 145.69
Power function
regression
y=180.33x
-0.161
0.5053 120.87 109.63
Polynomial regression y=9.2414x2-63.987x+246.23 0.9328 809.15 3311.35
3.4 Prediction of Urban Public Water
Use
In recent years, the urban public water consumption
also showed a trend of continuous decline and then a
small increase, making the polynomial regression
fitting effect the best, but the urban public water
consumption will not show a trend of high-speed
exponential growth in the future, and the gradual
completion of urban public service facilities, water
demand will show an upward trend (Table 6).
Therefore, the logarithmic regression equation is
used for prediction.
Table 6: Regression analysis results of urban public water use.
Regression equation R
2
Forecast value in 2025
(10,000 m
3
)
Forecast in 2035
(10,000 m
3
)
Linear regression y=-28.4x+213 0.6126 -156.20 -411.80
Exponential regression y=212.29e
-0.19x
0.6532 21.71 3.25
Logarithmic regression y=-81.52ln(x)+205.86 0.8154 117.89 96.43
Power function regression y=201.1x
-0.539
0.8486 52.69 38.01
Polynomial regression y=17.571x2-133.83x+336 0.9409 1260.26 5896.10
WRE 2021 - The International Conference on Water Resource and Environment
114
3.5 Urban Domestic Water
According to the total amount of water resources
minus the current situation (2018) of farmland
irrigation, forestry, animal husbandry, fishery and
livestock, urban public, ecological environment and
industrial water, the maximum theoretical scale of
urban domestic water can be calculated according to
the current urbanization rate and per capita domestic
water quota, which will be 4,073,600 m
3
and
5,656,400 m
3
by 2025 and 2035 respectively.
Although from the model fitting effect (Table 7),
the polynomial regression fitting effect is the best,
and it can ensure the residents' domestic water
consumption to the maximum extent, but the
forecast value in 2035 is too divorced from the
reality. According to the prediction of per capita
urban domestic water consumption from 2014 to
2018, and the resident population, the per capita
urban water consumption is maintained at about 20
m
3
/
day in 2014, except for 34 m
3
/
day in 2014.
However, the minimum value of domestic water
consumption per capita in Hebei Province is also 50
m
3
/ day. Even if the urban population scale remains
unchanged, the urban domestic water consumption
also needs to be greatly increased. Therefore, the
polynomial regression model is used to predict the
urban living water consumption in 2025 to ensure
the basic living needs of the people. However, in the
10 years from 2025 to 2035, the average annual
growth of urban domestic water is basically the
same as that in 2018-2025, and the urban domestic
water will be about 9,820,000 m
3
by 2035.
Table 7: Regression analysis results of urban domestic water.
Regression equation R
2
Forecast value in 2025
(10,000 m
3
)
Forecast in 2035
(10,000 m
3
)
Linear regression y=-8.2x+133.4 0.5946 26.80 -47.00
Exponential regression y=133.12e
-0.07x
0.5994 57.47 28.54
Logarithmic regression y=-23.69ln(x)+131.48 0.8018 105.91 99.68
Power function regression y=130.9x
-0.202
0.8047 79.24 70.11
Polynomial regression y=5.4286x2-40.771x+171.4 0.9595 463.87 1901.88
3.6 Rural Domestic Water
Similar to the calculation process of the maximum
theoretical scale of urban domestic water, the
maximum theoretical scale of rural domestic water
can be calculated, which will be 5,706,400 m
3
and
7,923,600 m
3
by 2025 and 2035 respectively.
According to various models (Table 8), the fitting
effect is not ideal. From 2014 to 2018, the per capita
rural domestic water consumption increased
continuously from 29.49 m
3
/day to 32.64 m
3
/day
according to the permanent population. However,
there is still a big gap from the minimum standard of
water quota in Hebei Province. If only from the
perspective of ensuring the basic domestic water
demand of the people, the rural domestic water
consumption needs to reach 1.53 times (50 / 32.64)
of the current situation, and the annual water
consumption can reach about 4,610,000 m
3
.
However, considering that the urbanization process
of rural population will continue in the planning
period, the predicted value is taken as the maximum
value of rural domestic water.
Table 8: Regression analysis results of rural domestic water.
Regression equation R
2
Forecast value in 2025
(
10,000 m
3
)
Forecast in 2035
(
10,000 m
3
)
Linear regression y=0.502x+298.69 0.0163 305.22 309.73
Exponential regression y=298.55e
0.0018x
0.0187 305.07 310.61
Logarithmic regression y=2.4792ln(x)+297.82 0.0643 300.50 301.15
Power function regression y=297.71x
0.0085
0.0691 201.93 202.97
Polynomial regression y=-1.2129x2-7.7791x+290.2 0.1497 208.89 -125.70
Study on Evaluation of Water Resources Carrying Capacity based on Supply and Demand Balance Analysis: Take Julu County, Hebei
Province as an Example
115
3.7 Water for Ecological Environment
The ecological environment water consumption
includes urban environment and rural ecological
water consumption. In recent years, the ecological
environment water consumption in Julu County has
continued to increase. According to the goal of
ecological civilization construction, it can be
predicted that the water demand for ecological
environment will continue to increase in the
planning period. However, Julu County is a water
shortage area, and the limited water resources should
first meet the needs of people's life, so the power
function regression equation is used to predict
(Table 9).
Table 9: Regression analysis results of ecological environment water use.
Regression equation R
2
Forecast value in 2025
(10,000 m
3
)
Forecast in 2035
(10,000 m
3
)
Linear regression y=-7.06x+80.58 0.8848 172.36 235.90
Exponential regression y=82.439e
0.0684x
0.8909 187.33 371.24
Logarithmic regression y=16.022ln(x)+86.419 0.7363 103.71 107.93
Power function
regression
y=87.178x
0.156
0.7482 128.46 141.20
Polynomial regression y=1.4429x2-1.5971x+90.68 0.9366 279.29 753.91
3.8 Total Water Demand
In conclusion, based on historical data, socio-
economic development trend and water-saving
measures, the total production and domestic water
consumption in Julu County will be 77,860,000 m
3
and 76,740,000 m
3
by 2025 and 2035 respectively,
which is less than the total amount of available water
resources in the county. This result will be an
important basis for water structure optimization
(Table 10).
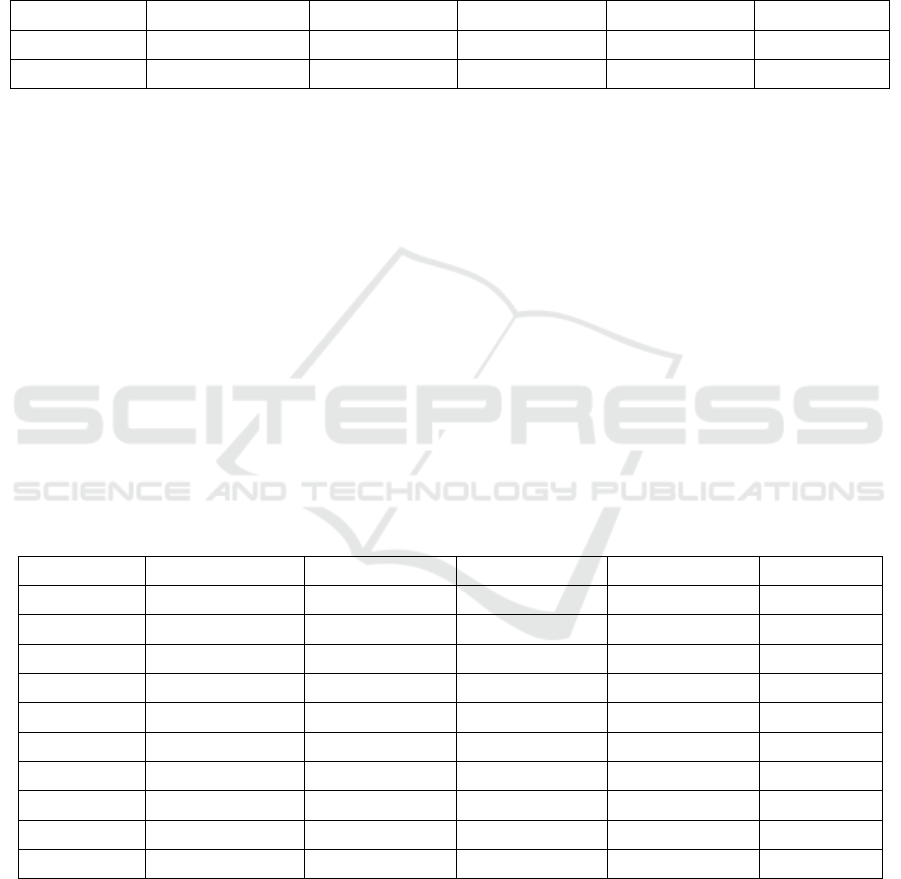
Table 10: Forecast summary of production and domestic water in Julu County.
Unit: 10,000 m
3
Planning
period
Farmland
irrigation
Forestry, animal
husbandry, fishery
and livestoc
k
Industry
Urban
public
Urban
life
Rural life
Ecological
environment
2025 4784.86 1020.30 809.15 117.89 463.87 461.00 128.46
2035 4233.45 950.49 809.15 96.43 982.25 461.00 141.20
4 ANALYSIS OF WATER
RESOURCES SUPPLY AND
DEMAND BALANCE UNDER
MULTI SCENARIO
SIMULATION
Planning water consumption structure is an
important basis for the calculation of water resources
carrying capacity. Since the water demand for
production and living is less than the available water
resources, the water consumption for production and
living should be fully allocated from the perspective
of supply. In this process, it is necessary to consider
the water consumption, water resources allocation of
the south to North Water Diversion Project and other
factors, as well as the current situation and
development trend of water use structure, so as to
simulate the water use structure under different
development goals.
4.1 Give Priority to Meet the Demand
of Agricultural Production Water
(Scheme I)
Firstly, according to the prediction results of urban
and rural domestic water in the previous chapter, the
urban and rural domestic water is considered.
Secondly, the demand forecast results are also
adopted for the water consumption of forestry,
WRE 2021 - The International Conference on Water Resource and Environment
116
animal husbandry, fishery and livestock, urban
public and ecological environment. Thirdly, as
agricultural production is given priority in this
scheme, the industrial water consumption is
appropriately reduced.
Based on considering the basic water demand of
urban, rural, and industrial areas, the South-to-North
Water Diversion Project is mainly used for urban life,
and the remaining water resources is calculated under
the target of agricultural water use (Table 11).
Table 11: Water structure of Julu County in the planning period (scheme I).
Unit: 10,000 m
3
Planning period Farmland irrigation Urban life Rural life Industrial water Other water
2025 5553.8 993.7 158.68 476.04 1348.78
2035 5653.52 1012.7 166.28 665.12 1413.38
4.2 Give Priority to Meeting Urban
Domestic Water Demand (Scheme
Ⅱ)
Different from the first scheme, the agricultural
irrigation water demand is determined firstly, and
the industrial water consumption will be increased to
a certain extent by giving priority to urban domestic
water. However, the industrial water consumption in
this scheme does not exceed the maximum value.
Considering the medium water generated by the
increase of urban domestic and industrial water can
be used for urban environment, other water
consumption in this scheme is also increased based
on demand. Similarly, considering the feasibility of
water-saving measures, the agricultural irrigation
demand is predicted to rise by about 10% in the
previous chapters.
Based on considering the basic water demand of
agriculture and rural areas, the proportion of
industrial water and ecological water is moderately
increased under the premise that the water
transferred from south to north is mainly used for
urban life, and the remaining water resources are all
classified as urban domestic water. The water
consumption in this method is also adjusted along
with the industrial water consumption in cities and
towns (Table 12).
Table 12: Water consumption structure of Julu County in planning period (Scheme II).
Unit: 10,000 m
3
Planning period Farmland irrigation Urban life Rural life Industrial water Other water
2025 5496.52 1009.38 247.43 577.33 1649.52
2035 4791.51 1365.20 256.07 768.20 2048.54
4.3 Give Priority to Rural Domestic
Water (Scheme Ⅲ)
Different from the former two schemes, this scheme
does not take urban life as the only purpose of the
south to North Water Diversion Project, but puts it
into the overall consideration of the total water
resources. Moreover, the rural domestic water
consumption is close to the limit value of rural
domestic demand, and the urban domestic water
consumption will be reduced accordingly. Different
from urban residents, rural villagers will still take
agriculture, fruit, animal husbandry and other
industries as the main employment areas, so the
production water consumption will also increase.
Based on the consideration of the basic water
demand of urban life, rural life and industry, this
scheme is calculated under the goal of classifying all
the remaining water resources as agricultural water
use (Table 13).
Table 13: Water consumption structure of Julu County in planning period (Scheme Ⅲ).
Unit: 10,000 m
3
Planning period Farmland irrigation Urban life Rural life Industrial water Other water
2025 5374.53 511.86 426.55 511.86 1706.20
2035 4901.05 891.10 445.55 712.88 1960.42
Study on Evaluation of Water Resources Carrying Capacity based on Supply and Demand Balance Analysis: Take Julu County, Hebei
Province as an Example
117
4.4 Water Resources Structure
Optimization Scheme
(Recommended Scheme)
Based on the above three schemes, the South-to-
North Water Diversion Project is still mainly used
for urban life, and the water consumption of all
walks of life is coordinated on the basis of
comprehensive consideration of basic demand and
the highest scheme (Table 14).
Table 14: Water structure of Julu County in the planning period (Recommended Scheme).
Unit: 10,000 m
3
Planning period Farmland irrigation Urban life Rural life Industrial water Other water
2025 5248.62 879.62 444.11 484.49 1614.96
2035 5052.24 1228.53 378.92 673.63 1684.08
5 WATER RESOURCES
CARRYING CAPACITY
CALCULATION
5.1 Agricultural Carrying Capacity
According to the above calculation results, the
maximum theoretical scale of farmland irrigation
will be 69,291,800 m
3
and 73,091,800 m
3
by 2025
and 2035 respectively. According to the scheme of
giving priority to agricultural production water, the
total amount of agricultural irrigation water will be
55,540,000 m
3
and 56,540,000 m
3
by 2025 and 2035
respectively. The calculation of water resources
structure optimization scheme will be carried out, by
2025 and 2035, the total amount of agricultural
irrigation water will be 52,486,200 m
3
and
50,522,400 m
3
respectively.
According to the provisions of water consumption
quota for agriculture in Hebei Province (DB 13 / T
1161.1-2016), the representative crops in Julu
County are corn, wheat, cotton and barbarum.
Considering the different planting structure, multiple
cropping situation, irrigation method and effective
utilization coefficient of farmland irrigation water,
the irrigation quota of Julu County is determined to
be 1545 m
3
/ hectares (Table 15).
Table 15: Planting Area.
Unit: hectares
Particular year Corn Wheat Cotton Wolfberry Honeysuckle
2010 12678 16156 12964
2011 12647 16011 13321 3988 5200
2012 12776 16067 12869 3921 5207
2013 12743 16347 12777 3812 5135
2014 13931 16153 11735
2015 15325 16002 10053 3748 5111
2016 16885 18794 9019 3666 5158
2017 20084 18244 7760
2018 22134 21708 359
2019 18875 18225 351
Reference: Statistical Yearbook of National Economic and Social Development in Julu County (2010-2020)
According to the formula, the bearable irrigation
area = irrigation available water × farmland
comprehensive irrigation quota, the maximum
theoretical scale of bearable cultivated land in Julu
County is 44,849 hectares and 47,309 hectares
respectively. Under the situation of water resource
constraint in 2025 and 2035, the bearable cultivated
land area is 35,947 hectares and 36,593 hectares
respectively. Under the situation of water resources
structure optimization, the maximum theoretical
WRE 2021 - The International Conference on Water Resource and Environment
118

scale of bearable cultivated land in Julu County is
44,849 hectares and 47,309 hectares respectively, by
2025 and 2035. The carrying area of cultivated land
will be 33,972 hectares and 32,701 hectares
respectively.
5.2 Carrying Capacity of Urban
Construction
According to the above calculation results, the
maximum theoretical scale of urban domestic water
will be 4,073,600 m
3
and 5,656,400 m
3
by 2025 and
2035 respectively. According to the calculation of the
scheme to give priority to urban domestic water, the
total amount of urban domestic water will be
10,093,800 m
3
and 13,652,000 m
3
by 2025 and 2035
respectively. The calculation of water resources
structure optimization scheme will be carried out by
2025 and 2035, the total domestic water consumption
will be 8,796,200 m
3
and 12,285,300 m
3
respectively.
According to the data of domestic water
consumption and urban population of Julu County
from 2011 to 2018, the average urban domestic
water consumption per capita in recent five years is
about 24 L / person ꞏ day. According to the water
consumption quota of Hebei Province (DB 13 / T
1161.1-2016), the values of 50, 80, 110 or 140 can
be taken according to whether there are drainage,
sanitary facilities and shower facilities in the room.
To sum up, 50 and 80 are determined as the values
of two domestic water consumption schemes, i.e. the
per capita domestic water consumption is 18 m
3
/
year and 29 m
3
/ year.
According to the calculation formula, the carrying
urban population = urban domestic water / per capita
urban domestic
water consumption, the bearable
urban construction area = bearable population × per
capita urban construction land. According to the per
capita urban construction land index 106.35m
2
determined by Xingtai City, the maximum
theoretical scale of urban construction land in Julu
County is 1,484 hectares and 2,060 hectares
respectively. Under the situation of giving priority to
urban domestic water use, the carrying capacity of
urban construction land in 2025 and 2035 will be
3,676 hectares and 4,972 hectares respectively. In
the context of water resource’s structure
optimization, the carrying capacity of urban
construction land will be 3,204 hectares and 4,474
hectares by 2025 and 2035 respectively.
5.3 Carrying Capacity of Village
Construction
According to the above calculation results, the
maximum theoretical scale of rural domestic water
will be 5,706,400 m
3
and 7,923,600 m
3
by 2025 and
2035 respectively. According to the scheme of
giving priority to agricultural and rural domestic
water, the total amount of rural domestic water will
be 4,270,000 m
3
and 4,460,000 m
3
by 2025 and 2035
respectively. The calculation of water resource’s
structure optimization scheme will be carried out by
2025 and 2035, the total amount of rural domestic
water will be 4,441,100 m
3
and 3,789,200 m
3
respectively.
According to the domestic water consumption and
resident population data of Julu County from 2014
to 2018, the average domestic water consumption
per capita in recent five years is about 32 L / person
ꞏ day. According to the water consumption quota of
Hebei Province (DB 13 / T 1161.1-2016), the values
of 50, 80, 110 or 140 can be taken according to
whether there are drainage, sanitary facilities and
shower facilities in the room. To sum up, 60 is
determined as the value of rural domestic water
consumption scheme, that is, the rural domestic
water consumption per capita is about 22 m
3
/ year.
According to the calculation formula, the carrying
rural population = rural domestic water consumption
/ per capita rural domestic water consumption, and
the bearing village construction area = bearable
population × per capita village construction land.
According to the per capita village construction land
of 199.58m
2
, the maximum theoretical scale of
village construction land in Julu County is 5,201
hectares and 7,221 hectares respectively. The results
show that the village construction land scale of Julu
County in 2025 and 2035 is 3,887 hectares and
4,060 hectares respectively. In the context of water
resources structure optimization, the village
construction land scale in 2025 and 2035 will be
4,047 hectares and 3,453 hectares respectively.
5.4 Industrial Bearing Capacity
It is estimated that by 2025 and 2035, the industrial
water consumption will be 4,844,900 m
3
and
6,736,300 m
3
, accounting for 6% and 8% of the total
water supply.
In recent 4 years, the average water consumption
per 10,000 RMB of industrial added value is 9.32 m
3
/ 10,000 RMB. According to Xingtai's water
resources management system, after adopting water-
saving facilities, the water consumption per 10,000
Study on Evaluation of Water Resources Carrying Capacity based on Supply and Demand Balance Analysis: Take Julu County, Hebei
Province as an Example
119
RMB of industrial added value in Julu County in the
planning period is 9 m
3
, the consumption per unit
GDP is controlled below 50 m
2
/10,000 RMB, and
the proportion of industrial land in urban
construction land accounts for about 30%.
According to the calculation formula, the
industrial bearing capacity = total industrial added
value / per unit GDP water consumption (Xing
et al.,
2019). The industrial added value that Julu County
carried in 2025 and 2035 are 5,383,000,000 RMB
and 7,485,000,000 RMB respectively. Besides urban
construction land, the scale of industrial land that
can be carried is 1,731 hectares and 2,401 hectares
respectively.
5.5 Comprehensive Carrying Capacity
of Water Resources
Based on the optimization scheme of water
resource’s structure calculated in previous chapters,
farmland irrigation quota, urban domestic water
quota and rural domestic water quota, the
comprehensive carrying capacity of water resources
is calculated as follows (Table 16).
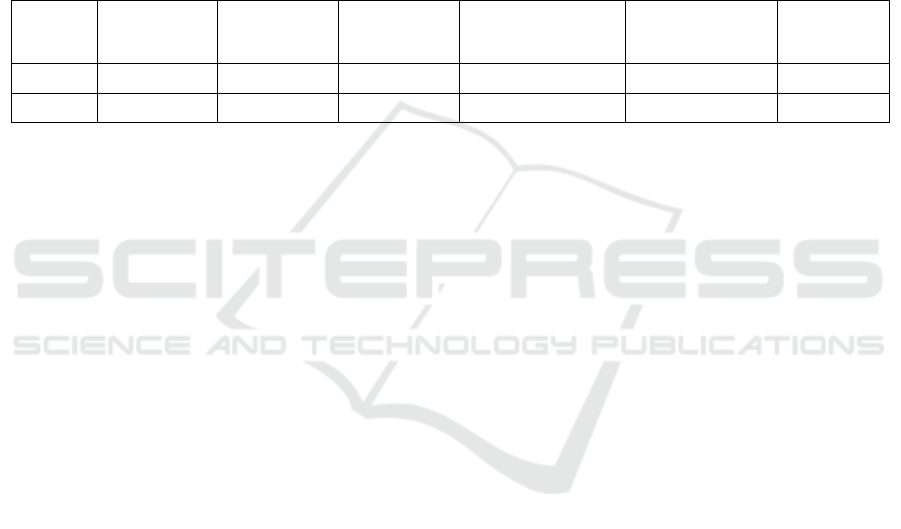
Table 16: Comprehensive Carrying Capacity of Water Resources in Julu County.
Unit: ten thousand people, hectares
Planning
period
Cultivated
land scale
Urban
population
Rural
population
Urban construction
Land use
village
construction
Land use
Industrial
land
2025 33971.65 30.12 20.28 3203.68 4047.32 1731
2035 32700.58 42.07 17.30 4474.46 3453.17 2401
6 COUNTERMEASURES
6.1 Vigorously Promote Water-Saving
Irrigation Measures and Build a
Water-Saving Agricultural
Development Model
Strengthen the integration, assembly and matching
of agronomy and farmland basic engineering
technology, establish a technological innovation and
service platform for dry farming water-saving
agriculture, carry out original innovation, integrated
innovation, introduction, digestion, absorption and
re-innovation of dry farming water-saving
agriculture technology, vigorously promote
technological progress of dry farming water-saving
agriculture, and improve the technical support
system for the development of dry farming water-
saving agriculture. Actively promote the application
of subsoiling, increasing the application of organic
fertilizer, straw returning and other mulching
technologies, conservation tillage technology,
promote water-saving and high-efficiency farming
and cultivation mode, enhance soil water storage
capacity, and reduce water consumption. Efforts will
be made to improve the modern material and
equipment level of drought resistance and water
saving, improve the water delivery system, further
strengthen the construction of low-pressure
pipelines, water source projects and other facilities,
and demonstrate and popularize water-saving modes
such as drip irrigation under plastic film and
irrigation and drainage of underground canals, so as
to reduce water delivery losses and achieve water
saving and efficiency improvement.
6.2 Promote the Adjustment of
Industrial Structure and Relieve
the Pressure of Water Resources
System
Industry is usually the main source of pollution, and
it is also one of the departments with a large
consumption of water resources. In the case that
agricultural irrigation water is difficult to be greatly
reduced, industrial layout optimization has become
an important starting point for industrial structure
adjustment. Therefore, it is necessary to deeply
analyze the consumption and demand of water
resources in various industries, and evaluate the
local water resources carrying capacity, water
environment capacity and land resources carrying
capacity under different industrial development
modes, so as to determine the reasonable scale of
industry and population.
WRE 2021 - The International Conference on Water Resource and Environment
120

6.3 Realize the Recycling of Water
Resources and Effectively Improve
the Supply and Utilization
Efficiency
The recycling of urban water resources is closely
related to natural environment, social environment
and economic environment. It is necessary to
manage regional water resources, water environment
and water ecology, and rationally develop and utilize
water resources. Advocate water conservation,
vigorously promote water-saving appliances, and
combine price management measures to
appropriately increase water prices and reduce
excessive use of domestic water. At the same time,
we should take active measures to control the
production water, encourage the recycling of water
resources, improve the utilization rate of water
resources, make full use of rainwater resources,
expand available water sources and promote the
recycling of urban water resources.
7 RESULTS AND DISCUSSIONS
The results show that the total available water
resources at the end of the planning period in the
case area is 89.11 million m, including surface
water, groundwater, water transfer from the South-
to-North Water Transfer Project and the Yellow
River Diversion Project to Hebei, and reclaimed
water reuse. Based on the results of linear and
nonlinear regression analysis, considering the social
and economic development goals and measures of
saving and intensive water use, the total water
demand at the end of the planning period of the case
area is 76.74 million m
3
. After simulating the
balance scheme of water supply and demand in three
scenarios, i.e. giving priority to agricultural
production water, urban domestic water and rural
domestic water, the optimal allocation scheme of
water resources structure was formed, and then the
comprehensive carrying capacity of water resources
was calculated, including urban population of
420,700, rural population of 173,000, cultivated land
of 32,700 hectares, urban construction land of 4,474
hectares, village construction land of 3,453 hectares
and industrial land of 2,401 hectares.
The framework of water resources carrying
capacity calculation based on the analysis of supply
and demand balance, which is constructed in this
paper, has achieved the rigid constraint goal of
"determining city, land, people and output by water"
through four steps: "resource endowment analysis-
pressure state analysis-supply and demand balance
analysis-carrying capacity calculation". However,
this model has only been tried in some areas in the
middle and south of Hebei Province. With the
expansion of its application scope, the setting basis
of various parameters, the comparison index of
various models, balance analysis and structural
optimization methods in this system need to be
improved.
ACKNOWLEDGEMENT
We would like to acknowledge the Scientific
Research Project of Beijing Municipal Education
Commission (Grant No. KM201911418001).
REFERENCES
Du, X. F., Li, Y. B., & Zhang, X. Y. (2020). Study on
water resources carrying capacity of ecological
diversion irrigation district in the lower reaches of the
Yellow River. Hydro-Science and Engineering, 2, 22-
29.
Li, J. X., Fu, Y. H., Zhang, D. J., & Ding, J. H. (2020).
Evaluating Carrying Capacity of Water Resources in
the Rocky Desertification Regions in Yunnan
Province. Journal of Irrigation and Drainage, 39(12),
128-135.
Liu, Y. J., Lu, C. X., & Huang, S. L. (2020).
Comprehensive assessment of water resources
carrying capacity in the northwest Beijing-Tianjin-
Hebei agro-pastoral ecotone. Pratacultural Science,
37(7), 1302-1312.
Ma, Z. G., Li, L. L. & Yang, R. T. (2020). The research
status and analysis on the environmental and resource
capacity. Chinese Journal of Agricultural Resources
and Regional Planning, 41(3), 130-137.
Niu, F. Q., Yang, X. Y., & Sun,D. Q. (2020). Water and
Soil Carrying Capacity and Adjustment of Industrial
Structure in Hainan Province. Tropical Geography,
40(6), 1109-1116.
Song, Z., Le, Q. L., Chen, X. Y., Yang, N., & Huang, T. J.
(2021). A preliminary study on the evaluation method
of water resource carrying capacity and its application
in "Four fixed by water". Sedimentary Geology and
Tethyan Geology, 1, 106-111.
Tang, A. Z., & He, S. H. (2021). Diagnostic Identification
and Set Pair Analysis of Evolution of Water Resources
Carrying Capacity in Guiyang City. China Rural
Water and Hydropower, 1, 76-83.
Wang, P. L., Song, X. Y., Xu, B. X., Wang, Q. H., &
Wang, B. (2020). Evaluation and advancement of
water resources carrying capacity of Zhangye
Prefecture in Heihe River basin. Journal of Glaciology
Study on Evaluation of Water Resources Carrying Capacity based on Supply and Demand Balance Analysis: Take Julu County, Hebei
Province as an Example
121

and Geocryology, 42(3), 1057-1066.
Xing, J., Zhou, L. G., Jin, J. L., & Cheng, Q. P. (2019).
Evaluation on water resources carrying capacity in
Jianghuai watershed based on system structure model.
Yangtze River, 50(7), 110-117.
Zeng, W. L., & Jing, Y. Y. (2021). Wenlu, Jing Yangyang.
Multi - scenario system simulation analysis on
recycling of urban water resources. Yangtze River,
52(1), 83-89.
Zhang, M. X., Lu, C. X., Wu, Y. H., & Xia, J. X. (2020).
Analysis of water resources carrying capacity in
Chongli District, Zhangjiakou City, Hebei Province
based on supply-demand balance of water resources.
Bulletin of Soil and Water Conservation, 40(1), 276-
282.
Zhang, X. Y., Du, X. F., Xu, J. X., & Zhang, Z. Q. (2019).
Analysis of Water Resources Carrying Capacity in
Dagong Yellow River Diversion Irrigation Area Based
on Ecology. Yellow River, 41(6), 49-53.
WRE 2021 - The International Conference on Water Resource and Environment
122
