
Study on Change Trend of Monthly Grid Precipitation in China
Yujie Li
1,2
, Jiliang Xu
1
, Fen Zhou
1
, Jing Wei
1
, Yunqing Hou
1
, Bo Li
1
, Lijie Shan
1, *
, and Hongjie Yu
1
1
Zhejiang Design Institute of Water Conservancy and Hydroelectric Power, Zhejiang Hangzhou 310002, China
2
Zhejiang University College of Civil Engineering and Architecture, Zhejiang Hangzhou 310058, China
Keywords: Monthly Grid Precipitation, Change Trend, China
Abstract:
In this paper, a set of monthly grid precipitation data CN05.1 with spatial resolution of 0.5 degrees and time
scale from 1982 to 2015 is used, and three improved Mann-Kendal test methods (M-MK, PW-MK and
TFPW-MK) are used to test the trend change of the whole country and six regions in north China, northeast
China, east China, south central, southwest China and northwest China. The results show that the monthly
grid precipitation does not show a significant and consistent change trend in most areas, especially in most
densely populated areas such as North China, Central South China and East China, showing a relatively
stable trend during this period, except for a few areas which have a significant upward or downward trend in
individual months.
1 INTRODUCTION
The China has a vast territory, high terrain in the
west and low terrain in the east, complicated
topography, crisscrossing water systems and
remarkable monsoon climate, which leads to great
changes in monthly precipitation between years and
years, and extremely uneven distribution of time and
space. At the same time, under the climate change
background dominated by the gradual increase of
global average temperature, it is likely to gradually
change the water cycle process of atmosphere-land-
ocean, which will lead to the further increase of
seasonal and regional differences in precipitation
frequency, intensity, area, total amount and duration
(Liang et al., 2018; Li et al., 2020; Xie et al., 2021;
Bennett et al., 2016).
Moreover, for the temporal and spatial variation
and precipitation distribution, the previous studies
have mainly focused on the analysis of the
frequency of extreme precipitation
(Wang & Zhou,
2005), the variation characteristics in a single period
(Li et al., 2016), and the evolution trend of local
areas (Qian et al., 2005). Above research may have
some shortcomings such as lack of attention to less
precipitation seasons and relatively limited coverage
areas. Therefore, it is necessary to use a set of
precipitation data with suitable time series and high
resolution to make further in-depth analysis of the
total precipitation in China during the whole period
and in the whole region. Based on the above
considerations, this paper uses a set of monthly
precipitation grid data with spatial resolution of 0.5
degrees and time scale of 1982-2015, and carries out
trend analysis and test on the whole of China and six
regions of North China, Northeast China, East
China, Central South, Southwest China and
Northwest China according to three improved
Mann-Kendal test methods (M-MK, PW-MK and
TFPW-MK), in order to find out the monthly grid of
China.
2 DATA
The measured grid data set CN05.1 was used in this
study (Wu et al., 2012). The time scale of this
dataset is from 1982 to 2015, and the spatial
resolution is 0.5×0.5 degree, with a total of 3781
grid points. CN05.1 based on the daily data of more
than 2,400 meteorological observation stations
(including national reference climate stations,
national basic weather stations and national general
weather stations) distributed all over the country,
interpolation calculation is carried out by anomaly
approximation method, and its production method
and performance evaluation can be referred to
reference (Wu et al., 2012), which will not be
carried out here. At the same time, in order to study
the distribution characteristics of monthly
Li, Y., Xu, J., Zhou, F., Wei, J., Hou, Y., Li, B., Shan, L. and Yu, H.
Study on Change Trend of Monthly Grid Precipitation in China.
In Proceedings of the 7th International Conference on Water Resource and Environment (WRE 2021), pages 69-75
ISBN: 978-989-758-560-9; ISSN: 1755-1315
Copyright
c
2022 by SCITEPRESS – Science and Technology Publications, Lda. All rights reserved
69

precipitation in China in detail, China is divided into
six geographical regions, namely North China,
Northeast China, East China, Central South,
Southwest China and Northwest China, which
correspond to 661, 355, 293, 360, 860 and 1252 grid
points respectively.
3 METHODOLOGY
3.1 Mann-Kendall Test
Mann-Kendall test (MK) is a method recommended
by WMO to test the trend and significance of
meteorological and hydrological time series (Mann,
1945; Kendall, 1948). As a nonparametric test
method, MK is widely used in meteorological-
hydrological and other element tests which are
skewed and often do not obey the same distribution
because it does not require the sample sequence to
obey a specific distribution and is less interfered by
outliers. A set of observations for a given
meteorological-hydrological variable 𝑋
𝑥
,𝑥
,…,𝑥
; the definition of statistic S of MK
test method is as follows:
1
1
= sgn
1
sgn = 0
-1
nn
ji
iji
ji
ji j i
ji
Sxx
x
x
x
xxx
x
x
(1)
When 𝑛10, statistics 𝑆 can be considered as
approximately obeying normal distribution, namely:
1
0
12 5 12 5
18
k
ii i
i
ES
nn n m m m
DS
(2)
where 𝑘 is the number of groups with the same
numerical value in the sample sequence, and 𝑚
is
the number of the same numerical value in the 𝑖
group, so that the standard normal distribution
statistics 𝑈
can be obtained:
1
0
00
1
0
MK
S
S
DS
US
S
S
DS
(3)
The original hypothesis is that the sample
sequence has no change trend. At the significance
level
, the two-sided test is adopted. When
|
𝑈
|
𝑈
/
, the original hypothesis is accepted,
the sample sequence has no significant trend; When
|
𝑈
|
𝑈
/
, the original hypothesis is rejected
and the sample sequence has a significant trend.
when 𝑆0, the sample sequence has an upward
trend; When 𝑆0, the sample sequence has a
downward trend. 𝑈
/
is the quantile of 𝛼/2 in the
standard normal distribution.
The original hypothesis of MK test method is
based on the mutual independence of sample
sequences, but in meteorological-hydrological
element sample sequences, there is a certain degree
of autocorrelation. In order to reduce the influence
of autocorrelation on trend analysis, variance
correction method and pre-removal method are
generally used. Variance correction method mainly
focuses on the mechanism of autocorrelation's
influence on MK test, and proposes corresponding
correction. Pre-removal rule is to remove the
inherent autocorrelation of a sample sequence before
MK test. In order to compare the differences
between the two methods, the paper adopts the
Modified Mann-Kendall Test (M-MK) (Hamed &
Rao, 1998), the Pre-Whitening (PW-MK) (Yue &
Wang, 2002) and the Trend-Free Pre-Whitening
(TFPW-MK) (Yue et al., 2002).
3.2 Modified Mann-Kendall Test
M-MK reconstructs the sample sequence by
subtracting nonparametric trend estimators from the
original sample sequence. Specifically, when
calculating 𝐷
𝑆
, the coefficient 𝐶𝑜𝑟 is introduced
to correct the original sample sequence, and 𝐶𝑜𝑟 is
defined as
[11]
:
WRE 2021 - The International Conference on Water Resource and Environment
70

1
1
2
1112
12
n
i
Cor n n i n i r i
nn n
(4)
In this formula, 𝑟
𝑖
is the autocorrelation
coefficient of order 𝑖 , and 𝑖1 is defined in this
study, and the calculation formula is:
1
1
1
2
1
*
1
n
ii
i
n
i
i
x
xx x
r
xx
DS DS Cor
(5)
3.3 Pre-Whitening Mann-Kendall Test
PW-MK trend test method performs preset
whitening treatment on the original sequence
samples to remove the influence of autocorrelation
on the test results. The specific steps are as follow
(Yue & Wang, 2002):
Step 1: Firstly, the first-order autocorrelation
coefficient 𝑟
1
of sample sequence 𝑋
𝑥
,𝑥
,…,𝑥
is calculated, and under the
confidence level 𝛼, the bilateral significance test of
𝑟
1
is carried out:
1/2 1/2
1212
1
11
Un Un
r
nn
(6)
Step 2: Assuming that the sample sequence
satisfies the first-order autocorrelation process
𝐴𝑅
1
, the preset white method is adopted to
eliminate the autocorrelation of the sample
sequence:
1
1
tt t
X
Xr X
(7)
Step 3: The new sample sequence 𝑋
′
has no first-
order autocorrelation, and then MK is used to test
the trend and significance of the sample sequence.
3.4 Trend-Free Pre-Whitening
Mann-Kendall Test
TFPW-MK includes two processes: trend removal
and preset whitening, which can effectively reduce
the influence of autocorrelation in sequence on
inspection results and avoid inspection errors caused
by distortion. The specific steps are as follows (Yue
et al., 2002):
Step 1: If sample sequence 𝑋
𝑥
,𝑥
,…,𝑥
consists of linear trend and 𝐴𝑅
1
, TSA method is
used to calculate linear trend (inclination) 𝛽 of
sample sequence:
ji
xx
median i j
ji
(8)
Step 2: Removing the trend item 𝑇
to obtain a
new sample sequence 𝑌
without the trend item:
tttt
YXTX t
(9)
Step 3: Calculate the first-order autocorrelation
coefficient 𝑟
of the new sample sequence 𝑌
, and
eliminate the autocorrelation term in 𝑌
:
1
1
tt t
YYr Y
(10)
Step 4: Adding the trend item 𝑇
again to obtain a
new sample sequence 𝑌
″
without autocorrelation
effect:
tttt
YYTY t
(11)
Step 5: Substituting MK method to test the trend
and significance of new sample sequence 𝑌
″
.
4 RESULTS
Using the three improved M-K trend test methods
mentioned above, the annual trend analysis of
monthly precipitation in 3781 grid points in China
from 1982 to 2015 is carried out. The results are
shown in Figure 1 (the upper left corner is marked
with "Jan_M" to indicate the test of M-MK method
in January, the same below), and each grid point
represents the value of the unified measurement S in
the three trend test methods. Light blue
(1.64≤S<2.32) and dark blue (S≥2.32) are defined as
showing a significant upward trend at 95% and 99%
confidence levels respectively (95% is a significant
upward trend, 99% is a very significant upward
trend), light red (-2.32<S≤-1.64) and deep red.
Study on Change Trend of Monthly Grid Precipitation in China
71
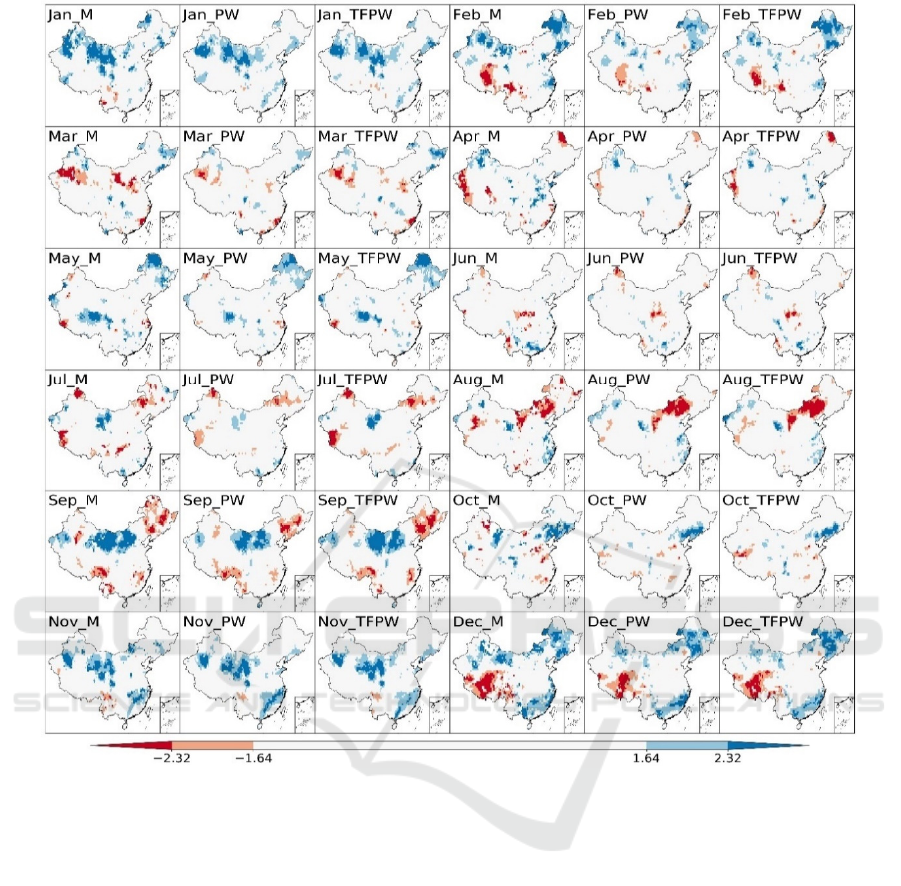
Figure 1: Spatial distribution of test results of three trend analysis methods (M-MK, PW-MK and TFPW-MK).
It can be seen from figure 1 that the three trend
test methods show similar results, and the points
where the trend does not change significantly in all
months are dominant. For example, in January, only
the northwestern and northeastern regions of
Xinjiang showed a significant upward trend; In
April, the areas with significant changes further
decreased, and only the northern part of Xinjiang
showed an increase, while the western part of Tibet
and the northern part of Northeast China showed a
decrease; In July, only the central part of Northeast
China, the northern part of Xinjiang and the western
part of Tibet showed a significant decline, while the
small part of Northeast China in Northwest China
showed a significant increase; In October, only a
small area in the middle of Northeast China showed
a significant increase; In December, most of Tibet
experienced a significant decline in a large area,
while the central part of Northeast China, some parts
of East China and Central South China experienced
a significant increase. In December, most of Tibet
experienced a significant decline in a large area,
while the central part of Northeast China, some parts
of East China and Central South China experienced
a significant increase.
Figure 2 further counts the percentage of M-
MK(a), PW-MK(b) and TFPW-MK(c) in the area
with trend mutation in each month, and (d) shows the
monthly percentage change after the arithmetic
average of the three methods. As far as the national
average is concerned, the minimum, maximum and
average proportions of monthly precipitation
showing an upward trend (including significant and
very significant) are 10.4%, 24.3% and 14.2%
respectively; The minimum, maximum and average
proportions of monthly precipitation show a
WRE 2021 - The International Conference on Water Resource and Environment
72
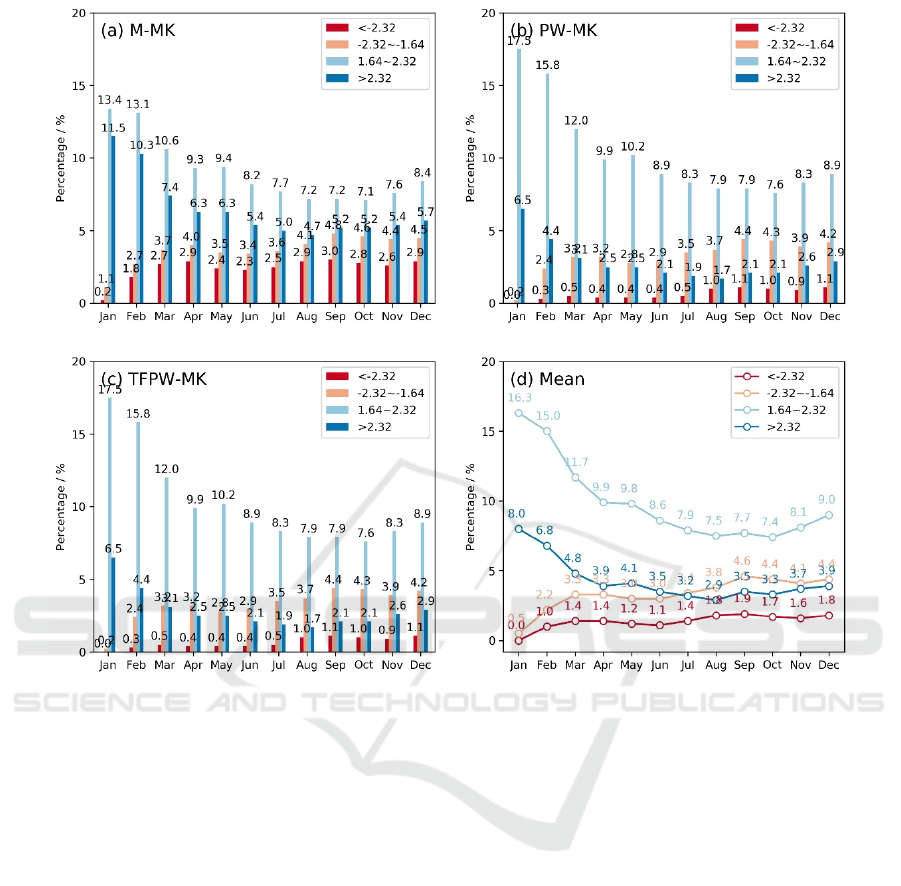
Figure 2: Percentage of three trend analysis methods and their average results in the trend mutation area of each month.
downward trend (including significant and very
significant), which are 0.5%, 6.5% and 4.7%,
respectively, indicating that monthly precipitation
changes are complex and do not show obvious
similar laws, but on the whole, the upward trend is
more significant than the downward trend.
The monthly grid precipitation is accumulated to
get the annual grid precipitation, and the areal
precipitation of each sub region is obtained by
arithmetic average according to the number of grid
points included in six geographical sub regions. The
trend test of each sub region is further carried out by
using linear regression, and the results are shown in
Figure 3, where (a)~(f) are northwest, southwest,
north China, northeast, central south and east China,
and S1~S3 are M-MK, PW-MK and TFPW-
respectively It is not difficult to find that except the
northwest, the other regions have not shown a
significant change trend; However, there are few
meteorological stations in Northwest China, and the
uncertainty of precipitation assessment is large.
During the period of 1982-2015, the monthly grid
precipitation in China did not show a significant and
consistent change trend, especially in most densely
populated areas such as North China, Central South
China and East China, showing a relatively stable
trend.
Study on Change Trend of Monthly Grid Precipitation in China
73
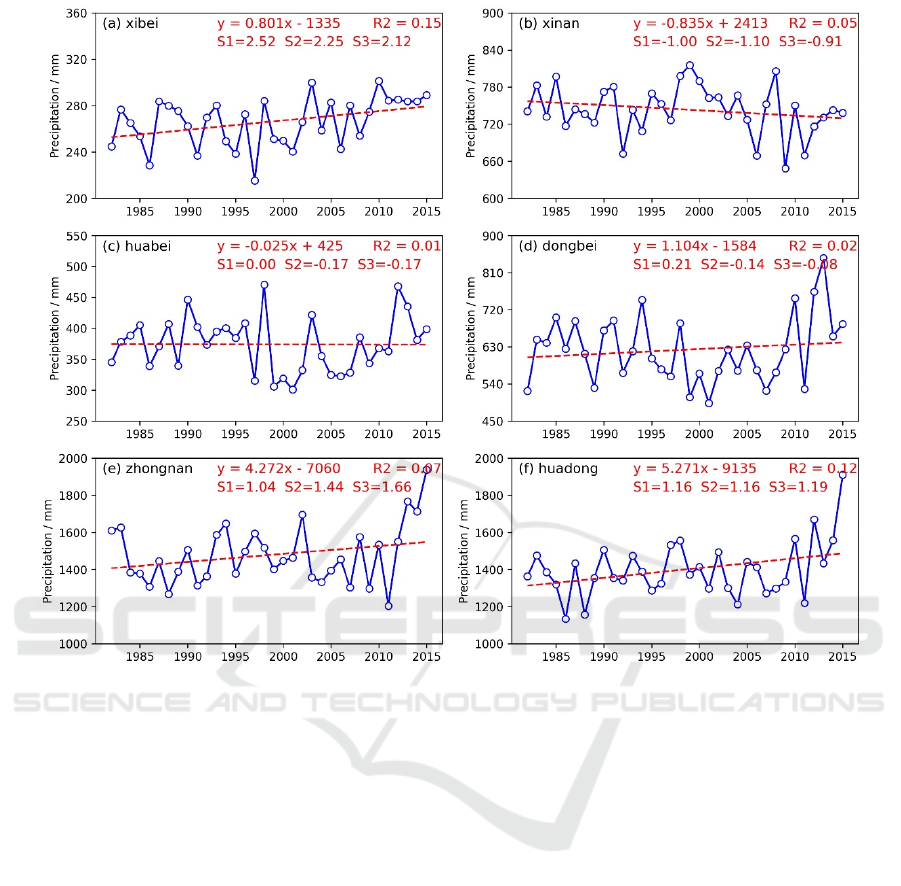
Figure 3: Annual precipitation variation trend in six geographical regions.
5 CONCLUSIONS
In this study, a set of monthly grid precipitation data
CN05.1 with spatial resolution of 0.5 degrees and
time scale of 1982-2015 was used, and three
improved Mann-Kendal test methods (M-MK, PW-
MK, TFPW-MK) were used to test the trend change
of 3781 grid points covering China and six regions
of north China, northeast China, east China, south
central China, southwest China and northwest China
The results show that the spatial-temporal
distribution and inter-annual distribution of
precipitation in China are extremely uneven, which
brings great challenges to accurate and stable
medium-and long-term precipitation forecast. Under
the climate change background of global warming
and frequent extreme events, the monthly grid
precipitation in China did not show a significant and
consistent change trend, especially in most densely
populated areas such as North China, Central South
China and East China, showing a relatively stable
trend, except for a few areas which showed a
significant upward or downward trend in individual
months. In the future research, we will further study
what mutations will occur in local areas and the
reasons for the changes
REFERENCES
Bennett, J. C., Wang, Q. J., Li, M., Robertson, D. E., &
Schepen, A. (2016). Reliable long‐range ensemble
streamflow forecasts: Combining calibrated climate
forecasts with a conceptual runoff model and a staged
error model. Water Resources Research, 52(10), 8238-
8259.
Hamed, K. H., & Rao, A. R. (1998). A modified Mann-
Kendall trend test for autocorrelated data. Journal of
hydrology, 204(1-4), 182-196.
Kendall, M. G. (1948). Rank correlation methods. Oxford:
Oxford University Press.
Li, B., Chen, Y., Chen, Z., Xiong, H., & Lian, L. (2016).
Why does precipitation in northwest China show a
WRE 2021 - The International Conference on Water Resource and Environment
74

significant increasing trend from 1960 to 2010?
Atmospheric Research, 167, 275-284.
Li, Y., Liang, Z., Hu, Y., Li, B., Xu, B., & Wang, D.
(2020). A multi-model integration method for monthly
streamflow prediction: modified stacking ensemble
strategy. Journal of Hydroinformatics, 22(2), 310-326.
Liang, Z., Li, Y., Hu, Y., Li, B., & Wang, J. (2018). A
data-driven SVR model for long-term runoff
prediction and uncertainty analysis based on the
Bayesian framework. Theoretical and Applied
Climatology, 133(1), 137-149.
Mann, H. B. (1945). Nonparametric tests against trend.
Econometrica: Journal of the Econometric Society,
13(3), 245-259.
Qian, W. H., & Lin, X. (2005). Regional trends in recent
precipitation indices in China. Meteorology and
Atmospheric Physics, 90(3), 193-207.
Wang, Y., & Zhou, L. (2005). Observed trends in extreme
precipitation events in China during 1961–2001 and
the associated changes in large ‐ scale circulation.
Geophysical Research Letters, 32(9), L09707.
Wu, J., Gao, X., Giorgi, F., Chen, Z., & Yu, D. (2012).
Climate effects of the Three Gorges Reservoir as
simulated by a high resolution double nested regional
climate model. Quaternary International, 282, 27-36.
Xie, S., Wu, W., Mooser, S., Wang, Q. J., Nathan, R., &
Huang, Y. (2021). Artificial neural network based
hybrid modeling approach for flood inundation
modeling. Journal of Hydrology, 592, 125605.
Yue, S., & Wang, C. Y. (2002). Applicability of
prewhitening to eliminate the influence of serial
correlation on the Mann ‐ Kendall test. Water
resources research, 38(6), 4-1.
Yue, S., Pilon, P., Phinney, B., & Cavadias, G. (2002).
The influence of autocorrelation on the ability to
detect trend in hydrological series. Hydrological
processes, 16(9), 1807-1829.
Study on Change Trend of Monthly Grid Precipitation in China
75
