
Spatial and Temporal Evolution of Precipitation and Runoff in
Mississippi River Basin in Recent 40 Years
Lanshu Jing
1,2,3
, Hongjing Yu
1,2
, Baisha Weng
1,2,*
, Qinghua Luan
4
, and Shanjun Zhang
1
1
State Key Laboratory of Simulation and Regulation of Water Cycle in River Basin, China Institute of Water Resources and
Hydropower Research, Beijing, China
2
Yinshanbeilu National Field Research Station of steppe Eco-hydrological System, China Institute of Water
Resources and Hydropower Research, Baotou, China
3
College of Hydrology and Water Resources, Hohai University, Nanjing, China
4
College of Agricultural Science and Engineering, Hohai University, Nanjing, China
Keywords: Mississippi River, Precipitation, Runoff, Spatial-temporal evolution
Abstract: As the fourth largest river in the world, the spatial and temporal evolution characteristics of precipitation and
runoff of the Mississippi River can provide basic support for the global water cycle. Different from the
analysis of single factor characteristics, this paper comprehensively analysed the spatial distribution
characteristics of annual precipitation, runoff into the sea, runoff of each typical station and runoff coefficient
in the Mississippi River Basin. Long-series precipitation and runoff data were analysed by statistical methods
from three aspects of trend, mutation and periodicity. The results indicated that the annual precipitation
increased from northwest to Southeast, with great spatial differences. The annual precipitation trend increased
from the eastern and western edge areas to the middle. The annual precipitation mutation time generally
delayed from high and low longitude areas to middle longitude areas. The annual precipitation periodicity
was characterized by a longer period in the eastern and western edge areas and a shorter period in the central
area. The runoff of the Missouri River, Kansas river and Illinois River showed a decreasing trend, which was
inconsistent with the trend of precipitation. Overall, the spatial distribution of runoff variation amplitude
showed the characteristics of increasing from the east and west to the middle. The amount of discharge into
the sea generally showed a decreasing trend. From 1970 to 2013, the sudden change fluctuation was large,
the main period was 5a and the secondary period was 10a. The runoff coefficient increased from the west to
the East. The Ohio basin was severely affected by human activities. This study can provide a reference for
the study of large-scale watershed water cycle and even global water cycle.
1 INTRODUCTION
According to the AR5 report of IPCC, the global
average land surface temperature increased from 0.
65 ℃ to 1. 06 ℃ between 1880 and 2012 (IPCC,
2013). It may change the temporal and spatial
distribution of hydrological cycle in the world
(Stonevičius et al., 2017; Teklesadik et al., 2018;
Zhuang et al., 2017). In this regard, the evolution of
precipitation and runoff due to the decline of
changing environment has become a hot issue in the
field of hydrology, water resources and climate
change (Onyutha et al., 2016; Arnell, 1992; Ren et
al., 2015). The Mississippi River is the largest river
across the north and south of the United States. It not
only has an important impact on the regional
economy of the United States, but also is of great
significance to the study of the global water cycle
under the changing environment.
To explore the evolution law and trend change of
hydrological cycle, we mainly focus on the change of
hydrological cycle elements and other related
research (Wang et al., 2016). At present, many
scholars at home and abroad have used a variety of
methods to discuss and study the evolution law and
attribution analysis of water cycle elements (Milly &
Dunne, 2001; Nair et al., 2014, Raj et al., 2012). The
most widely used method is statistical analysis, which
aims to reflect the evolution of hydrological cycle
elements in time and space. Generally, it is analysed
from three aspects: trend, mutation and periodicity.
At present, the trend analysis method is used to
58
Jing, L., Yu, H., Weng, B., Luan, Q. and Zhang, S.
Spatial and Temporal Evolution of Precipitation and Runoff in Mississippi River Basin in Recent 40 Years.
In Proceedings of the 7th International Conference on Water Resource and Environment (WRE 2021), pages 58-64
ISBN: 978-989-758-560-9; ISSN: 1755-1315
Copyright
c
2022 by SCITEPRESS – Science and Technology Publications, Lda. All rights reserved

analyse the trend change characteristics of historical
data of hydrological cycle elements, such as
cumulative anomaly and climate tendency rate
method. Shi et al (2017) analysed and studied the
temporal and spatial variation characteristics of
temperature and precipitation in Henan Province in
recent 50 years by using the method of climate
tendency rate. mutation analysis method is used to
identify the catastrophe characteristics of historical
data of hydrological cycle elements, and Mann
Kendall order detection and sliding t-test methods are
often used. Fan et al used Mann Kendall order
detection method to analyse the climate change trend
in Shiyang River Basin, which provides a decision-
making basis for water resources allocation (Liu et
al., 2017). The periodic analysis method is used to
reveal the periodic characteristics of the historical
data of hydrological cycle elements. Maximum
entropy spectrum method and wavelet analysis
method are often used. Zhao et al (2009) carried out
periodic identification of annual runoff series of 12
stations in Northern Shaanxi based on the analysis
principles of power spectrum and maximum entropy
spectrum. (Shao et al (2006) revealed the complex
multi-time scale structure of precipitation change in
the Yellow River Basin by using wavelet analysis
method, and determined the main periods of each
series.
Under the background of climate change, there are
great differences in the temporal and spatial
distribution of precipitation and runoff in the
Mississippi River Basin. From the perspective of the
whole basin, taking 2016 as the benchmark,
compared with the precipitation and runoff in the past
100 years, the runoff of the Mississippi River Basin
decreased, but the precipitation showed an increasing
trend, and the precipitation and runoff in the East and
west of the basin were quite different (Simon et al.,
2016). For the upper reaches of the Mississippi River,
the upper Mississippi River and Missouri River are
the main agricultural production areas in the United
States (Lund et al., 2012). They were affected by
human activities, the changes of precipitation and
runoff were very related to the agricultural planting
area in this area (Schilling et al., 2015). From 1939 to
2008, the runoff in this area generally increased,
while the runoff in the western Missouri River
decreased (Anderson & Norton, 2007; Hubbart, 2010;
Anderson et al, 2008). Compared with the upper
reaches of the Mississippi River, the precipitation and
runoff in the middle and lower reaches were larger.
Among them, compared with the last century, the
annual maximum precipitation in most areas of the
Ohio River Basin in the middle reaches had increased
significantly, and the range of extreme precipitation
was wider (Munoz & Dee, 2017). In the lower reaches
of the Mississippi River, the river runoff of the
Arkansas River Basin increased, and the lower
reaches were vulnerable to flood (Elgaali & Garcia,
2006).
Most of the studies on precipitation and runoff
factors in the Mississippi River Basin are single
sequence analysis on its sub basin and time scale.
However, there are relatively few comprehensive
studies on the temporal and spatial evolution of
precipitation and runoff in the whole basin.
Therefore, this paper is based on the precipitation and
runoff data of the Mississippi River Basin, builded
spatial analysis platform, combined with the analysis
methods of trend, mutation and periodicity, analysed
precipitation evolution characteristics of 0.5 ° grid,
which can more intuitively reflect the precipitation
evolution law of the basin. On this basis, 13
hydrological stations are selected to analyse their
runoff evolution characteristics and the time
distribution characteristics of runoff coefficient.
Therefore, the spatial evolution of precipitation and
runoff in Mississippi River Basin is summarized,
which provides a reference for the study of
hydrological cycle and rational allocation of water
resources in large-scale watershed.
2 MATERIALS AND METHODS
2.1 Study Area
The Mississippi River Basin is located in the central
United States. The drainage area is 3.2 million km
2
,
accounting for 41% of the land area of the United
States. The drainage area is 112 ° - 80 ° W and 29 ° -
49 ° N with a total length of 6021km. The main
tributaries are Missouri River, Ohio River, Arkansas
River and Red River, and the whole basin is in the
shape of "branches", Figure 1. The basin starts from
the watershed of the Rocky Mountains in the west to
the Appalachian Mountains in the East, and the
central great plain is in the middle. Generally, the
terrain is characterized by "high on both sides and low
in the middle". The basin is divided into two climatic
zones, namely subtropical monsoon climate and
temperate continental climate. The southeast of the
basin is subtropical monsoon climate zone. The
annual precipitation is more than 800mm, and the
highest annual precipitation is about 1710mm. The
rest areas are temperate continental climate areas, and
their annual precipitation is less than 800mm,
Spatial and Temporal Evolution of Precipitation and Runoff in Mississippi River Basin in Recent 40 Years
59
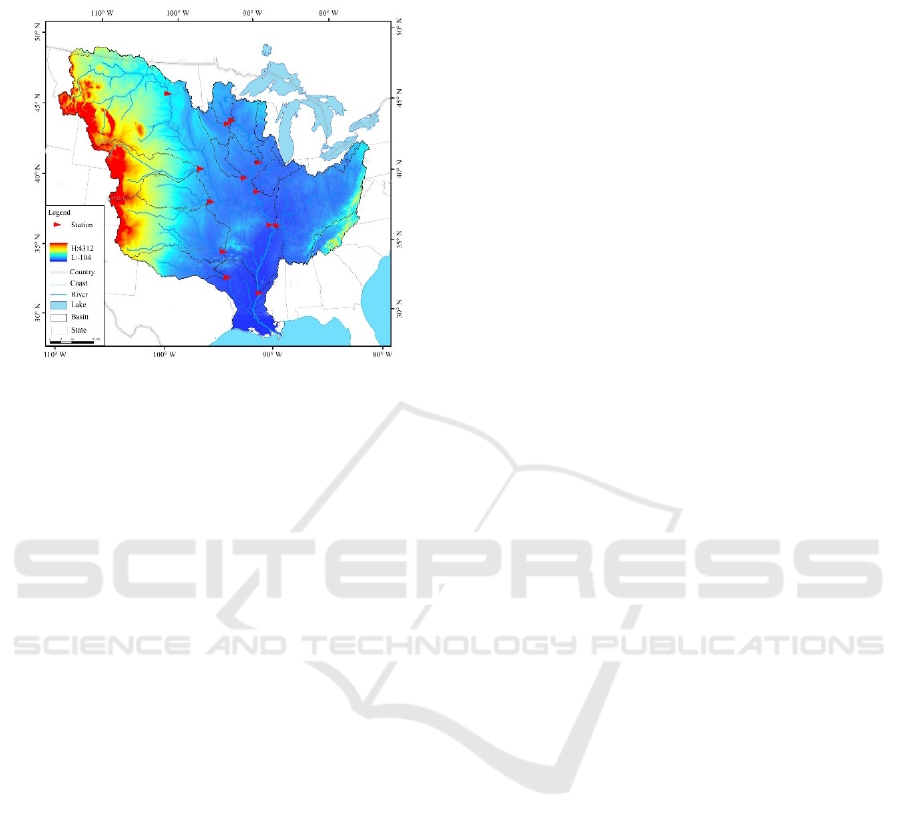
especially in the western region of the basin, the
lowest annual precipitation is only about 126mm.
Figure 1: General situation of Mississippi River Basin.
2.2 Data and Methods
2.2.1 Data Source and Formatting
The precipitation data of Mississippi River Basin is
from the website of Global Precipitation Climate
Project (GPCP). We got the global monthly 0.5 ° from
1901 to 2013 grid precipitation data, and extracted the
monthly grid precipitation data within the Mississippi
River basin to calculate its annual precipitation.
Considering the climate division of Mississippi River
Basin and the division of upstream, middle and
downstream, 13 hydrological stations were selected,
shown in Figure 1. Each station was distributed in the
upper, middle and lower reaches of the Mississippi
River and the tributaries of the Missouri River.
According to the basin range of hydrological stations,
the basin surface precipitation data on the monthly
scale of the selected stations were extracted, and their
annual precipitation was calculated. The runoff data
of the Mississippi River Basin were from the websites
of the U.S. Geological Survey (USGS) and the global
runoff data canter (GRDC), from which the monthly
runoff and annual runoff data of the above 13
hydrological stations from 1970 to 2013 were
obtained respectively.
2.2.2 Treatment Method and Support
Platform
This paper constructed a spatial analysis platform
based on ArcGIS and MATLAB software to analyse
the spatial distribution characteristics of multi-year
average precipitation, trend and mutation in the
Mississippi River Basin. Multi-year average
precipitation of 0.5 ° grid was calculated, and the
results were converted into ASCII text. The final
results were readied by ArcGIS software to make the
spatial distribution map of multi-year precipitation.
Based on this, combined with the precipitation
tendency rate and the M-K test calculation method,
the trend and mutation characteristics of its spatial
distribution were calculated respectively (Liang et al.,
2015; Zhang et al., 2016; Han et al., 2013). In order
to verify the rationality of precipitation spatial
analysis and analyse the evolution characteristics of
runoff, cubic spline method and cumulative anomaly
method were used to analyse and analysed its trend
(Sun et al., 2012). Mann Kendall method was used to
analyse its mutagenicity (Yan & Weng, 2016). The
maximum entropy spectrum method and wavelet
analysis method were selected to analyse its
periodicity (Modern et al., 1999).
3 RESULTS AND DISCUSSION
3.1 Analysis of Precipitation Evolution
Characteristics
3.1.1 General Situation and Spatial
Distribution Characteristics of
Precipitation
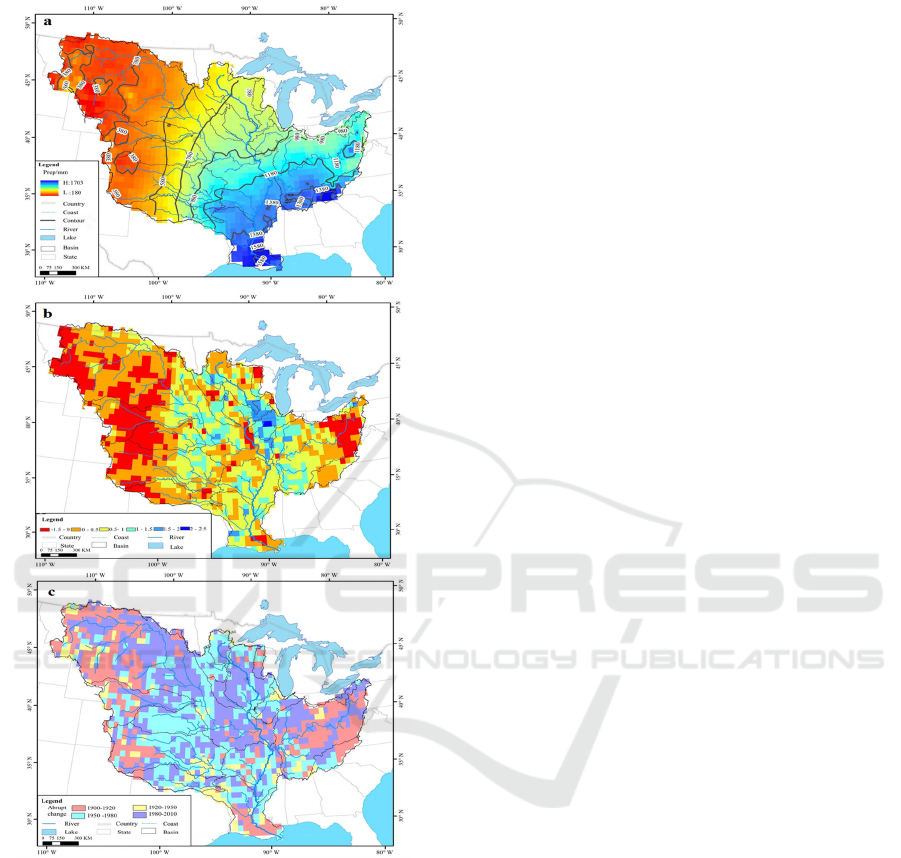
Figure 2(a) shows the spatial distribution of multi-
year average precipitation in the Mississippi River
Basin. It can be seen from the spatial pattern
distribution that the multi-year average precipitation
in the Mississippi River Basin increases from
northwest to southeast. The high value area of multi-
year average precipitation is mainly concentrated in
the southeast of the basin, which is more than 800mm,
especially in the lower reaches of Mississippi River
and Tennessee River Basin. The low value area of
multi-year average precipitation is mainly
concentrated in the northwest of the basin, all below
200mm, especially in the upper reaches of Missouri
River, the lowest multi-year average precipitation is
only 177mm. The difference between the maximum
and minimum annual average precipitation is
1526mm, which shows that the spatial distribution of
precipitation in the Mississippi River Basin is very
different, which may be caused by the great impact of
climate change and human activities (Xi et al., 2014;
Milly, 2005).
WRE 2021 - The International Conference on Water Resource and Environment
60
3.1.2 Trend and Spatial Change
Figure 2: a.
Spatial distribution of annual precipitation in
Mississippi River Basin. b.
Distribution of precipitation
spatial tendency rate in Mississippi River Basin. c.
Spatial
analysis of abrupt change in Mississippi River Basin.
Figure 2(b) shows the distribution of precipitation
tendency rate in the Mississippi River Basin, and its
spatial distribution is characterized by decreasing
from the east and west sides to the middle. The central
region is the rising area of annual precipitation,
especially in the middle and upper Illinois River
Basin, the tendency rate is the highest, and the rising
range is 2.5mm/10a. The tendency rate of the eastern
and western marginal areas is the area where the
annual precipitation decreases, especially in the
Kansas River and Platte River basins in the northwest,
the precipitation tendency rate is the lowest, and the
decline range is -0.8mm/10a. In addition, combined
with the cubic spline trend analysis method, this paper
analyses the variation trend of surface precipitation
controlled by 13 hydrological stations, and its spatial
distribution characteristics are basically consistent
with the above analysis. Figures 3(a), Among them,
the station with the largest increase is MS station.
From 1901 to 2013, which shows an overall increase
trend, with an increase range of 16.2mm/10a. The
station with the largest decrease range is MP station.
From 1901 to 2013, which shows a decreasing trend,
with a decreasing range of 0.7mm/10a.
3.1.3 Mutation and Spatial Variation
The spatial distribution of mutation time is shown in
Figure 2(c). The mutation time on the east and west
sides of the Mississippi River Basin is earlier than that
in the middle, that is, the mutation time is generally
delayed from high and low longitude areas to middle
longitude areas. The mutation time of the eastern and
western marginal regions mostly occurred between
1900 and 1920, the mutation time of the central
region mostly occurred between 1950 and 1980, and
the mutation time of the central and western regions
mostly occurred between 1950 and 2010. Combined
with the catastrophe analysis within the watershed of
each hydrological station, four stations are selected in
the upper, middle, lower reaches and Missouri River
area for verification, The mutation time of MS station
in the upstream area is 1973, MP station in the
Missouri River area is 1965, MT station in the middle
reaches of the Mississippi River is 1977, and VIC
station in the downstream area is 1972. The results
show that its spatial distribution characteristics are
consistent with the spatial analysis.
3.1.4 Periodicity and Spatial Variation
According to the distribution of selected stations in
the Mississippi River Basin, combined with the
maximum entropy spectrum method and wavelet
analysis method, the periodicity of 13 hydrological
stations is analysed. It can be seen that their
distribution characteristics are the characteristics of
longer period in the eastern and western edge areas
and shorter period in the central area. Figures 3(b)
show the precipitation wavelet analysis results of the
upper Mississippi River region. The MS station in the
upper reaches has the strongest oscillation scale of 3-
5a from 1970 to 1990. Combined with the analysis
results of the maximum entropy spectrum method, the
peak spectral density is 3a, and its main period is 3a.
Spatial and Temporal Evolution of Precipitation and Runoff in Mississippi River Basin in Recent 40 Years
61
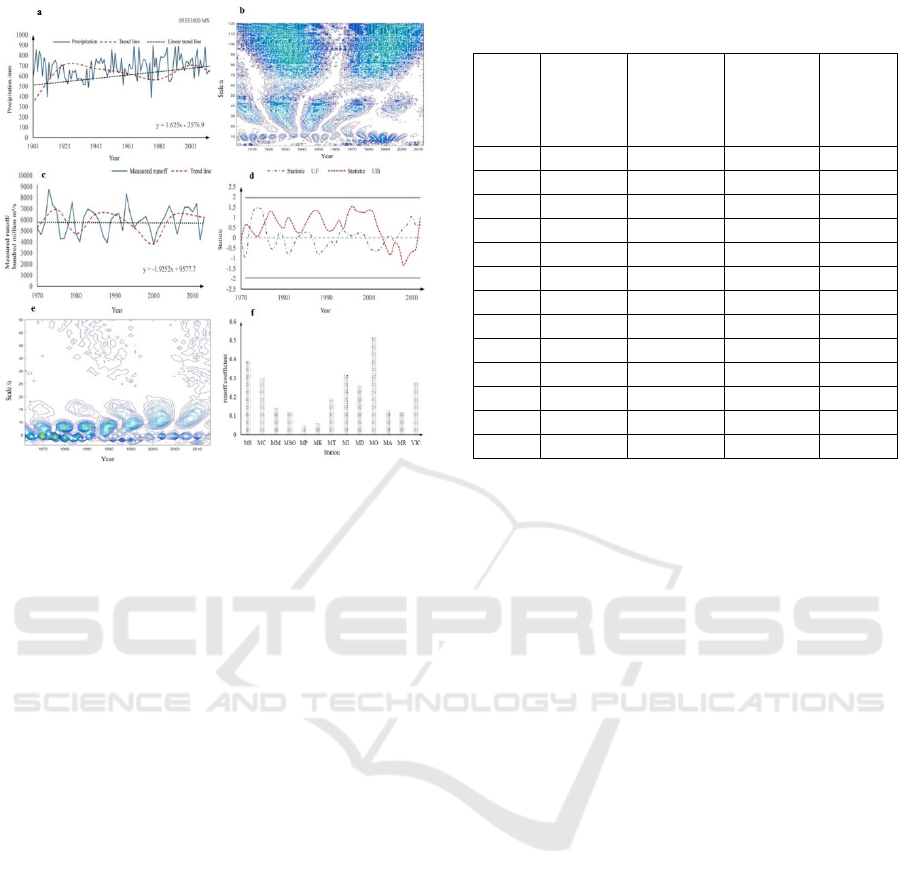
Figure 3: a. Cubic spline analysis of precipitation at MS
precipitation station. b.
Wavelet analysis of precipitation in
the upper Mississippi River. c, d.
Interannual variation and
M-K analysis of annual runoff at sea inlet station. e.
Analysis of maximum entropy spectrum and wavelet
analysis of annual runoff at sea inlet station f.
Runoff
coefficient of each station.
3.2 Runoff Variation Characteristics
In addition to the runoff into the sea, the interannual
variation characteristics of the runoff of the other 12
hydrological stations from 1970 to 2013 are listed in
Table 1. It can be seen that the runoff of MSO (- 254
million m
3
/ a) and MK (- 47 million m
3
/ a) in the
west of MS shows a decreasing trend, which is
inconsistent with the precipitation trend (Qian et al.,
2007). It may be that the MSO and MK basins are
located in semi-arid areas, with large annual
evaporation, and increased water intake and
consumption for agriculture and industry. The runoff
of MP (- 25 million m
3
/ a) shows a decreasing trend,
which may be caused by the decrease of precipitation.
The runoff of MA (- 56 million m
3
/ a) and MR (- 192
million m
3
/ a) in the western area of the lower MS
also shows a decreasing trend, which is inconsistent
with the precipitation trend, which may be the
increase of water intake caused by the westward
migration of the American population (Griffin &
Friedman, 2017). Although the precipitation of the
MI in the eastern region shows an increasing trend,
the runoff shows a decreasing trend, which is caused
by land cover change (Knight et al., 2012; Tayyebi et
al., 2015).
Table 1: Interannual runoff variation characteristics of
hydrological stations in Mississippi River Basin.
River
Runoff
Trend
Variation
range
/million
m
3
·a-1
Mutation
time
Main
cycle/a
MS increase 10.35 1982 9
MM increase 0.50 1982 8
MD increase 1.88 1982 9
MC increase 29.00 1981 9
MI reduce -1.16 1983 7
MP increase 0.10 1977 11
MK increase 1.07 2000 6
MSO reduce -34.72 1984 15
MO reduce -100.12 1982 6
MT increase -11.24 1982 9
MA reduce -48.80 1981 9
MR reduce -13.86 1973 9
MS increase 10.35 1982 9
Figure 3(c) respectively shows the annual change
of runoff and the change process of cumulative
anomaly value of estuary hydrological station (VIC)
from 1970 to 2013. It can be seen that the average
annual seawater inflow is 595.7 billion m
3
, the
maximum seawater inflow is 877 billion m
3
and the
minimum seawater inflow is 381.7 billion m
3
.
Combined with the analysis results of cubic spline
method, the water entering the sea shows a change
process of "increase-decrease-increase-decrease-
increase-increase", but the water entering the sea
shows a decreasing trend (192 million m
3
/ a) from
1970 to 2013. Figure 3(d) shows the change trend
analysed by Mann-Kendell method at the estuary
hydrological station. It can be seen that the abrupt
changes occurred in 1972, 1976, 2004 and 2012 from
1970 to 2013. Figure 3(e) show the periodicity
characteristics of the VIC station analysed by wavelet
analysis method and maximum entropy spectrum
method. It can be seen that the periodicity is the most
significant from 1975 to 1980 from 1970 to 2013.
Therefore, the main cycle is 5a and the secondary
cycle is 10a.
3.3 Spatial Distribution Characteristics
of Runoff Coefficient
The runoff coefficient can comprehensively reflect
the influence of natural geographical factors on the
relationship between precipitation and runoff. Figure
3(f) shows the multi-year average runoff coefficient
of precipitation runoff series at each hydrological
station. It can be seen that the runoff coefficient of
WRE 2021 - The International Conference on Water Resource and Environment
62

Mississippi River Basin increases from the west to the
East. The high value area of Mississippi River runoff
coefficient is mainly concentrated in the east, and the
runoff coefficient of Ohio basin is the highest, which
is 0.52. The low value area of runoff coefficient is
mainly concentrated in the western region, and the
runoff coefficient of Platte River Basin is the lowest,
which is 0.05. In this paper, the cubic spline method
is used to analyse the interannual variation process of
runoff coefficient at each hydrological station.
Compared with the change trend of runoff, the runoff
coefficient is basically consistent with the change
trend of runoff. However, MO and MT stations show
the opposite trend, the interannual change of runoff
coefficient of MO station in Mississippi River Basin,
and its runoff coefficient generally shows a
decreasing trend, which may be greatly affected by
the change of land cover type. MT station is the
station in the middle reaches of the Mississippi River
(Zhang, 2010), while MO station is the station where
it flows into the river, and the runoff is large. The
change of runoff coefficient may be affected by the
upstream tributary stations.
4 CONCLUSIONS
The evolution rules of precipitation and runoff in the
Mississippi River Basin are summarized as follows:
The annual precipitation in the Mississippi River
Basin increases gradually from the northwest to the
southeast, and the trend of annual precipitation
increases from the east and west edges to the middle.
The mutation time of the eastern and western
marginal regions is earlier than that of the central
region, and the period of the eastern and western
marginal regions is longer than that of the central
region.
The runoff in the Mississippi River Basin
increases from both sides to the middle, which is not
consistent with the distribution of annual
precipitation. It can be seen that the runoff change in
the Mississippi River Basin is affected by human
activities and climate change. The total amount of
water entering the sea is decreasing. From 1970 to
2013, the runoff mutation point was 1972, 1976,
2004, 2012, the main cycle was 5 years, and the
secondary cycle was 10 years.
The runoff coefficient of the Mississippi River
basin increases from the west to the east. Most of the
basin is much more affected by climate change.
In the future research, we should carefully discuss
the influencing factors of the inter-annual variation
trend of precipitation and runoff in the Mississippi
River Basin, and distinguish the contribution rates of
human activities and climate change, so as to provide
scientific reference for the study of large-scale
hydrological cycle in the basin and even the global
hydrological cycle.
ACKNOWLEDGEMENTS
The researchers would like to extend their thanks to
IWHR Research & Development Support Program
(MK0145B022021). The study was also supported by
the General project of Hebei Natural Science
Foundation (NO. E2017402178).
REFERENCES
Anderson, M. T., and Norton, P. A. (2007). Trends in
Streamflow in the Missouri River Basin from 1957 to
2006. AGU Fall Meeting Abstracts.
Anderson, M. T., Stamm, J. F., and Norton, P. A. (2008).
Changes in Monthly Streamflow Conditions in the
Missouri River Basin from 1957 to 2007. AGU Fall
Meeting Abstracts.
Arnell, N. W. (1992). Factors controlling the effects of
climate change on river flow regimes in a humid
temperate environment. Journal of Hydrology, 132(1-
4), 321-342.
Elgaali, E., & Garcia, L. A. (2006). Effects of climate
change on the distribution of the Arkansas River flow.
Hydrology Days, 2006, 49-60
Griffin, E. R., & Friedman, J. M. (2017). Decreased runoff
response to precipitation, little missouri river basin,
northern great plains, USA. JAWRA Journal of the
American Water Resources Association, 53(3), 576-
592.
Han, X. Y., Yang, Q., & Yao, J. Q. (2013). Characteristics
of precipitation change in Tianshan Mountain Area of
Xinjiang in recent 51 years. Research on Soil and water
conservation, 2, 139-144.
Hubbart, J. P. K. A. (2010). The roles of precipitation
increases and rural land-use changes in streamflow
trends in the upper mississippi river basin. Earth
Interactions, 14(20), 1676-1683.
IPCC. Climate Change (2013). The Physical Science Basis.
Contribution of Working Group I to the Fifth
Assessment Report of the Intergovernmental Panel on
Climate Change. Cambridge: Cambridge University
Press.
Knight, R. R., Gain, W. S., & Wolfe, W. J. (2012).
Modelling ecological flow regime: an example from the
tennessee and cumberland river basins. Ecohydrology,
5, 613-627.
Liang, F., Liu, D. D., and Wang, W. Z. (2015). Analysis on
variation trend of summer precipitation in Northeast
Spatial and Temporal Evolution of Precipitation and Runoff in Mississippi River Basin in Recent 40 Years
63

China from 1961 to 2013. Research on Soil and water
conservation, 5, 6773
Liu, X. Q., Chen, Y. S., & Liu, Y. S. (2017). Statistical
characteristics of climate change in Yulin City, Shaanxi
Province from 1974 to 2012. Journal of Desert
Research, V37(2), 355-360.
Lund, D. D., Project, C. E. A., & States, U. (2012).
Assessment of the Effects of Conservation Practices on
Cultivated Cropland.
Milly, P. C. D. (2005). Trends in the Water Budget of the
Mississippi River Basin, 1949-1997. Reston, VA,
Geological Survey (U.S.).
Milly, P. C. D., & Dunne, K. A. (2001). Trends in
evaporation and surface cooling in the Mississippi river
basin. Geophysical Research Letters, 28(7), 1219-1222.
Munoz, S. E., & Dee, S. G. (2017). El nio increases the risk
of lower mississippi river flooding. Scientific Reports,
7(1), 1772.
Nair, A., Joseph, K. A., & Nair, K. S. (2014). Spatio-
temporal analysis of rainfall trends over a maritime
state (kerala) of india during the last 100 years.
Atmospheric Environment, 88, 123–132.
Onyutha, C., Tabari, H., Taye, M. T., Nyandwaro, G. N., &
Willems, P. (2016). Analyses of rainfall trends in the
nile river basin. Journal of Hydro-environment
Research, 13, 36-51.
Qian, T., Dai, A., & Trenberth, K. E. (2007). Hydroclimatic
trends in the mississippi river basin from 1948 to 2004.
Journal of Climate, 20(18), 4599-4614.
Raj, P. P. N., & Azeez P. A. (2012). Trend analysis of
rainfall in Bharathapuzha River basin, Kerala, India.
International Journal of Climatology, 32(4), 533–539.
Ren, G. Y., Ren, Y. Y., & Zhan, Y. J. (2015). Spatial-
temporal variability of precipitation in Mainland China
-ⅱ. Modern Variation Trend. Advances in Water
Science, 4, 451-465.
Schilling, K. E., Chan, K. S., Hai, L., & Zhang, Y. K.
(2015). Quantifying the effect of land use land cover
change on increasing discharge in the upper mississippi
river. Journal of Hydrology, 387(3-4), 343-345.
Shao, X. M., Xu, Y. Q., & Yan, C. R. (2006). wavelet
analysis of Precipitation Series in the Yellow River
Basin. Journal of Peking University (Natural Science
Edition), 42(4), 503-509.
Shi, J. L., Wang, X. R., & Li, S. F. (2017). Spatial and
temporal variation characteristics of temperature and
precipitation in Henan Province in recent 50 years.
Research of Soil and Water Conservation, 24(3), 151-
156.
Simon, A., Artita, K. S., & Simon, G. L. (2016). 100 Years
of Changing Hydrologic Conditions in the Mississippi
River Basin: Precipitation and Water Yield. World
Environmental and Water Resources Congress.
Stoneviius, E., Rimkus, E., Taras, A., Kays, J., &
Valiukeviius, G. (2017). Climate change impact on the
nemunas river basin hydrology in the 21st century.
Boreal Environment Research, 22, 49-65.
Sun, J. L., Lei, X. H., Jiang, Y. Z., & Wang, H. (2012).
Change trend analysis of temperature, precipitation and
runoff in the upper reaches of the Yangtze River Basin.
Hydropower and energy science, 5, 1-4.
Tayyebi, A., Pijanowski, B. C., & Pekin, B. K. (2015). Land
use legacies of the ohio river basin: using a spatially
explicit land use change model to assess past and future
impacts on aquatic resources. Applied Geography, 57,
100e111.
Teklesadik, A. D., Alemayehu, T., Griensven, A. V.,
Kumar, R., Liersch, S., & Eisner, S. (2018). Inter-model
comparison of hydrological impacts of climate change
on the upper blue nile basin using ensemble of
hydrological models and global climate models.
Climatic Change, 141, 517–532.
Wang, H., Jia, Y.W. (2016). Theory and research method
of "nature-society" dual water cycle in changing
watershed. Journal of Hydraulic Engineering, 10,
12191226.
Yan, D. M., & Weng, B. S. (2016). Analysis on evolution
characteristics of hydrological elements in Northern
Anhui. China Rural Water Resources and Hydropower,
6, 58-63.
Zhang, L. (2010). U.S. water resources census. Water
Conservancy Development Research, 10(2), 71-75.
Zhang, Y. M., Tian, Y., & Lei, X. H. (2016). Analysis on
variation characteristics of precipitation and runoff in
the upper reaches of Sancha River in recent 50 years.
Hydrology, 5, 7984.
Zhao, L. N., Song, S. B., & Xie, P. P. (2009). Spectral
analysis of annual runoff series in Northern Shaanxi.
Journal of Water Resources and Water Engineering, 20
(6), 16-21.
Zhuang, X. W., Li, Y. P., Huang, G. H., & Wang, C. X.
(2017). Evaluating climate change impacts on the
hydrology of watershed in north-western China using a
stepwise‐clustered downscaling approach.
International Journal of Climatology, 47, 191–209.
WRE 2021 - The International Conference on Water Resource and Environment
64
