
Spatial-temporal Characteristics of Rainstorm, Flood Disaster Losses
and Disaster-inducing Factors in Sichuan Province of China
Xiehui Li, Lei Wang
*
and Xiaoran Chen
Plateau Atmosphere and Environment Key Laboratory of Sichuan Province, School of Atmospheric Sciences,
Chengdu University of Information Technology, Chengdu, China
Keywords: Rainstorm and flood disasters, disaster losses, percentile method, rainstorm intensity, Sichuan Province of
China
Abstract: Analysis of spatial-temporal distributions and variation trend of meteorological disasters and disaster-
inducing factors can shed new light on meteorological disaster prevention and control, disaster relief planning
and adaptation to climate change. Rainstorm and associated flood disasters are among the most frequent and
serious meteorological disasters in Sichuan Province of China which spans part of the Qinghai-Tibet Plateau.
In this study, daily precipitation data at 42 weather stations in Sichuan Province from 1973 to 2012 were
collected and utilized along with statistics on rainstorms, flood disasters and socioeconomic status of 21 cities
and prefectures from 1985 to 2012. Indicators characterizing the losses caused by rainstorm and flood
disasters and rainstorm features were chosen. Critical disaster-causing precipitations were determined using
the percentile method. Thus, a comprehensive analysis was conducted over the spatial-temporal distribution
of the losses caused by rainstorms, flood disasters and the disaster-inducing factors in Sichuan Province, with
a thorough characterization of precipitation during the rainstorms. The results showed from 1985 to 2012, the
loss of crop area caused by the rainstorm and flood disasters and the loss rate showed a large fluctuation. The
increasing trend of annual average rainstorm intensity was more obvious than that of the annual average
rainstorm frequency. In the context of global warming, although the overall precipitation of Sichuan decreases,
both the probability and intensity of extreme precipitation events increase. The annual average rainstorm
volume and annual average rainstorm frequency shared similar spatial distribution patterns in the past 40
years. The overall frequency and the frequency of rainstorm processes of five intensity grades decreased from
east to west. The frequencies were much higher in the basin of eastern Sichuan than in the mountainous south-
western region and in the north-western plateau. The smallest frequency was found in the plateau of north-
western Sichuan. Within the basin, the frequency of rainstorm intensity in the west was higher than that in the
east.
1 INTRODUCTION
An analysis of 1970-2009 EM-DAT (Emergency
Events Database) data reveals 7,870 hydro-
meteorological related global disasters, causing the
loss of 1.86 million lives and economic damages of
US$ 1.954 trillion (adjusted to 2011 US$ exchange
rate), among which storms and floods account for
79% of the total number of disasters and cause 56%
of life losses and 85% of the economic losses (World
Meteorological Organization, 2013). Recent years
have witnessed a growing number of extreme weather
and meteorological events along with accelerating
urbanization and industrialization in many countries
the general context of global warming. This directly
results in a surge of losses related to meteorological
disasters. Among various types of meteorological
disasters, rainstorm and flood disasters are more
frequent and cause greater losses than other disasters.
Rainstorms are the primary cause of flood disasters
and are also the related primary disaster-inducing
factor. Many studies have been conducted at home
and abroad concerning spatial-temporal distribution
of rainstorms and associated losses. On basis of
available rainfall data from 1891 to 2000, Kulkarni et
al (2010) analyzed severe rainstorm characteristics of
the Godavari Basin in Peninsular India. The results
showed that 22 severe rainstorms affected the
Godavari Basin in the past 110 years, mostly during
the monsoon months of July and August. Hitchens
Li, X., Wang, L. and Chen, X.
Spatial-temporal Characteristics of Rainstorm, Flood Disaster Losses and Disaster-inducing Factors in Sichuan Province of China.
In Proceedings of the 7th International Conference on Water Resource and Environment (WRE 2021), pages 43-57
ISBN: 978-989-758-560-9; ISSN: 1755-1315
Copyright
c
2022 by SCITEPRESS – Science and Technology Publications, Lda. All rights reserved
43

and Brooks studied the spatial and temporal
distributions of heavy hourly rainfalls in the United
States by using two high-resolution precipitation
datasets (Hitchens & Brooks, 2013). Higgins and
Kousky examined the changes in observed daily
precipitation over the United States between 1950-
1979 and 1980-2009 by using several simple
measures including mean, frequency, intensity and
return period. The results showed that multi-day
heavy precipitation events are increasing in the more
recent period (Higgins & Kousky, 2013). Wu
analyzed the changing characteristics of precipitation
during 1951-2013 for the contiguous United States
(CONUS). Results showed a strong increase of heavy
precipitations with extreme events increasing for
most of the CONUS with the exception of the west
region (Wu, 2015). Dauji (2019) discussed the
monsoon rainstorm characteristics for varying inter-
event intervals at a site on the western coast of India.
Shakeel et al. applied a mix research approach to
analyze the 2010-flood generating factors and
damages in districts Muzaffar Garh. The analysis
indicated that the flood was generated by extreme
rainfall event in the last week of July 2010 in the
upper catchment areas of River Indus. And the
analysis showed that the inundation incurred total
estimated economic loss of about 9.85 million US$
(Shakeel et al., 2021).
China is one of the countries with the highest
frequency of rainstorm and flood disasters and it
suffers enormous economic losses (Yu et al., 2018).
According to statistics, the annual average area of
crops covered by rainstorm and flood disasters from
1951 to 2015 was 12.07 million ha; the annual
average economic loss caused by rainstorm and flood
disasters from 1984 to 2018 was 103.8 billion RMB.
Therefore, factors inducing the rainstorm and flood
disasters and assessment of related losses have been a
research hotspot (Huang et al., 2021; Zhao et al.,
2014; Wu et al., 2014; Lin & Yang, 2014; Wang et
al., 2014; Zou & Ren, 2015; Zhao et al., 2017; Jiang
& Gao, 2019; Luo et al., 2020). Rainstorms are the
primary source of floods in Sichuan of China and the
most serious meteorological disasters in Sichuan
Basin. A major trigger mechanism for rainstorms in
basin regions is the coupling of vertical vorticity in
the Qinghai-Tibet Plateau and Sichuan Basin.
Extreme rainstorms can easily lead to floods,
mountain torrents and debris flows, causing high
casualties and economic losses. For example, from
June 8
th
to 11
th
, 2013 western Sichuan Basin
underwent an episode of extreme rainstorm. During
this rainstorm, the precipitation at Dujiangyan Station
from 20:00 of 8
th
to 20:00 of 9
th
was 415.99mm, and
the maximum at a local station exceeded 700mm.
Extreme precipitation triggered extreme natural
disasters, causing 59 deaths, 174 missing people and
direct economic losses of 20.3 billion RMB (Xiao et
al., 2017). In 2018, according to the statistics of
Sichuan Climate Center, there were 8 local rainstorms
within the province. The average precipitation was by
21% higher than in normal years. From July 8
th
to
20:00 of 12
th
, an extreme rainstorm was observed at
Guanghan Station of Deyang City. The maximum
daily precipitation was 321.9mm, and the event
rainfall was 488.8mm, both of which were the largest
throughout the province. In mid-August 2020, there
was continuous rainstorm and heavy rainstorm in the
west of Sichuan Basin, and severe rainstorm occurred
in some areas. Among them, the hourly rainfall
intensity generally reached 50-80mm, and some
places exceeded 100mm. Focusing on the losses
caused by rainstorm and flood disasters and on the
spatial-temporal distribution features, Deng studied
the features of flood disasters in Sichuan and disaster
countermeasures taken since the founding of New
China. It was concluded that the major reasons for
extreme rainstorms and flood disasters in Sichuan
from 1952 to 1998 were abnormal climate changes
(Deng, 2001). Zhou et al (2011) used the daily
precipitation data of 133 weather stations in Sichuan
Province from 1961 to 2008 and analyzed variation
and influence of atmospheric precipitation in Sichuan
in the past 50 years. It was found that from the west
to the east of Sichuan Province, the annual average
number of rainstorm days showed the overall trend of
increase, decrease, and again increase. Qing et al
(2013) implemented statistical methods and wavelet
analysis to disaster census database from 1985 to
2009 and discussed the spatial-temporal distribution
features of losses caused by rainstorm and flood
disasters in Sichuan Province. The results showed
that the basic change trend of losses caused by
rainstorm and flood disasters was increasing, and the
proportion of direct economic loss caused by
rainstorm and flood to GDP (Gross Domestic
Product) and the disaster area of crops had a change
cycle of about 8a and 13-14a, respectively. Li and Mu
(2014) used daily precipitation data of 102 weather
stations from 1961 to 2010 in south-western Sichuan.
They analyzed the spatial-temporal distribution
features of rainstorms in south-western Sichuan in a
period of 50 years by using trend analysis, Mann-
Kendall mutation test and wavelet analysis. Deng et
al (2017) investigated the rainstorm and flood
disaster-inducing features in the past 30 years using
rainstorm and flood disaster-related economic loss
questionnaire forms for Sichuan from 1984 to 2010,
WRE 2021 - The International Conference on Water Resource and Environment
44
daily precipitation data of Sichuan from June to
September in the period from 1981 to 2010 and NCEP
(National Centers for Environmental Prediction)
reanalysis data. Thus, they derived the circulation
background for disaster-inducing rainstorms in
Sichuan during major flood periods in flood years.
Based on the above studies, we selected Sichuan as
the study area. Sichuan, located in south-western
China, has diversified geomorphic types and
frequently occurring meteorological disasters.
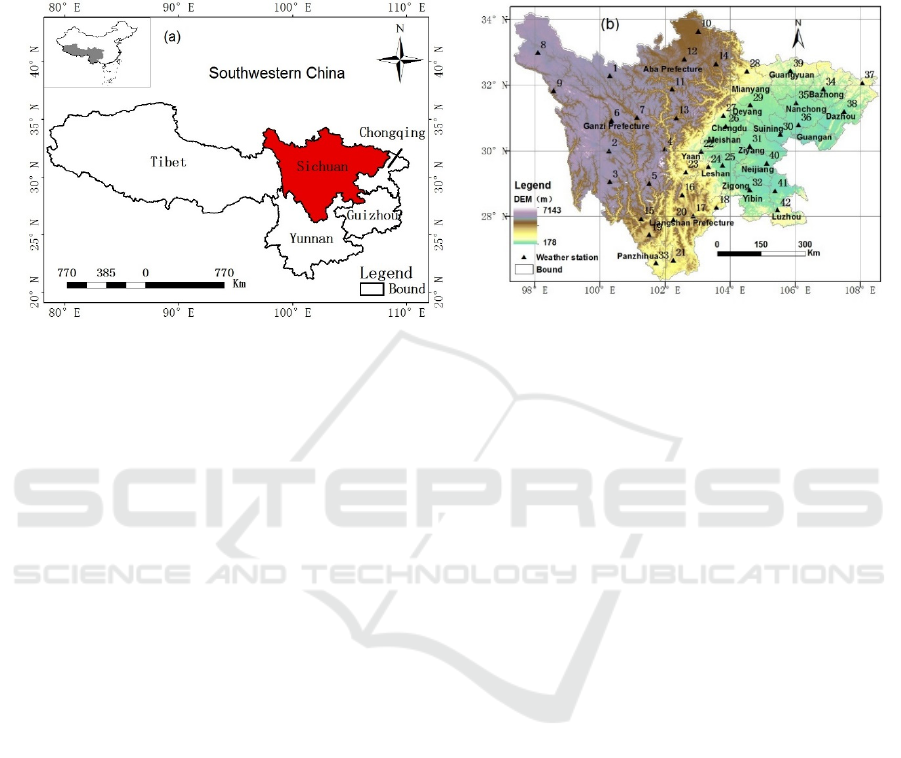
(a) Geographical location of Sichuan Province (b) Digital Elevation Model and Weather Stations
Figure 1: Overview of study area and administrative division of Sichuan Province and geographic locations of weather
stations.
As reported in this paper, daily precipitation data
at 42 weather stations in Sichuan Province from 1973
to 2012 were collected and utilized along with
statistics on rainstorm and flood disasters and
socioeconomic status of 21 cities and prefectures
from 1985 to 2012. Indicators characterizing the
losses caused by rainstorm and flood disasters and
rainstorm features were used. The critical disaster-
causing precipitation was determined using the
percentile method. The purpose was to conduct a
comprehensive analysis over the losses caused by
rainstorm and flood disasters in Sichuan Province and
over the spatial-temporal distribution of disaster-
inducing factors, with a thorough characterization of
rainfall of rainstorm events. The research findings can
shed new light on rainstorm and flood disaster
prevention and control, disaster relief planning and
adaptation to climate change for Sichuan Province in
the context of global warming.
2 MATERIALS AND METHODS
2.1 Study Area
Sichuan Province is located in southwestern China
beside the upper reaches of the Yangtze River (97°21'
~108°33'E, 26°03'~34°19'N) (Figure 1a). Sichuan
is featured by complex terrain and large difference in
elevation between the west and east, the range being
178-7,143m (Figure 1b). There are a variety of
climate types with frequent occurrence of
meteorological disasters. The annual precipitation of
the province is smaller in the west and larger in the
east, smaller in the plateau than in the basin, and
smaller in the hilly area inside the basin than in the
mountainous regions around it (Zhou et al., 2011). By
topography and landform, Sichuan Province is
divided into basin in the east, plateau in the northwest
(mainly referring to Ganzi Prefecture and Aba
Prefecture), and mountainous regions in the
southwest (mainly referring to Liangshan Prefecture
and Panzhihua City). According to statistics
supported by the meteorological disaster database
from 1985 to 2009, among the areas affected by
meteorological disasters, the drought area is the
largest one. However, rainstorm and flood disasters
cause the greatest losses, because they not only affect
agricultural production, but also the transportation
and industry sectors (Qing et al., 2013).
2.2 Data Sources
The meteorological data used in this paper mainly
came from daily precipitation dataset available on the
website of China Meteorological Administration
(http://data.cma.cn/). A total of 42 representative
weather stations were selected throughout Sichuan
Province, and the time period was from 1973 to 2012.
Before formal data processing, daily precipitation
Spatial-temporal Characteristics of Rainstorm, Flood Disaster Losses and Disaster-inducing Factors in Sichuan Province of China
45

data within 40 years were first inspected.
Interpolation was performed for the missing values,
so as to ensure the continuity and accuracy of data.
Statistics on disasters and socioeconomic status were
collected from Encyclopedia of China
Meteorological Disasters (Sichuan Volume), Sichuan
Flood and Drought Disasters, Sichuan Disaster Relief
Yearbook, Sichuan Statistical Yearbook and related
literature (Deng et al., 2017). Since the disaster
statistics before 1984 were unavailable, the time span
of statistics on disasters and socioeconomic status
was from 1985 to 2012. Figure 1b shows the
administrative division of Sichuan Province and
geographic locations of 42 weather stations; Table 1
presents the administrative affiliation of these
weather stations. There are 18 prefecture-level cities
and 3 autonomous prefectures affiliated to Sichuan
Province. As to the distribution of weather stations,
there are 14 stations (No. 1-14) located in the plateau
of north-western Sichuan, 7 (No. 15-21) in the
mountainous region of south-western Sichuan and 21
(No. 22-42) in the basin of eastern Sichuan.
Table 1: Detailed information of weather stations in Sichuan Province used in the study.
Prefectures and
Cities
Numbers and names of weather stations
Ganzi Prefecture 1 Seda, 2 Litang, 3 Daocheng, 4 Kangding, 5 Jiulong, 6 Xinlong, 7 Daofu, 8 Shiqu, 9 Dege
Aba Prefecture 10 Ruoergao, 11 Maerkang, 12 Hongyuan, 13 Xiaojin, 14 Songpan
Liangshan
Prefecture
15 Muli, 16 Yuexi, 17 Zhaojue, 18 Leibo, 19 Yanyuan, 20 Xichang, 21 Huili
Ya'an City 22 Ya'an, 23 Hanyuan
Leshan City 24 Emeishan, 25 Leshan
Chengdu City 26 Wenjiang, 27 Dujiangyan
Mianyang City 28 Pingwu, 29 Mianyang
Suining City 30 Suining
Ziyang City 31 Ziyang
Yibin City 32 Yibin
Panzhihua City 33 Panzhihua
Bazhong City 34 Bazhong
Nanchong City 35 Langzhong, 36 Gaoping
Dazhou City 37 Wanyuan, 38 Daxian
Guangyuan City 39 Guangyuan
Neijiang City 40 Neijiang
Luzhou City 41 Naxi, 42 Xuyong
2.3 Main Research Methods
2.3.1 Measurement Indicators of Rainstorm
and Flood Disaster Losses and
Rainstorm Features
Frequency of rainstorm and flood disasters and
degree of damage caused are important factors for
characterizing the impact of disasters. To measure the
degree of damage caused by rainstorm and flood
disasters, we use the following indicators: area of
crops covered by natural disasters (the sown area of
crops reduced by more than 10% due to disasters),
area of crops affected by natural disasters (the sown
area of crops reduced by more than 30% due to
disasters), area of total crop failure (the sown area of
crops reduced by more than 80% due to disasters),
absolute and relative values of direct economic
losses. Relative indicators included loss rate (i.e.,
direct economic loss caused by rainstorm and flood
disasters of the year concerned/GDP of the year
concerned) and ratio of crop loss area to total
farmland area. Rainstorms are the primary reason for
flood disasters. The following measures are used to
characterize the rainstorms: annual average rainstorm
volume, annual average contribution rate of
WRE 2021 - The International Conference on Water Resource and Environment
46

rainstorms (ratio of annual average rainstorm volume
to annual average total precipitation), annual average
rainstorm frequency (ratio of cumulative number of
rainstorm days to actual length of time period
concerned) and annual average rainstorm intensity
(ratio of annual average rainstorm precipitation to
annual average frequency of rainstorms). The
regional rainstorm value is expressed as the integrated
arithmetic mean at all weather stations in this region.
2.3.2 Percentile Method
Percentile, as a position indicator, is used to describe
the distribution of a group of sample values. The
combined use of several percentiles can
comprehensively describe the distribution of samples.
Percentile can be calculated using the empirical
formula below (Wang et al., 2011):
1
1
jji
XXpQ
(1)
31int pnpj
(2)
jpnp
31
(3)
where, Q
i
(p) is the i
th
percentile; X is the sample
sequence in an ascending order; p is the percentile
rank; n is the number of sequences; j is the j
th
sequence; int is the integer-valued function, the return
value is the closest integer by rounding downwards; γ
is the weight of (j+1)
th
sequence.
2.3.3 Precipitation during the Rainfall
Process and Critical Disaster-causing
Rainfall
The higher the precipitation intensity and the higher
the frequency of heavy precipitation, the more severe
losses are caused by rainstorm and flood disasters.
Hence, the more destructive the rainstorm and flood
disasters, the higher is the hazard degree of disaster-
inducing factors. The hazard degree of rainstorm and
flood disaster-inducing factors can be characterized
by rainstorm frequency and intensity, using the
following method: (1) A rainstorm process is taken
into consideration if it lasts several consecutive days
with rainfalls, and it is required that the precipitation
is larger than 50mm on at least one day; (2)
Precipitations for these processes spanning up to 10
days or more at each weather station over the years
are determined. Precipitations of each episode at all
weather stations constitute a sequence, and 10 such
sequences with varying time lengths are built. For
each sequence, the precipitations are ranked in an
ascending order and the precipitations in the 98
th
, 95
th
,
90
th
, 80
th
and 60
th
percentiles are calculated. These
values are taken as the critical disaster-causing
precipitations (rainstorm intensity); (3) Based on
these percentiles, rainstorm intensity is divided into 5
grades: precipitations in the 60
th
-80
th
percentile are of
grade 1 (flood-inducing); those in the 80
th
-90
th
percentile are of grade 2 (mild flood); those in the
90
th
-95
th
percentile are of grade 3 (moderate flood),
those in the 95
th
-98
th
percentile are of grade 4 (severe
flood) and those above 98
th
percentile are of grade 5
(extreme flood); (4) According to the index, the
frequencies of annual rainstorm and flood processes
with different intensity are determined at each station,
and the spatial distribution maps of rainstorm
frequency are plotted for each intensity grade (Li et
al., 2013).
3 RESULTS AND DISCUSSION
3.1 Spatial-temporal Distribution
Features of Losses Caused by
Rainstorm and Flood Disasters
3.1.1 Interannual Variation and Monthly
Distribution Features
Sichuan is located in southwestern China, where
agriculture accounts for a large proportion of the
national economy. Due to lower economic
development level, Sichuan is susceptible to natural
disasters. Every year, huge economic losses and
casualties are caused by rainstorms and floods, and
the losses involve mostly the agricultural production.
Figures 2 and 3 show the loss of crop area caused by
the rainstorm and flood disasters and the ratios of
such losses to local GDP (loss rate) in Sichuan from
1985 to 2012. The area of crops covered and affected
by the rainstorm and flood disasters all fluctuated
greatly in the past 28 years, and the changing trend
follows the polynomial distribution law of the fifth
power (Figure 2). Among the area of crops covered
by the rainstorm and flood disasters, the greatest
losses of occurred in 2010, the area of crops covered
by the disaster being 1.508 million ha; the second
largest loss occurred in 1998, the area of crops
covered by the rainstorm and flood disasters being
1.416 million ha; the loss was the smallest in 1994,
the area of crops covered by the rainstorm and flood
disasters being 0.192 million ha. Among the area of
crops affected by the rainstorm and flood disasters,
the greatest loss occurred in 1998, the crop area
affected was 0.819 million ha; the second largest loss
Spatial-temporal Characteristics of Rainstorm, Flood Disaster Losses and Disaster-inducing Factors in Sichuan Province of China
47
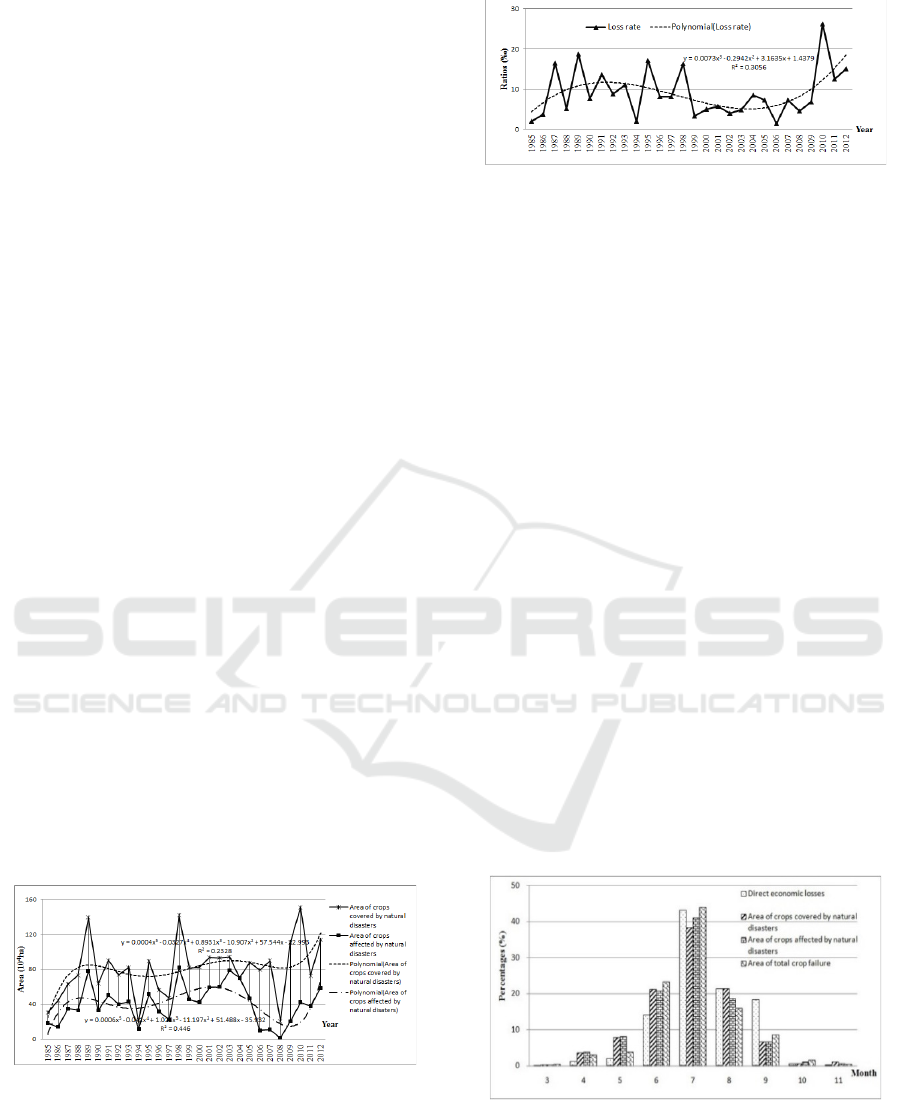
occurred in 2003, the crop area affected being 0.786
million ha; the loss was the smallest in 2008, the crop
area affected being only 16 thousand ha. Taken
together, 1998 was the year with the largest loss of
crop area affected by rainstorm and flood disasters,
and 2008 was the year least affected. In 1998
catastrophic floods occurred in the entire drainage
basin of the Yangtze River. Sichuan, located in the
upper reaches of the Yangtze River, suffered from 15
rainfall events as well as floods, landslides and debris
flows in different cities and prefectures from May to
September 1998. These natural disasters caused direct
economic loss of about 12.3 billion RMB, and 1998
was the year with most severe crop loss in Sichuan in
the 20
th
century (Feng & Luo, 1995).
From 1985 to 2012, the direct economic loss
caused by rainstorm and flood disasters fluctuated
within the range from 45.08 to 0.087 billion RMB;
the loss was the greatest in 2010 and the smallest in
1985. GDP increased continuously from 1985 to
2012, the variation range being from 42.115 to
2,382.78 billion RMB. The loss rate calculated on this
basis also showed a larger fluctuation, and the
changing trend follows the polynomial distribution
law of the third power (Figure 3). The interannual
variation was considerable, the loss rate was the
highest in 2010, the value being 26.23‰; the second
highest was found in 1989, the value being 18.73‰;
the smallest was found in 2006, the value being
1.44‰ and the average 8.97‰. Over the 28 years, the
values were above the averages in 9 years, and were
below the averages in 19 years; the values were all
below the averages in 11 consecutive years from 1999
to 2009, showing an apparent decreasing trend. Thus,
the loss caused by rainstorm and flood disasters was
not only closely related to disaster itself, but also to
the economic development level and the disaster
defense ability.
Figure 2: Loss of crop area due to rainstorm and flood
disasters from 1985 to 2012.
Figure 3: Ratios of loss caused by rainstorm and flood
disasters to GDP from 1985 to 2012 (loss rate).
Figure 4 shows the percentages of monthly
average loss caused by rainstorm and flood disasters
to annual average loss related to disasters from 1985
to 2012. Rainstorm and flood disasters mainly
occurred in the time span from March to November
in Sichuan, and most of them in the period from June
to September. The ratios of direct economic losses,
areas of crops covered and affected by the rainstorm
and flood disasters and areas of total crop failure in
these four months to the corresponding annual
averages were 95.8, 86.6, 85.4 and 90.6, respectively.
These values were especially higher in July,
accounting for 42.8%, 38%, 40.5% and 43.6% of the
annual total, respectively. The second highest
economic loss and crop loss area were found in
August and June, while those of March, April and
October accounted for the smallest percentages. This
was especially true in March, where the percentages
were all below 0.03%. Figure 5 shows the
percentages of monthly average crop loss area due to
rainstorm and flood disasters to total farmland area
from 1985 to 2012. Most of the crop loss occurred in
the time from June to August, especially in July. The
ratios of area of crops covered and affected by the
disasters to total farmland area were 5.87 and 2.16,
respectively; the highest percentages occurred in July,
the values being 2.19% and 0.88%, respectively.
Figure 4: Percentages of monthly average loss caused by
rainstorm and flood disasters to annual average loss related
to disasters from 1985 to 2012.
WRE 2021 - The International Conference on Water Resource and Environment
48
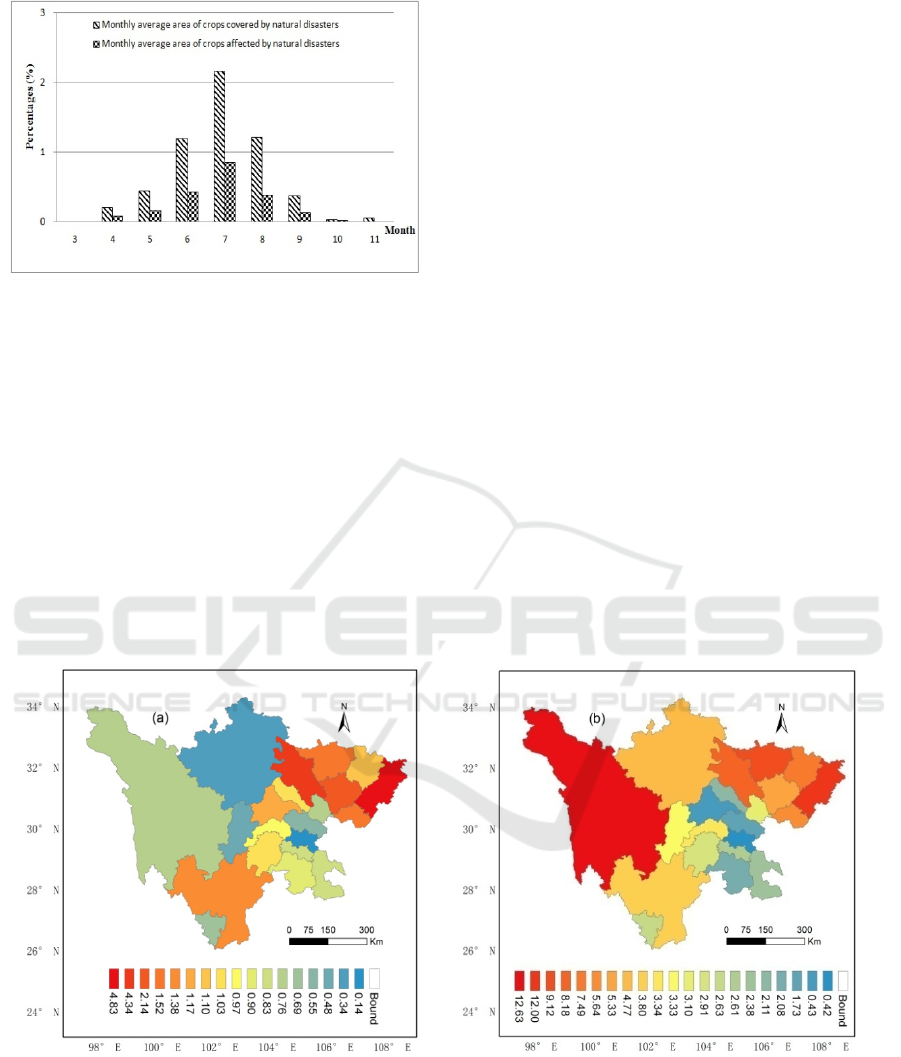
Figure 5: Percentages of monthly average crop loss area due
to rainstorm and flood disasters to total farmland area from
1985 to 2012.
3.1.2 Spatial Distribution Characteristics of
Losses in Cities and Prefectures
Sichuan is featured by high diversity of terrain and
climate types, and there are large variations in
socioeconomic development level across the cities
and prefectures. Rainstorm and flood disasters had
therefore a varying impact on different regions.
Figure 6 shows the spatial distributions of average
direct economic loss and loss rate due to rainstorm
and flood disasters in 21 cities and prefectures from
1985 to 2012. The average direct economic loss due
to rainstorm and flood disasters (Figure 6a), was
higher in Dazhou, Mianyang and Nanchong City,
which are located in the north-eastern Sichuan Basin.
The average direct economic losses were 0.483, 0.434
and 0.214 billion RMB. Regions with the lowest
average direct economic loss were Ya’an, Aba
Prefecture and Neijiang City, the values being 48, 34
and 14 million RMB, respectively. Due to difference
in economic aggregate in 21 cities and prefectures,
the absolute direct economic loss cannot fully reflect
the degree of loss caused by rainstorm and flood
disasters in different regions. Figure 6b shows the
spatial distribution of loss ratio. It can be seen that the
absolute average direct economic loss was smaller in
Ganzi Prefecture in the plateau of north-western
Sichuan, the value being 76 million RMB. Ganzi
Prefecture ranked 15
th
among 21 cities and
prefectures. However, while the annual average GDP
(6.007 billion RMB) of Ganzi Prefecture was the
smallest of the 21 cities and prefectures, its loss rate
was the highest (12.63‰). The loss rates of Dazhou,
Guangyuan and Mianyang City, located in the north-
eastern Sichuan Basin, were also relatively high, the
values being 12‰, 9.12‰ and 8.18‰, respectively;
by contrast, the loss rates of Ziyang, Chengdu and
Neijiang City in the middle and eastern Sichuan Basin
were smaller, the values being 1.73‰, 0.43‰ and
0.42‰, respectively.
Figure 6: Average direct economic loss (100 million RMB) (a) and loss rate (‰) (b) due to rainstorm and flood disasters in
21 cities and prefectures from 1985 to 2012.
Spatial-temporal Characteristics of Rainstorm, Flood Disaster Losses and Disaster-inducing Factors in Sichuan Province of China
49
Figure 7: Percentages of average area of crops covered (a) and affected (b) by rainstorm and flood disasters to total farmland
area in 21 cities and prefectures from 1985 to 2012 (%).
Figure 7 shows the ratios of average areas of crops
covered and affected by rainstorm and flood disasters
to total farmland area in each city and prefecture from
1985 to 2012. Dazhou, Bazhong and Meishan located
in the north-western or south-western Sichuan Basin
were the top three cities with the highest ratio of
average area of crops covered by the rainstorm and
flood disasters to total farmland area (Figure 7a). The
percentages were 13.01%, 12.62% and 9.86%,
respectively; the last three locations were Guangyuan,
Aba Prefecture and Ganzi Prefecture in northern
Sichuan Basin or plateau of north-western Sichuan.
The percentages were 2.37%, 1.78% and 1.58%,
respectively. Dazhou and Bazhong in north-eastern
Sichuan Basin and Ya’an in south-western Sichuan
Basin were the top three cities with the highest ratio
of average area of crops affected by rainstorm and
flood disasters to total farmland area (Figure 7b). The
percentages were 5.80%, 4.73% and 3.78%,
respectively; the last three locations were Guangyuan
and Luzhou in eastern Sichuan Basin and Aba
Prefecture in north-western Sichuan Basin. The
percentages were 0.97%, 0.48% and 0.42%,
respectively.
The agriculture sector accounts for a considerable
proportion of Sichuan provincial economy. Among
various losses caused by the rainstorm and flood
disasters and secondary disasters, the loss caused to
the agricultural production is most direct and
significant. Based on the crop loss area and ratio of
such loss to total farmland area, Dazhou and Bazhong
City in north-eastern Sichuan Basin and Meishan and
Ya’an City in south-western Sichuan suffered the
most from severe rainstorm and flood disasters; by
contrast, Ganzi Prefecture and Aba Prefecture in the
plateau of north-western Sichuan, Guangyuan City in
northern Sichuan Basin and Luzhou City in southern
Sichuan Basin suffered the least. The results observed
are basically in agreement with other research
previously carried out in the southwestern China
(Zhao et al., 2017; Li & Mu, 2014) and Sichuan
Province (Xiao et al., 2017; Deng, 2001; Qing et al.,
2013; Deng et al., 2017; Deng, 1999; Feng & Luo,
1995). However, the year with the least loss of crop
area affected by rainstorm and flood disasters, as well
as the loss rate due to rainstorm and flood disasters in
21 cities and prefectures are different. The
discrepancies may be caused by the data with
different time periods used in the different studies.
3.2 Spatial-temporal Distribution
Features of Factors Inducing
Rainstorm and Flood Disasters
From the viewpoint of their cause, flood disasters can
be divided into rainstorm, barrier and snowmelt types.
Rainstorm-induced flood is the most important type
of flood in Sichuan, and most of the flood disaster
events belong to this type which is prevalent all over
the province. Heavy rainstorms often cause flood
disasters, and intensive precipitation in a certain
region at a certain time is usually the result of one or
several rainstorms. Thus, rainstorms are considered
the most important flood-inducing factor.
WRE 2021 - The International Conference on Water Resource and Environment
50

3.2.1 Analysis of Interannual Variation
Features of Rainstorms
Rainstorm refers to high-intensity rainfalls or rainfalls
with high cumulative volume within a certain time
period. According to the standard for heavy
precipitation developed by China Meteorological
Administration, rainfalls with precipitation volume of
50mm or more within 24h are considered rainstorms.
Annual average rainstorm volume can
comprehensively reflect the general size of daily
rainfall and the amount of rainstorm in a certain
region. This study analyzed the variation trends of
annual average rainstorm volume, annual average
contribution rate of rainstorms, annual average
rainstorm frequency and annual average rainstorm
intensity over the years at 42 weather stations in
Sichuan from 1973 to 2012 (figure omitted).
The results showed that although the annual
average precipitation of time series in Sichuan
demonstrated a mild decreasing trend over the years,
the annual average rainstorm volume, annual average
contribution rate of rainstorms, annual average
rainstorm frequency and annual average rainstorm
intensity increased, but insignificantly. Within the 40
years, the annual average rainstorm volume was the
largest in 1981, the value being 200.4mm; the years
1983 and 1998 came next, with values of 196.2 and
191.3mm, respectively; the year 1976 had the
smallest annual average rainstorm volume, 81.3mm.
The annual average contribution rate of rainstorms
had the largest value (20.7%). The year 1976 was the
smallest (9.5%) and the difference between the two
was 11.2%. The annual average rainstorm frequency
was the highest in 1998 with 2.6 days, followed by
the years 1981 and 1983, with values of 2.5 days and
2.4 days, respectively; the lowest occurred in 1976,
with the value of 1.2 days. The annual average
rainstorm intensity had the highest value of 91.5mm/d
in 2010, followed by the years 1985 and 1989, with
83.7 and 83.1mm/d, respectively; the lowest occurred
in 1976, with 65.6mm/d. The increasing trend of
annual average rainstorm intensity was more obvious
than that of the annual average rainstorm frequency.
This means that the composition of rainstorm
intensity was more extreme. In other words, in the
context of global warming, although the overall
precipitation of Sichuan decreases, both the
probability and intensity of extreme precipitation
events increase. The temporal trends in our work are
similar to previous studies in reporting variation
trends of precipitation and rainstorm over the past few
decades in Sichuan Province (Xiao et al., 2017; Zhou
et al., 2011; Li & Mu, 2014; Zhang et al., 2019; Li et
al., 2019).
Rainstorm occurrences in Sichuan are mainly
influenced by circulation factors on three large scales.
The first are the southwest and southeast monsoons
from India and western Pacific, which mainly
influence rainstorm intensity and variation; the
second are the activities of subtropical high in the
western Pacific and Qinghai-Tibet Plateau, which
mainly control the seasonal variation of rainstorms;
the third are abnormal atmospheric circulations in the
northern hemisphere, especially in the middle and
high latitudes of East Asia. For example, the locations
of Ural high, Okhotsk Sea high and Balkashi Lake
low trough are key large-scale circulation
backgrounds controlling rainstorm occurrences (Zhan
& Wen, 2006). Many studies have shown that under
the circulation background conducive to rainstorm
occurrence, there are four major types of weather
systems that influence rainstorm occurrences in
Sichuan: southwest vortex, low trough and low vortex
and shear line above the Qinghai-Tibet Plateau that
work with cool surface air, southwest low-level jet,
and western Pacific subtropical high (Li et al., 2014).
From May to September 1981, 6 episodes of
catastrophic precipitations occurred in Sichuan. Due
to the joint influence from 500hPa low trough,
southwest vortex and southeast low-level jet that
work with cool surface air, the extreme rainstorm in
Sichuan Basin from 9
th
to 14
th
of July was the most
severe. It caused the heaviest losses of the 6 episodes.
The rainstorm affected 141 cities and counties of
Sichuan. During the 6 days precipitation process, the
regions with precipitation above 100mm spanned
over an area of 173.6 thousand km
2
. This rainstorm
episode was the largest rainstorm and flood disaster
in Sichuan Basin in the 20
th
century and also one of
the extreme floods since the founding of New China.
Therefore, the year 1981 presents the highest annual
average rainstorm volume and also the highest annual
average contribution rate of rainstorms within the
period from 1973 to 2012 (Sichuan Water
Conservancy and Electricity Department, 1996).
3.2.2 Spatial Distribution Features of
Rainstorms
Spatial kriging interpolation was performed for the
annual average rainstorm volume and annual average
rainstorm frequency registered at 42 weather stations
of Sichuan from 1973 to 2012. The spatial distribution
diagrams of annual average rainstorm volume and
annual average rainstorm frequency in Sichuan over
the years are shown in Figure 8.
Spatial-temporal Characteristics of Rainstorm, Flood Disaster Losses and Disaster-inducing Factors in Sichuan Province of China
51
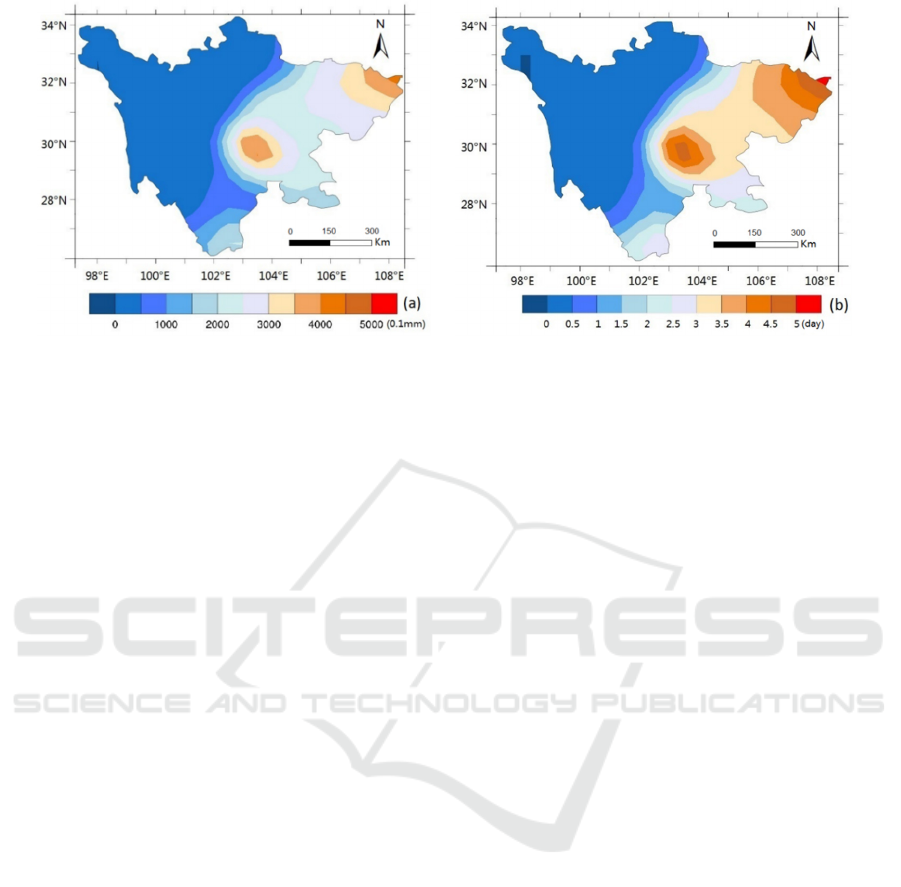
Figure 8: Spatial distribution diagrams of annual average rainstorm volume (a) and annual average rainstorm frequency (b)
over the years from 1973 to 2012.
The annual average rainstorm volume and annual
average rainstorm frequency in Sichuan shared
similar spatial distribution patterns over the years.
Both were higher in the east region than in the west
region. The lowest was observed in the plateau of
north-western Sichuan, followed by the mountainous
region of south-western Sichuan; the highest was
found in Sichuan Basin in the east. The annual
average rainstorm volume was above 200mm in the
entire Sichuan Basin. The annual average rainstorm
frequency was over 2 days, and there were large
differences in rainstorm volume and rainstorm
frequency within the basin. Rainstorms were fewer in
Neijiang, Ziyang and Suining City in the middle of
the basin, where the annual average rainstorm volume
was below 250mm and the annual average rainstorm
frequency was below 3.5 days. Regions with high
rainstorm volume and frequency were mostly found
in western and north-eastern basin. Ya’an, Leshan
and Meishan City in the western part of the basin had
an annual average rainstorm volume above 500mm
and annual average rainstorm frequency above 5
days. These were obviously regions with frequent
rainstorms. Dazhou and Bazhong City in the north-
eastern basin, where the annual average rainstorm
volume was above 400mm and annual average
rainstorm frequency above 4 days, were also regions
with frequent rainstorms. In addition, southern
Liangshan Prefecture and Panzhihua City in the
mountainous regions of south-western Sichuan were
also afflicted by frequent rainstorms, with annual
average rainstorm volume of about 200mm and
annual average rainstorm frequency of 3 days.
Spatial kriging interpolation was performed for
the monthly average rainstorm volume and monthly
average rainstorm frequency based on data registered
at 42 weather stations of Sichuan from 1973 to 2012
(figure omitted). The results showed that the spatial
distribution of monthly average rainstorm volume
and monthly average rainstorm frequency was similar
in Sichuan over 40 years; the months with larger
rainstorm volume also had higher rainstorm
frequency. Rainstorm in Sichuan showed apparent
seasonal features, with no rainstorms occurring in
winter. Rainstorms were fewer from March to May
and from October to November, and were uniformly
distributed. The months from June to September were
the major season of rainstorms, and local rainstorms
were more frequent from July to August. The monthly
average rainstorm volumes of western and north-
eastern basin were all above 100mm/month from July
to August, and the monthly average rainstorm
frequency reached over 2d/month.
Comprehensively, the influence of terrain on
rainstorm occurrences in Sichuan was identified.
There was a clear-cut boundary between the high- and
low-value regions of annual average rainstorm
volume, annual average rainstorm frequency over the
years, as well as monthly average rainstorm volume
and monthly average rainstorm frequency from July
to August. This boundary coincides with the
boundary of eastern Qinghai-Tibet Plateau in
Sichuan. Two conditions have to be met for
rainstorms to occur: one is the presence of abundant
water vapor, and the other is the rising air current. The
plateau in north-western Sichuan has high altitude
and the air, thinner than in the plains, has lower water
vapor content. Under the joint effect of plateau terrain
and south Asia high, East Asian monsoon and India
monsoon can hardly transport water vapor to the
plateau of north-western Sichuan. As a result, both
the annual and monthly average rainstorm volume
WRE 2021 - The International Conference on Water Resource and Environment
52
and frequency are low in this region. The basin, by
contrast, has lower altitude and more abundant water
vapor in the air. Besides, the basin is surrounded by
mountains on the four sides, and the water vapor
produced by evaporation and transpiration within the
basin is not likely to mix with that outside the basin.
Thus, the basin has more abundant water vapor.
When a strong disturbance is given by the
convergence of external conditions, precipitation is
more likely to erupt in the form of rainstorm.
Moreover, due to the terrain effect, rainy centers are
mostly distributed on the windward slopes of the
mountainous region. For this reason, Ya’an, Leshan
and Dujiangyan City in the western part of the basin
are regions which not only have the highest annual
average rainstorm volume and frequency, but also the
highest rainstorm volume and frequency from July to
August. Besides the terrain factor, the southwest
vortex weather process has also an impact on
precipitation and acts in the basin as an important and
special weather system inducing rainstorm.
3.2.3 Analysis of Rainstorm Precipitation
Process
Using the above statistical methods for rainstorm
precipitation process and critical disaster-causing
precipitation, we constructed 10 rainfall sequences of
rainstorm process at 42 weather stations in Sichuan
from 1973 to 2012. Then, precipitations in the 98
th
,
95
th
, 90
th
, 80
th
and 60
th
percentiles were calculated for
different sequences, and the critical disaster-causing
precipitation was determined. Finally, the rainstorm
intensity was divided into 5 grades based on
percentiles. Table 2 shows the scope and frequency of
each grade of rainstorm intensity for rainstorms
lasting for different days according to rainstorm
volume thresholds determined by percentiles.
Table 2: Scope and frequency of rainstorm processes with different intensity grades and lasting for different days.
Days
Grade 1
(0.1mm)
Grade 2
(0.1mm)
Grade 3
(0.1mm)
Grade 4
(0.1mm)
Grade 5
(0.1mm)
Frequency
(times)
Rainstorm
value
(0.1mm)
1 703≤R<860 860≤R<1035 1035≤R<1222 1222≤R<1438 R>1438 339 500
2 858≤R<1080 1080≤R<1305 1305≤R<1603 1603≤R<1933 R>1933 602 500
3 947≤R<1197 1197≤R<1491 1491≤R<1863 1896≤R<2360 R>2360 538 500
4 1054≤R<1383 1383≤R<1792 1792≤R<2020 2020≤R<2403 R>2403 429 500
5 1253≤R<1615 1615≤R<1969 1969≤R<2307 2307≤R<2709 R>2709 313 500
6 1402≤R<1898 1898≤R<2177 2177≤R<2600 2600≤R<3034 R>3034 184 500
7 1394≤R<1833 1833≤R<2254 2254≤R<2723 2723≤R<2960 R>2960 160 500
8 1634≤R<2087 2087≤R<2694 2694≤R<2965 2965≤R<3357 R>3357 132 500
9 1712≤R<2204 2204≤R<2507 2507≤R<2752 2752≤R<3437 R>3437 78 500
≥10 2376≤R<3162 3162≤R<3958 3952≤R<4569 4569≤R<4935 R>4935 149 500
Figure 9: Process frequency and maximum precipitation in
10 rainfall sequences.
Figure 10: Precipitation for different grades of rainstorm
intensity in 10 rainfall sequences.
Spatial-temporal Characteristics of Rainstorm, Flood Disaster Losses and Disaster-inducing Factors in Sichuan Province of China
53
(1) Frequency distribution and maximum
precipitation of rainstorm precipitation processes
During 40 years (1973-2012), a total of 2,924
rainstorm precipitation processes lasting for different
days occurred. The frequency and maximum
precipitation of the 10 rainfall sequences are shown
in Figure 9. Using the duration of 5 days as the
demarcation point, it was found that the rainstorm
frequency decreased significantly if the duration was
above this threshold. The first and last five sequences
were treated as two separate entities. Rainstorms
lasting for a few days accounted for a greater
proportion. There were 2,221 rainstorm processes
shorter than 5 days, accounting for 75.98% of the
total, while there were only 703 rainstorm processes
longer than 5 days, accounting for 24.02% of the
total. From 1973 to 2012, the number of rainstorm
processes lasting for 2 days was the greatest. The
frequency and therefore the probability of rainstorm
processes lasting longer than 2 days decreased.
Generally, rainstorms shorter than 2 days occurred
more frequently than those lasting longer.
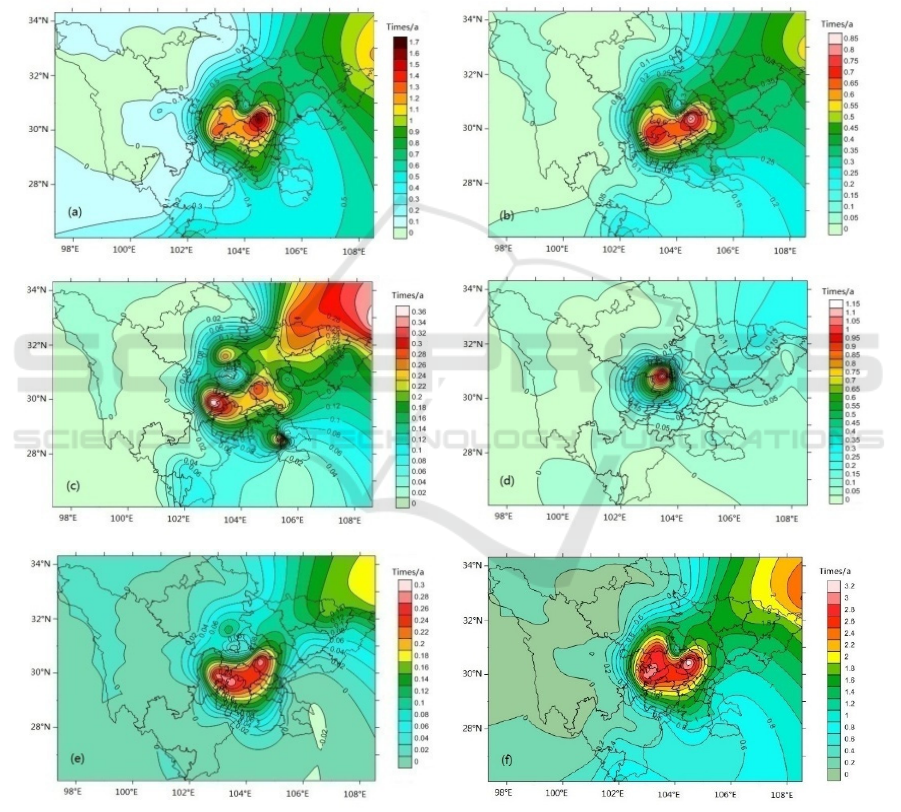
Figure 11: Spatial frequency distribution of overall rainstorm intensity and each grade of rainstorm intensity (a) Grade 1 (b)
Grade 2 (c) Grade 3 (d) Grade 4 (e) Grade 5 (f) Overall.
WRE 2021 - The International Conference on Water Resource and Environment
54

Among rainstorm rainfall processes lasting for
several days, the maximum precipitation also varied
significantly in different sequences. The maximum
precipitations of rainstorm processes lasting for 1 to
10 days and above were as follows: 185.9mm (1 day),
328mm (2 days), 449.6mm (3 days), 398.8mm (4
days), 481.1mm (5 days), 365mm (6 days), 333.1mm
(7 days), 393.1mm (8 days), 430.7mm (9 days) and
657.4mm (≥10 days). We concluded that except for
large difference in maximum precipitation between
rainstorm processes lasting for 1 day and for more
than 10 days, the maximum precipitation of other
rainstorm processes was mostly about 400mm.
(2) Spatial frequency distribution of overall
rainstorm intensity for each grade of rainstorm
intensity
The maximum precipitation varied a little for
rainstorm processes in different sequences. In some
cases, the maximum precipitation of rainstorm
processes lasting for longer days was smaller than
that of shorter rainstorms. However, maximum
precipitations are only extreme cases which cannot
reflect the general rule. Figure 10 shows the
precipitations of 5 intensity grades of rainstorm
processes in 10 sequences. As the duration of
rainstorms increased, the precipitation of each
rainstorm intensity grade increased as well. For 42
weather stations in Sichuan, the frequency of
rainstorms of each intensity grade was calculated over
the years from 1973 to 2012 according to the critical
disaster-causing precipitation (Table 2). The average
total number of episodes of each intensity grade in
every 10 years span was calculated as the frequency
at that station. The overall frequency of rainstorm at
the station was the sum of frequencies of rainstorms
of different intensity grades. The spatial distributions
of frequencies of rainstorms for each intensity grade
and overall rainstorm intensity and frequency at each
station are shown in Figure 11.
The results showed that the overall frequency and
the frequency of rainstorm processes of different
intensity grades decreased from east to west of
Sichuan Province. The frequencies were much higher
in the basin of eastern Sichuan than in the
mountainous south-western region and in the north-
western plateau. The smallest frequency was found in
the plateau of north-western Sichuan. Within the
basin, the frequency of rainstorm intensity in the west
was higher than that in the east. The high-value
regions of overall rainstorm intensity frequency were
mainly found in the western and north-eastern basin.
Ya'an, Leshan and Meishan City in the western part
of the basin were high-frequency regions, followed
by Bazhong and Dazhou City in the north-western
basin. The frequency of 5 rainstorm intensity grades
(Figure 11a-e), decreased from grade 1 to grade 3, the
maximum decreasing from 17 times/10a for grade 1
to 3.6 times/10a for grade 3. The rainstorm frequency
increased slightly for grade 4 intensity and decreased
for grade 5 intensity. The frequency for grade 5
intensity was the smallest of all grades, with a
maximum of 3 times/10a. The overall rainstorm
frequency (Figure 11f) varied within the range of 0-
30 times/10a. Within the years covered by statistical
data, the overall rainstorm intensity frequency was 0
in most part of the plateau of western Sichuan. Ya’an,
Leshan and Meishan City in the western part of the
basin were regions with high overall rainstorm
intensity frequency, the maximum being 30
times/10a. Figure 12 shows the distribution of
stations with overall rainstorm intensity frequency
above 10 times/10a. The high-value regions were
mainly found in Ya’an (Ya'an and Hanyuan Station),
Dazhou (Wanyuan and Daxian Station), Leshan
(Emeishan and Leshan Station), Chengdu (Wenjiang
and Dujiangyan Station), Bazhong (Bazhong Station)
and Guangyuan (Guangyuan Station) City in western
and north-eastern basin. In these regions, the overall
rainstorm intensity frequency was above 15
times/10a, which agreed with the spatial distribution
features of rainstorms discussed in the above section.
In terms of spatial distribution features of rainstorms
and rainstorm precipitation process, our results are
also consistent with the previous studies in Sichuan
Province or neighboring regions (Xiao et al., 2017; Li
& Mu, 2014; Zhang et al., 2019), but our analysis is
more comprehensive.
Figure 12: Radar map of stations with overall rainstorm
intensity frequency above 10 times/10a.
Spatial-temporal Characteristics of Rainstorm, Flood Disaster Losses and Disaster-inducing Factors in Sichuan Province of China
55

4 CONCLUSIONS
Global climate warming and urbanization have
conducted to intensity and frequency changes of
meteorological disaster-inducing factors. Therefore,
it emphasized the challenge in the management of
meteorological disasters. This challenge has become
the high-priority issue for different countries in
coping with climate change. Analysis of spatial-
temporal distributions and variation trend of
meteorological disasters and disaster-inducing factors
can shed new light on meteorological disaster
prevention and control, disaster relief planning and
adaptation to climate change. We chose Sichuan
Province which spans part of the Qinghai-Tibet
Plateau as the research area because the region is
affected by heavy rainfall and increased flood
frequency. The daily precipitation data of 42 weather
stations in Sichuan from 1973 to 2012 were used,
along with statistics on rainstorm and flood disasters
and socioeconomic status of 21 cities and prefectures
from 1985 to 2012. The following main conclusions
were deduced:
(1) From 1985 to 2012, the loss of crop area
caused by the rainstorm and flood disasters and the
loss rate in Sichuan showed a large fluctuation as a
whole. Rainstorm and flood disasters mainly occurred
in the period from June to September in Sichuan. In
the past 28 years, the ratios of direct economic losses,
areas of crops covered and affected by the rainstorm
and flood disasters and area of total crop failure in
these four months to the corresponding annual
averages were 95.8, 86.6, 85.4 and 90.6, respectively.
These values were especially higher in July,
accounting for 42.8%, 38%, 40.5% and 43.6% of the
annual total, respectively.
(2) The average direct economic loss due to
rainstorm and flood disasters in 21 cities and
prefectures from 1985 to 2012, it was higher in
Dazhou, Mianyang and Nanchong City, which are
located in the north-eastern Sichuan Basin. Regions
with the lowest average direct economic loss were
Ya’an, Aba Prefecture and Neijiang City.
(3) Though the annual average precipitation in
Sichuan showed a mild decreasing trend over the
years, the annual average rainstorm volume, annual
average contribution rate of rainstorms, annual
average rainstorm frequency and annual average
rainstorm intensity increased at 42 weather stations
from 1973 to 2012, but insignificantly. The annual
average rainstorm volume and annual average
rainstorm frequency in Sichuan shared similar spatial
distribution patterns in the past 40 years. Both were
higher in the east region than in the west region. The
lowest was observed in the plateau of north-western
Sichuan, followed by the mountainous region of
south-western Sichuan; the highest was found in
Sichuan Basin in the east. The months from June to
September were the major season of rainstorms, and
local rainstorms were more frequent from July to
August.
(4) Among rainstorm rainfall processes lasting for
different days, except for large difference in
maximum precipitation between rainstorm processes
lasting for 1 day and for more than 10 days, the
maximum precipitation of other rainstorm processes
was mostly about 400mm.The overall frequency and
the frequency of rainstorm processes of five intensity
grades decreased from east to west of Sichuan
Province. The frequencies were much higher in the
basin of eastern Sichuan than in the mountainous
south-western region and in the north-western
plateau. The smallest frequency was found in the
plateau of north-western Sichuan. Within the basin,
the frequency of rainstorm intensity in the west was
higher than that in the east.
However, due to the lack of data, the analysis of
rainstorm and flood disaster losses is only 28 years,
and the time scale is relatively short. There are many
causes in inducing rainstorm and flood disaster in
Sichuan, including natural and human factors.
Therefore, the analysis on spatial-temporal
distribution characteristics of rainstorm have to be
expand. In the future, the improvement of data will
strengthen the analysis of longer time scale to identify
more disaster causing factors.
ACKNOWLEDGMENT
This research was financially supported by the Key
Research and Development (R&D) Project in Yunnan
Province (202103AC100028) and the Second Tibetan
Plateau Scientific Expedition and Research
Program (2019QZKK0105).
REFERENCES
Dauji, S. (2019). Monsoon rainstorm characteristics for
varying inter-event intervals at a site on west coast of
India. Journal of The Institution of Engineers (India):
Series A, 100(2), 319-328.
Deng, S. H. (1999). A comment on the extraordinary flood
disaster in Sichuan Province in 1998. Journal of
Southwest Institute for Ethnic Groups, 20, 182-198.
WRE 2021 - The International Conference on Water Resource and Environment
56

Deng, S. H. (2001). Flood features in Sichuan since 1949
and measures. Journal of Sichuan Normal University,
28(5), 96-104.
Deng, G. W., Sun, J., Ruan, G. J., & Ma, Z. F. (2017).
Rainstorm and flood disaster characteristics and
analysis of circulation background in main flood season
in Sichuan. Plateau Meteorology, 36(6), 1521-1532.
Feng, S. Z., & Luo, D. F. (1995). Division of flood-
waterlogging hazard in southwest China. Mountain
Research, 13(4), 255-260.
Higgins, R. W., & Kousky, V. E. (2013). Changes in
observed daily precipitation over the United States
between 1950-1979 and 1980-2009. Journal of
Hydrometeorology, 14(1), 105-121.
Hitchens, N. M., & Brooks, H. E. (2013). Spatial and
temporal characteristics of heavy hourly rainfall in the
United States. Monthly Weather Review, 141, 4564-
4575.
Huang, Z. Y., Long, L. M., Shao, M. L., Zhang, N., & Deng,
H. (2011). Application of analogy method in
quantitative preestimate of heavy rain disaster loss.
Transactions of Atmospheric Sciences, 34(2), 246-250.
Jiang, Q. H., & Gao, L. (2019). Temporal-spatial
characteristics of rainstorm disaster in Fujian Province
from 1950 to 2000. Journal of Subtropical Resources
and Environment, 14(2), 41-48.
Kulkarni, B. D., Nandargi, S., & Mulye, S. S. (2010).
Analysis of severe rainstorm characteristics of the
Godavari Basin in Peninsular India. Journal of
Hydrometeorology, 11, 542-552.
Li, H., Wang, K. Q., & Miao, Q. (2013). Risk zoning of
flood and waterlogging in Weifang. Journal of Nanjing
University of Information Science and Technology,
5(6), 508-514.
Li, J., Zhao, Y. D., & Iqbal, J. (2019). Variation patterns of
extreme precipitation and relation to ocean-atmospheric
climate in Sichuan province China from 1961 to 2017.
Theoretical and Applied Climatology, 137, 3009-3026.
Li, X. Y., Jiang, Y., & Li, G. P. (2014). Analysis of a
regional rainstorm weather process with southwest
vortex participation in Chengdu. Journal of Chengdu
University of Information Technology, 29, 129-135.
Li, Y., & Mu, W. B. (2014). Spatial and temporal
distribution characteristic in the southwest. Journal of
Engineering of Heilongjiang University, 5(2), 37-42.
Lin, J., & Yang, G. M. (2014). Spatio-temporal
characteristics of rainstorm in China During 1981-
2010. Meteorological Monthly, 40(7), 816-826.
Luo, Y. L., Sun, J. S., Li. Y., Xia, R. D., Du, Y., Yang, S.,
Zhang, Y. C., Chen, J., Dai, K., Shen, X. S., Chen, H.
M., Zhou, F. F., Liu, Y. M., Fu, S. M., Wu, M. W., Xiao,
T. G., Chen, Y. R. X., Li, H. Q., & Li, M. X. (2020).
Science and prediction of heavy rainfall over China:
Research progress since the reform and opening-up of
the People's Republic of China. Acta Meteorologica
Sinica, 78(3), 419-450.
Qing, Q. T., Chen, W. X., Zhan, Z. Y., Zhang, S. Q., &
Kang, F. Q. (2013). Characteristics of spatial and
temporal distribution of losses caused by flood damage.
Plateau and Mountain Meteorology Research, 33(1),
47-51.
Shakeel M., Asif, S., & Atta-ur, R. (2021). Cause and
damage analysis of 2010 flood disaster in district
Muzaffar Garh, Pakistan. Natural Hazards, 107, 1681–
1692 .
Sichuan Water Conservancy and Electricity Department.
(1996). Flood and drought disasters in Sichuan
Province. Beijing: Science Press.
Wang, H., Mao, W. Y., Li, Y. P., Yu, X. J., & Bai, S. Q.
(2011). Risk zoning of torrential rain which easily
causes damage in Xinjiang region. Journal of
Glaciology and Geocryology, 33(6), 1407-1413.
Wang, Y. J., Gao, C., Wang, A. Q., Wang, Y. Y., & Zhang,
F. Y. (2014). Temporal and spatial variation of
exposure and vulnerability of flood disaster in China.
Progressus Inquisitiones de Mutations Climatis, 10(6),
391-398.
World Meteorological Organization. (2013). Reducing and
managing risks of disasters in a changing climate.
WMO Bulletin, 62, 23-31.
Wu, J. D., Fu, Y., Zhang, J., & Li, N. (2014).
Meteorological disaster trend analysis in China: 1949-
2013. Journal of Natural Resources, 29(9), 1520-1530.
Wu, S. Y. (2015). Changing characteristics of precipitation
for the contiguous United States. Climatic Change, 132,
677-692.
Xiao, D. X., Yang, K. Q., Yu, X. D., & Wang, J. J. (2017).
Characteristics analysis of extreme rainstorm events in
Sichuan Basin. Meteorological Monthly, 43(10), 1165-
1175.
Yu, L., Xu, Y., & Zhang, Y. X. (2018). Temporal and
spatial variation of rainstorms and the impact of flood
disasters due to rainstorms in China in the past 25 years.
Torrential rain and disasters, 37(1), 67-72.
Zhan, Z. Y., & Wen, K. G. (2006). China meteorological
disaster ceremony (Volume Sichuan). Beijing: China
Meteorological Press.
Zhang, S. Q., Wang, C. X., Chen, W. X., & Deng, B.
(2019). Study on evaluation method of intensity and
loss rainstorm in Sichuan Province. Torrential Rain and
Disasters, 38(1), 79-85.
Zhao, S. S., Gao, G., Huang, D. P., & He, W. P. (2017).
Characteristics of meteorological disaster losses in
China from 2004 to 2013. Journal of Meteorology and
Environment, 33(1), 101-107.
Zhao, Y., Gong, Z. W., Wang, W. H., & Luo, K. (2014).
The comprehensive risk evaluation on rainstorm and
flood disaster losses in China mainland from 2004 to
2009: based on the triangular gray correlation theory.
Nature Hazards, 71, 1001-1016.
Zhou, C. Y., Cen, S. X., Li, Y. Q., Peng, G. Z., Yang, S. Q.,
& Peng, J. (2011). Precipitation variation and its
impacts in Sichuan in the last 50 years. Acta
Geographica Sinica, 66(5), 619-630.
Zou, X. K., & Ren, F. M. (2015). Changes in regional heavy
rainfall events in China during 1961–2012. Advances in
Atmospheric Sciences, 32, 704-714.
Spatial-temporal Characteristics of Rainstorm, Flood Disaster Losses and Disaster-inducing Factors in Sichuan Province of China
57
