
Analysis on Evolution of Meteorological Factors in Central Guizhou
Xinan Li
1,2,*
, Xianjin Zhao
1,2
, Shiwei Wang
1,2
and Hui Liu
1,2
1
Guizhou Water & Power Survey-Design Institute Co.,Ltd, Guiyang 550002, China
2
Guizhou Engineering Technology Research Center for Exploitation and Utilization of Water Resources in Karst Region,
Guiyang 550002, China
Keywords: Hydrological alteration diagnosis, Meteorological factors, Trend analysis, Jump analysis, Central Guizhou
Abstract:
Due to human activity and climate change, hydrolocial effect of environment change is always a study focus.
Changes of the underlying surface reflect the effect of human activity while effect of climate change is mainly
reflected in the change of meteorological factors. Alteration diagnosis of meteorological factors was
conducted in in the karst area of the Central Guizhou. The results show that annual cumulative precipitation
(ACP) and annual extreme maximum temperature are stable from 1959 to 2012. The maximum daily
precipitation in annual series, annual averaged temperature series and annual extreme minimum temperature
series had medium variation. The variation indicated that the study area was greatly affected by climatic
change.The impact of human activities needs further study.
1 INTRODUCTION
Guizhou province is rich in water resource and water
resources availability per capita amount is higher than
the national average. It main aquifer is a karst system
that extend from karst ground water and fissures.
However, meanwhile however, because of its
complex structure, such as difficult to store surface
water, surface water transform to groundwater faster,
etc., water resources development is difficult. In
addition, drought occurred frequently because of the
aquifer cannot hold water (Chu et al, 2008; Wang et
al, 2006). In recent years, serious soil erosion and
flood disaster increase have negatively impacted the
social development and ecological protection. Part of
disaster are due to the climate change and special
karst geological conditions (Peng et al, 2012; Tong et
al, 2012; Tang et al, 2016). Ecological protection and
development are two important aspects of the regional
development. For the last twelfth five-year, strong
effort have been made to develop health, big data,
ecology and tourism of the 13rd five-year plan in
Guizhou province. Multi-timescale analysis to
rainfall in Karst is necessary for regional water
resources development, ecological management and
protect, and social sustainable development.
Taking Guiyang city of Guizhou province as the
representative of central Guizhou region, this paper
analyses the meteorological elements impacting karst
region in southwest China, to reveal the influence of
changing environment on regional climate. As a
preliminary study on the analysis of meteorological
elements in central Guizhou, the research results
analyse the temporal relationship between rainfall and
temperature and but also provide references for the
study of meteorological problems under the changing
conditions of karst mountainous areas.
2 STUDY AREA AND DATA
Guiyang is located in the southwest of China and the
middle of Guizhou Province and is the capital of
Guizhou Province. The geographical coordinates of
Guiyang weather station are 106°44´ E and 26°36´ N.
Guiyang is located in the Yunnan-Guizhou Plateau in
the middle of the original hills, Guiyang in 1100
meters altitude, perennial controlled by the westerlies,
a subtropical humid mild climate, annual average
temperature 15.3℃, annual extreme maximum
temperature 35.1℃, annual extreme minimum
temperature of 7.3℃, annual average relative
humidity is 77%, the average annual total rainfall of
1129.5 mm, annual average cloudy days to 235.1
days, annual average sunshine hours for 1148.3 hours.
Guiyang is in the watershed of the Yangtze River and
the Pearl River. The altitude of Guiyang is high in the
Li, X., Zhao, X., Wang, S. and Liu, H.
Analysis on Evolution of Meteorological Factors in Central Guizhou.
In Proceedings of the 7th International Conference on Water Resource and Environment (WRE 2021), pages 23-27
ISBN: 978-989-758-560-9; ISSN: 1755-1315
Copyright
c
2022 by SCITEPRESS – Science and Technology Publications, Lda. All rights reserved
23
southwest and low in the northeast, alternating with
denuded hills, basins, valleys, and depressions.
Annual cumulative precipitation (ACP), maximum
one-day precipitation in a year (MP), average
temperature(AT), annual extreme maximum
temperature(MAXT), annual extreme minimum
temperature(MINT), time series data from 1959 to
2012, come from National Meteorological Science
Center in China are used.
3 ANALYSE OF THE TREND
PRECIPITATION AND
TEMPERATURE ON GUIYANG
STATION
3.1 Trend Analysis
Linear regression is used to simulate the change trend
of time series. In this method, the least square method
is used to solve the change slope of time series, and
the change trend of time series is analyzed. The
method can fit the change characteristics of time
series and reflect the real change of time series more
truly, the calculation method is as follows (Li et al,
2017):
Slope=
∑
∑
∙
∑
∑
∑
(1)
Where, Slope is the slope of the regression equation;
S
i
is the sequence value of S element in year i; n is the
length of the time series of the elements. When
Slope>0, show that the series increases in the research
time, that is, an upward trend, when Slope<0, show
that the series decreases in the research time, that is, a
downward trend.
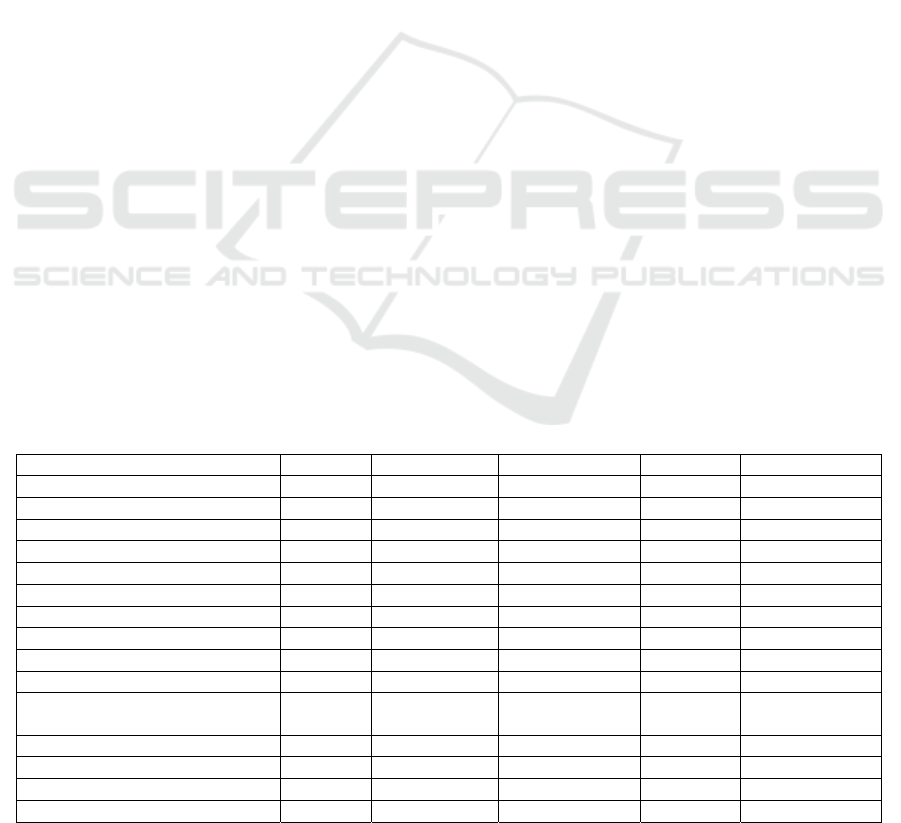
3.2 The Results of Trend Analysis
It can be seen from table 1, Figure 1 and Figure 2, the
average annual precipitation is 1103.7mm and
Perennial mean annual temperature is 15.1℃ from
1959 to 2012, the slopes are -1.9766 and -0.0147,
which show that these are downward trends, and the
annual average temperature has greater downward
trend than annual precipitation.
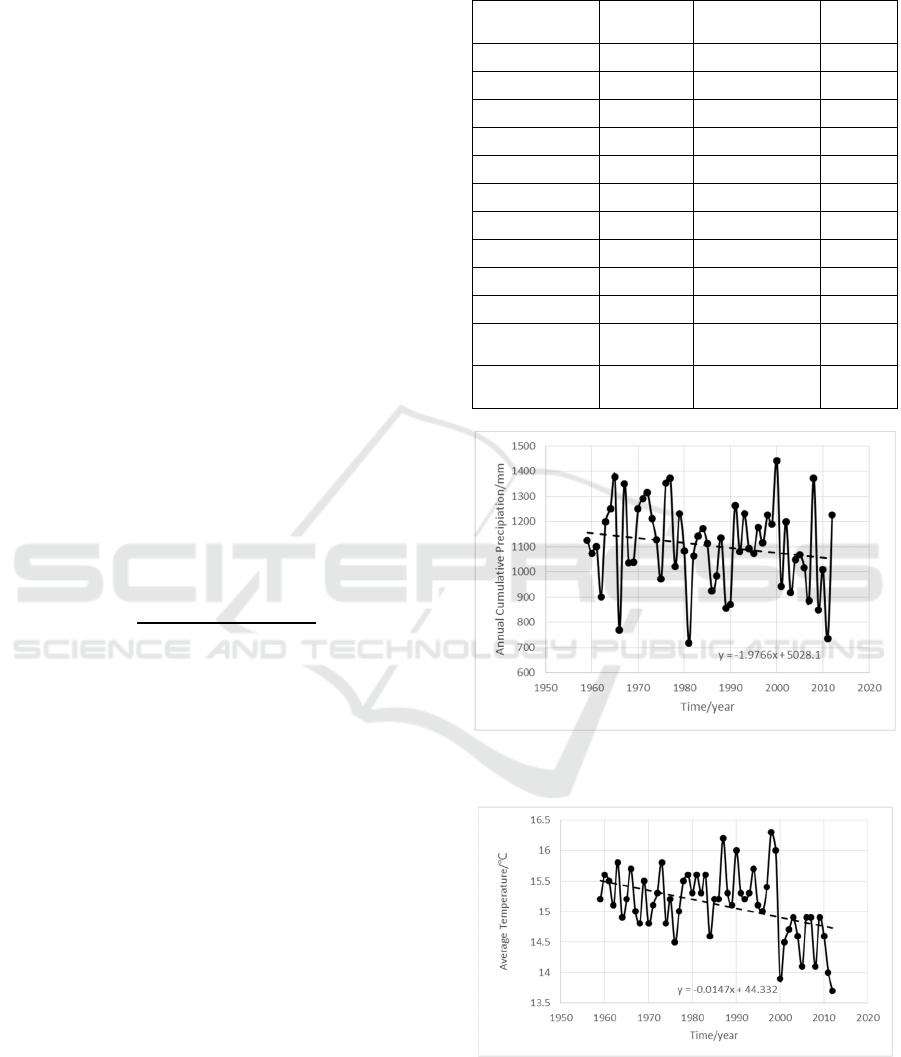
Table 1: Annual cumulative precipitation and average
temperature from 1959 to 2012 time series.
Year
ACP/m
mYear AT/℃
1959 1126.2 1959 15.2
1960 1074.2 1960 15.6
1961 1100.3 1961 15.5
1962 900.6 1962 15.1
1963 1198.3 1963 15.8
1964 1251.5 1964 14.9
…… …… …… ……
2010 1010 2010 14.6
2011 735.2 2011 14
2012 1226.4 2012 13.7
Slo
p
e -1.9766 Slo
p
e
-
0.0147
Average
Mean 1103.7
Average
Mean 15.1
Figure 1: Scatter plot of annual precipitation series and the
trend line.
Figure 2: The scatter diagram of average temperature series
and the trend line.
WRE 2021 - The International Conference on Water Resource and Environment
24
4 ALTERATION DIAGNOSIS OF
METEOROLOGICAL FACTORS
4.1 Hydrological Alteration Diagnosis
System ( Xie et al, 2010)
Deterministic components and stochastic
components are included in the hydrological series,
while deterministic components include cycle, trend,
and jump components. If the hydrological series has
nothing to do with cycle, trend and jump
components, it is a stable series, which indicates that
the whole hydrological series has the same physical
causes, and its statistical regulations is consistent,
that means the distribution form (such as p-III type)
and distribution parameters (such as mean value,
coefficient of variation) remain unchanged in the
whole time range of the series, the hydrological
series only has the same physical causes. Otherwise,
the hydrological series is non-stationary, which
indicates that the physical causes of the hydrological
series have changed, and the statistical regulation is
inconsistent, the distribution form or (and)
distribution parameters have changed. Therefore,
from a statistical point of view, the alteration of
hydrological series mainly refers to the significant
change of the distribution form or (and) distribution
parameters of hydrological series.
Hydrological alteration diagnosis system was
composed by Xie in 2010 to diagnose the alteration of
hydrological series. The system mainly considers two
alteration forms of trend and jump, and consists of
three parts: preliminary diagnosis(PD), detailed
diagnosis(DD) and comprehensive diagnosis(CD).
Firstly it adopts the Hurst coefficient method etc. to
make a primary diagnosis and judges whether or not
the series contains alteration. If it does, then various
examination methods may be used to conduct a
detailed diagnosis, including three trend diagnosis
methods and eleven jump up diagnosis methods. The
diagnosis results are also classified into two types,
trend and jump results, for which the trend
comprehensive and jump comprehensive are used
respectively. Nash efficiency coefficients are
calculated to identify alteration form of the series, and
the alteration form may be judged if the coefficient is
bigger than the other one, but a hydrological survey
analysis is often needed before making the conclusion
to confirm the diagnosis results. The system can
overcome the shortcoming of either a single-method
examination in producing unreliable results on
occasion or a multiple-methods examination in
producing a conflict among the results.
The system can not only identify and test the time
series alteration and its alteration degree (no
variation, medium variation, strong variation, and
great variation) as a whole, but also identify the
variation form (trend, jump variation point) of
inconsistent series. The test indexes are
comprehensive, the weight assignment is objective,
and the diagnosis result is reliable.
4.2 The Results of Alteration Diagnosis
Under the condition of the first reliability level
α=0.05 and the second reliability level β = 0.01, the
HADS was used to diagnose the meteorological
factors of Guiyang Station from 1959 to 2012, the
alteration diagnosis results shown in Table 2 as
below.
Table 2: Meteorological factors series alteration diagnosis results per area.
Factors AP MP AT MAXT MINT
Hurst coefficient 0.643 0.743 0.837 0.633 0.757
Total alteration degree no mediu
m
mediu
m
no mediu
m
Sliding F Test
1989(+) 1986(+) 1968(-)
Sliding T Test
1990(+) 1999(+) 1977(+)
Lee-He
g
hinan
1990
(
0
)
1999
(
0
)
1977
(
0
)
Se
q
uential Cluste
r
1990
(
0
)
1999
(
0
)
1977
(
0
)
RS anal
y
sis
1963
(
0
)
1977
(
0
)
2009
(
0
)
Brown-Forsythe
1990(+) 1999(+) 1977(+)
Sliding Run Test
1973(+) 2011(+) 2000(+)
Sliding Ran
k
-Sum Test
1990(+) 1999(+) 1977(+)
Optimal information two
segmentation
1993(0) 1999(0)
1977(0)
Mann-kendall
1990(+) 1999(+) 1982(+)
Ba
y
esian anal
y
sis
1990
(
+
)
1999
(
+
)
1977
(
+
)
Tendenc
y
alteration de
g
ree
none trend mediu
m
none
Relevant coefficient metho
d
-+ -
Analysis on Evolution of Meteorological Factors in Central Guizhou
25
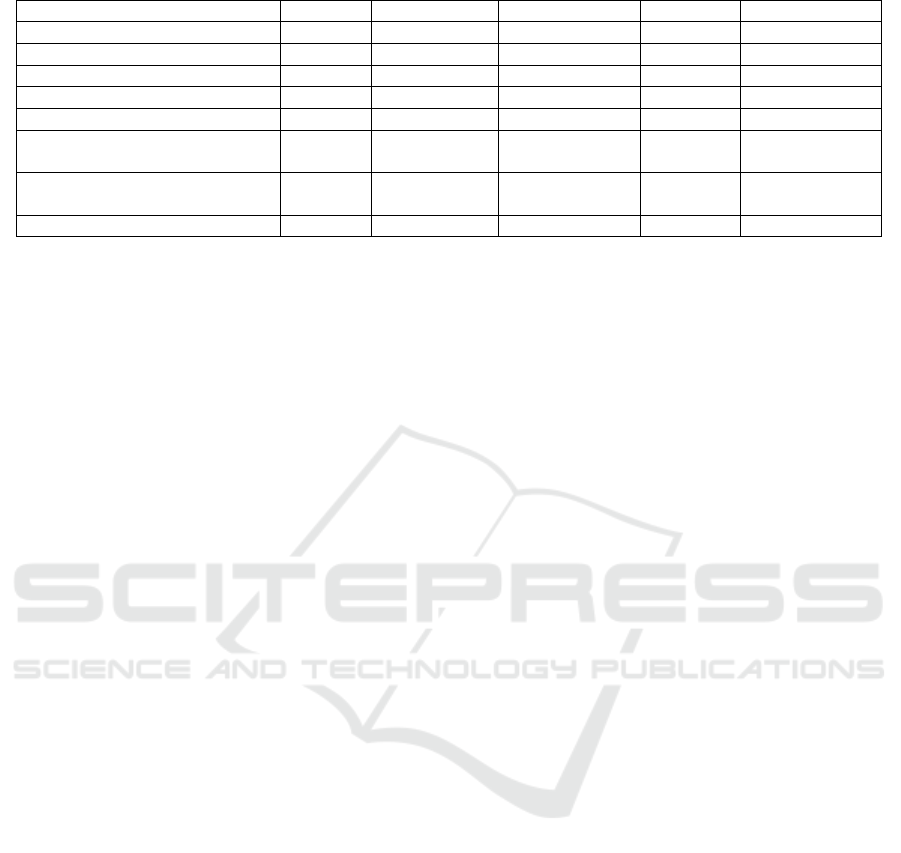
Table 2: Meteorological factors series alteration diagnosis results per area (cont.).
Factors AP MP AT MAXT MINT
Kendall
-+ -
Jum
p
p
oint
1990 1999 1977
Comprehensive weight
0.73 0.74 0.71
Comprehensive significant
5(+) 5(+) 4(+)
Comprehensive significant
3(-) 3(+) 3(-)
Efficiency coefficient of jump
alteration(%)
15.57 46.74
15.14
Efficiency coefficient of
tendenc
y
alteration
(
%
)
6.18 17.15
5.02
FINAL result 1990
(
+
)
↑ 1999
(
+
)
↓ 1977
(
+
)
↑
Where: the “+”, “-”, “0”,”↓”,” ↑” means significant, not significant, could not be tested, decrease and
increase
It can be seen from Table 2 that in the area annual
precipitation (AP) and annual extreme maximum
temperature (MAXT) series of the center in Guizhou,
the series are not alterated. The maximum one-day
precipitation in a year (MP) series of the center in
Guizhou, the series had medium alteration of jumping
upward, and the jumping points is 1990. The average
temperature (AT) series of the center in Guizhou, the
series had medium alteration of jumping downward,
and the jumping points is 1999. The annual extreme
minimum temperature (MINT) series of the center in
Guizhou, the series had medium alteration of jumping
upward, and the jumping points is 1977.
It can be seen from Figure 1, Figure 2 and table 2
that in the area AP and AT series of the center in
Guizhou, the trend are downward, and AP series had
no alteration and AT series had medium alteration. It
is shown that there is no connection between trend
and alteration, variation occurs when the trend or
jump exceeds a certain threshold.
MP, AT and MINT had medium alteration, the
variation indicate that the area is greatly affected by
climatic conditions, and whether it is affected by
human activities needs further study.
5 CONCLUSION AND
DISCUSSION
Deterministic components and stochastic components
are included in the meteorological series. ACP and
MAXT series had no alteration, show that annual
scale rainfall and annual extreme maximum
temperature had no obvious feedback to the climatic
conditions, from the perspective of statistics, the
deterministic components have little influence on the
series.At the same time, MP, AT and MINT had
medium alteration, the variation indicate that the area
is greatly affected by climatic conditions.
The maximum one-day precipitation in a year
series had medium alteration of jumping upward,
shows that extreme rainfall will be more frequent in
center Guizhou, and the time point is 1990. The
average temperature series had medium alteration of
jumping downward, shows that the temperature is on
the rise in the area, and the time point is 1999. The
annual extreme minimum temperature had medium
alteration of jumping upward, shows that the lowest
temperature is on the rise in the area, and the jumping
points is 1977.
Above all, precipitation has little impact on the
climatic conditions in the study area, but extreme
precipitation event is influenced by environmental
factors. Meanwhile, changes in temperature and
extreme temperature indicate a gradual warming
trend. Climate change has a great impact on the local
area. The extreme rainfall anomaly began in 1990, the
annual average temperature anomaly began in 1999,
and the extreme minimum temperature anomaly
began in 1977.
ACKNOWLEDGMENTS:
This work was supported by Guizhou Science and
Technology Project ([2019]2879, [2021]467); Special
thanks are given to the anonymous reviewers and
editors for their constructive comments.
REFERENCES
Chu, W. H, Yan, G. Q., & Su, W. C. (2008). Study on water
resources sustainable utilization of karst river basins.
Journal of Hydraulic Engineering, 39(6), 753-757.
Peng, J. T., Zhang, Q., & Liu C. L. (2012). Changing
properties of precipitation regimes over the Pearl River
Basin. Pearl River, 5, 13-217.
WRE 2021 - The International Conference on Water Resource and Environment
26

Li, X. N., Zhao, X. J., & Xu. B. (2017). Multi-timescale
analysis of rainfall in Karst in Guizhou, China. 3rd
International Conference on Water Resource and
Environmental Science (WRE 2017). IOP Conf. Series:
Earth and Environmental Science, 282, 012051.
Tang, S. S., Liao, W. H., & Song, W. Z. (2016).
Synchronous-asynchronous Encounter Probability of
Rich-poor Precipitation about the Guizhou Water
Transfer Project. Pearl River, 37(12), 22-28.
Tong, H. F., & Ye, A. Z. (2012). Probe into Characters of
Precipitation in Fogang County in Recent 50 Years.
Pearl River, 1, 24-28.
Wang, L. C., & Shi, Y. L. (2006). Formation Process and
Rational, 2006. Use of Water Resources and Transform
of Rainfall, Surface Water and Underground Water in
Karst Mountainous Area in Southwest China. Scientia
Geographica Sinica, 26(2),2173-2178.
Xie, P., Chen, G. C., & Lei, H. F. (2010). Hydrological
alteration diagnosis system. Journal of Hydroelectric
Engineering, 29, 85-91.
Analysis on Evolution of Meteorological Factors in Central Guizhou
27
