
What Predicts Students’ Academic Performance
Cholichul Hadi
1,*
, Suen Mein-Woei
2,†
, Danny Sanjaya Arfensia
1,‡
, Riris Ristiana
1,§
and Putu Vidyastitha Wiguna
1,**
1
Faculty of Psychology, Universitas Airlangga, Indonesia
2
Faculty of Psychology, Asia University, Indonesia
riris.ristiana-2019@psikologi.unair.ac.id, putu.vidyastitha.wiguna2019@psikologi.unair.ac.id
Keywords: Academic, Student, Performance, Academic Performance, Higher Education.
Abstract: The performance of a higher education institution was one of the crucial factors determining success in
producing quality graduates. Academic achievement obtained by students was considered the success of a
student and the learning system at the institution. The academic quality was also inseparable from the
background of the student itself. Besides, the design and climate of teaching and learning are created in the
educational environment. The purpose of this study was to describe students' academic performance and the
factors that influence the improvement in academic performance of undergraduate students majoring in
Psychology at Universitas Airlangga. This research used a quantitative approach with a descriptive survey
research design. Based on the results of research conducted, it concluded that student performance, study
program performance, and university performance, predict student's academic performance, both
simultaneously and partially for undergraduate students at the Faculty of Psychology, Universitas Airlangga.
1 INTRODUCTION
The quality of human resources is one of the keys to
the success of a country. In Indonesia, awareness of
improving the quality of human resources is
increasing in facing the Industrial Revolution 4.0.
They are supported by other factors such as the
economy, welfare, social, and others. One of the ways
to improve the quality of human resources is through
higher education (Olufemi, Adediran, & Oyediran,
2018:44). Increasing awareness of Indonesia's
people's importance of improving the quality of
human resources through education creates new
conditions among high schools in Indonesia. This
condition describes students in all corners of the
country competing to achieve a target of satisfying
academic results (Al-Zoubi & Younes, 2015:2262;
*
Prof. Dr. Cholichul Hadi, Drs., M.Si., Psikolog, Universitas
Airlangga, Faculty of Psychology, Jl. Airlangga 4-6,
Surabaya. E-mail: cholichul.hadi@psikologi.unair.ac.id
†
Suen, Mein-Woei (孫旻暐), Ph.D., Asia University,
Department of Psychology. E-mail: blake@asia.edu.tw
‡
Danny Sanjaya Arfensia, S.Psi, Universitas Airlangga,
Faculty of Psychology, Jl. Airlangga 4-6, Surabaya. E-mail:
dannysanjaya@staf.unair.ac.id
Guhn, Emerson, & Gouzouasis, 2019: 3). In line with
this, Ogweno, Kathuri, & Obara (2014:2) Conditions
describe increasingly fierce competition for the
quality of human resources in the world of work.
According to the Law of the Republic of
Indonesia, Number 2 of 1989, Article 16, paragraph
(1), Higher Education is a continuation of secondary
education held to prepare students to become
members of the community who have academic and
professional abilities that can apply, develop and
create knowledge, technology, and art (Siming et al.,
2015:114; Alsalem et al., 2017:3043). Higher
education participants are from now on referred to as
students (Alsalem et al., 2017:3044). According to
Tani et al. (2019:2), at the higher education level,
students must be active in the teaching and learning
process through existing media, such as libraries,
§
Riris Ristiana, Universitas Airlangga, Faculty of Psychology,
Jl. Airlangga 4-6, Surabaya. E-mail: riris.ristiana-
2019@psikologi.unair.ac.id
**
Putu Vidyastitha Wiguna, Universitas Airlangga, Faculty of
Psychology, Jl. Airlangga 4-6, Surabaya. E-mail:
putu.vidyastitha.wiguna-2019@psikologi.unair.ac.id
Hadi, C., Mein-Woei, S., Arfensia, D., Ristiana, R. and Wiguna, P.
What Predicts Students’ Academic Performance.
DOI: 10.5220/0010809700003347
In Proceedings of the 2nd International Conference on Psychological Studies (ICPsyche 2021), pages 131-143
ISBN: 978-989-758-580-7
Copyright
c
2022 by SCITEPRESS – Science and Technology Publications, Lda. All rights reserved
131

journals, and the internet. In addition, almost all
assignments in higher education generally require
students to look for the literature and develop their
mindset for practical task completion (Zotorvie,
2017:291). Furthermore, academic requirements in
higher education are not just following lectures. Still,
other provisions include the percentage of attendance
in lessons, completion of assignments, and active
participation in other academic activities (Gbollie &
Keamu, 2017:3).
Ergen & Kanadli (2017:56) stated that research on
student academic performance is an essential topic in
education. Performance is a measure of how
consistent and good the function of a product is (Al-
Zoubi & Younes, 2015:2266). Santrock in Bragdon &
Dowler (2016:17) stated that the quality of student
performance is indicated by numbers, letters, and
other signs that are the results of translating
descriptive assessment information where the
translation of descriptive assessment information into
numbers, notes, and other symbols is called grading.
Student performance can be arranged by comparing it
with the performance of other students or by setting
performance standards in advance (Ergen & Kanadli,
2017:66). Empirical academic performance can be
portrayed from three dimensions: the dimensions of
the student performance, the dimensions of the study
program performance, and the dimensions of the
university performance (Kapinga & Amani,
2016:80). Student performance dimensions include
aspects of tangibles (educational infrastructure),
reliability (reliability of lecturers and academic staff),
responsiveness (responsivity), assurance (treatment
of students), and empathy (understanding of student
interests). The dimensions of the study program
performance include aspects of curriculum, learning
and academic atmosphere, students and graduation,
human resources, educational facilities and
infrastructure, research, community service, and
cooperation, management systems. The dimensions
of the university performance include aspects of
student and graduate standards, curriculum standards,
learning and academic atmosphere, research and
community service, and quality assurance. For this
reason, this study sets targets on these three
dimensions covering all aspects covered therein. The
activity describes and analyzes the external and
internal factors that contribute significantly to
academic performance in education administration.
Finding factors that influence student academic
performance is essential for universities, lecturers,
and in some cases, for students themselves (Gull &
Shehzad, 2015:247; Bragdon & Dowler, 2016:14).
Cimermanova (2018:220) stated that these factors
would significantly affect university academic policy,
curriculum improvement, assessment of lecturers'
performance, and modification of the way lecturers
teach. Damavandi et al. (2011:188) stated that
research on student academic performance receives
excellent attention from stakeholders in education.
The aim is to find out the factors that need
improvement in improving student academic
performance to improve the quality of learning. In
addition, Kapinga & Amani (2016:79-80) explained
that the increasing number of students in specific
fields of study must be balanced with research that
can explain students' academic performance. This is
important to do to improve the quality of lecturers and
make improvements to the educational process in the
future. Research conducted by Li, Chen, & Duanmu
(2010:390), Kpolovie, Joe, & Okoto (2014:75),
Goulao (2014:239), and Ellore, Niranjan, & Brown
(2014:166) stated that performance academic before
entering university is the most significant influential
variable.
Through good academic performance, it is
expected that students can get exemplary academic
achievements. Student academic achievement
manifests student learning success, showing tenacity
and seriousness in learning (Abdi et al., 2016:866).
The definition of learning achievement, among
others, stated by Winkel in Alsalem et al.
(2017:3045), says that learning achievement is a
testament to a student's learning or ability to carry out
his learning activities by the weight achieved.
Meanwhile, according to Anderton, Evans, & Chivers
(2016:257), achievement or learning outcomes
(achievement) realize a person's potential skills or
capacities.
Mastery of learning outcomes can be seen from
their behavior, both in knowledge, thinking skills, and
motor skills. Ellore, Niranjan & Brown (2014:172)
defined learning achievement as perfection achieved
by thinking, feeling, and doing. Thus, learning
achievement is said to be perfect if it fulfills three
aspects, namely: cognitive (knowledge), affective
(attitude), and psychomotor (skill). On the other hand,
the achievement is less satisfying if someone has not
met the targets in these three criteria (Okay, et al.,
2016:60).
Learning achievement, which is the result of
measuring students includes cognitive aspects
(knowledge), affective (attitude), and psychomotor
(skills), can be known after an evaluation called
achievement test (achievement test) (Siming et al.,
2015:116). Therefore, based on some of the above
understanding, it can be concluded that learning
achievement is the level of ability possessed by
ICPsyche 2021 - International Conference on Psychological Studies
132

someone in digesting information obtained in the
teaching and learning process where the learning
achievement of a student is often presented in the
form of symbols in the form of numbers, letters or
sentences that tell the results achieved by each student
in a certain period.
According to Abid et al. (2016: 863), both factors
within the student (internal) and factors outside the
student (external) indicate many factors that affect
academic achievement. Internal factors, among
others: intelligence, self-concept, and so forth.
Logically, the things that can encourage students are
very influential on students in various aspects within
students. Multiple factors influence this. The
existence of these factors will undoubtedly create
several new factors. This unique factor will also affect
student academic outcomes. In this case, the authors
chose three variables in this study, namely academic
performance, academic integration, and social
integration (Gull & Shehzard, 2015:250). Students
who have studied at a university or college will have
academic performance or study achievement.
The general assumption regarding academic
integration is the level of adaptation of students in
carrying out their studies with the educational way of
life in universities (Kapinga & Amani, 2016: 82).
Students studying, in general, will experience a
transition between two different social, academic
conditions and life patterns. In this phase, students
will be faced with adjustments to the new
environment at colleges or universities. Bragdon &
Dowler (2016:18) defined academic integration as the
level of students being able to adapt to the
sustainability of the education that they are going
through.
Olufemi, Adediran & Oyediran (2018:46) shared
four academic integration concepts: academic, social,
personal emotional adjustment, and attachment
adjustments. Siming et al. (2015:116) state that
students who have a sense of comfort will be different
compared to students who do not have a sense of
comfort logically. The purpose of convenience, in this
case, is what is felt by students in academic and social
life while studying in college. Students will handle
these conditions if students' environment and living
conditions can positively support students in their
studies (Tani et al., 2019:6).
Students who have positive and supportive
conditions and environments are more focused on
student goals in pursuing studies in colleges or
universities (Zotorvie, 2017:295). Conversely,
students who have positive and supportive conditions
and environments will be less focused on achieving
their study goals at colleges or universities
(Damavandi et al., 2011:189). So students who do not
have this environment during their studies are
required to adapt to an environment that is not by the
level of comfort (Tani et al., 2019:7).
There are also external factors that affect student
academic achievement, including family, social
status, academic environment, and so on). This
research is a development of Ahmad & Safaria
(2013:27) which examined student academic
achievement. The situation in Indonesia has many
differences with the countries where the analysis is
carried out, both in terms of geographical, economic,
social, and cultural, and education, which is very
interesting to study. Geographically, Indonesia is an
archipelagic country, different from Ireland,
Singapore, or the United Kingdom, a country on an
island or continent. As an archipelagic country,
making the same educational standards evenly
distributed for all islands is more challenging. As a
developing country, economic conditions in
Indonesia are also different from developed countries
such as the UK and Singapore, where high social
inequalities still occur indicated by differences in
social strata background. This course will also make
a difference in the motivation and readiness of
students in studying at tertiary institutions (Gbollie &
Keamu, 2017:5).
The performance of a higher education institution
is one of the crucial factors determining success in
producing quality graduates (Anderton, Evans &
Chivers, 2016: 254). Therefore, the performance
appraisal must be done thoroughly on all elements
contributing to the ongoing academic activities. The
assessment carried out must be guided by the value
standards set by internal and external parties. One of
the assessment standards for tertiary institutions as an
educational institution is the performance of students,
which includes their inputs, processes, and outputs.
The most important thing to consider when the
learning process takes place is supervision of
incoming students, improvement of student ability,
achievement achieved by students, the ratio of the
number of students graduating to total students, and
graduate competencies (Okay, et al., 2016:62). The
results of these achievements certainly affect
students' accuracy in completing the time of the study,
and the graduates produced will have complete trust
from their users.
Academic planning should be done well to
achieve maximum academic performance. According
to Ergen & Kanadli (2017:60), academic performance
is based on two things, including academic and social
integration. Motivation and enthusiasm for learning
can influence the increase or decrease in academic
What Predicts Students’ Academic Performance
133

performance that can change one's self-confidence to
decrease the motivation that should arise from
themselves (Gbollie & Keamu, 2017:10). Academic
achievement obtained by students is considered the
success of a student and the learning system at the
institution. The academic quality is also inseparable
from the student's background besides the design and
climate of teaching and learning created in the
educational environment. A good GPA (Grade Point
Average) certainly makes the study period target
achieved with good quality. On the other hand, a
timely study period encourages a reduction in student
buildup in the final semester, resulting in poor ratios
and quality. Academic achievement is usually
measured through the GPA. The success in obtaining
a high GPA is generally influenced by many factors:
the student's study hours.
This study aims to describe students' academic
performance and what factors influence the
improvement in academic performance of students
majoring in Psychology at Universitas Airlangga. The
benefit of this research is as a form of knowledge and
scientific contribution regarding psychology and
human resource development related to students'
academic performance.
Based on the background of the problem, then are
there any research problem formulations that can be
submitted as follows:
1. How is the students’ academic performance of
majoring in Psychology at Universitas
Airlangga?
2. What factors influence improving the
students’ academic performance of majoring
in Psychology at Universitas Airlangga?
The hypothesis consists of:
H1: Student performance influences student's
academic performance.
H2: Study program performance influences
student's academic performance.
H3: University performance influences student's
academic performance.
2 METHOD
This study uses a quantitative approach (positivism)
with a descriptive survey research design to explain
the factors that influence students' academic
performance. Based on the data categories used, this
study is a cross-sectional study, while based on the
time of data collection, this study is a one-shot
method. The sampling method in this research is
nonprobability sampling with convenience sampling.
The sample's selection of the analysis unit was
obtained after considering the suitability and
limitations of data collection in this study, namely
undergraduate students of semesters 5 and 7 in the
academic year 2018-2019 majoring in Psychology,
Faculty of Psychology, Universitas Airlangga. The
reason is that most students in semester 5 and
semester 7 have taken courses that represent the field
of Introduction to Psychology and other compulsory
courses relating to primary Psychological
scholarship. In this study, researchers used the
Achievement Index (IP) as an indicator of student
academic performance in the S1 Department of
Psychology at Airlangga University, and 127 students
were obtained.
Research data in the form of primary data and
secondary data. Primary data in the form of
questionnaire data is distributed to students as
research objects online via a google form.
Questionnaire questions in this study are related to
three dimensions of academic performance and its
aspects, with 60 questions. Students can provide
answers using a Likert scale with a range of 1 - 5.
The secondary data is student achievement index
data obtained from the academic administration
database Universitas Airlangga. In the test instrument
used is the validity test and reliability test. The study
uses the classic assumption test and multiple linear
regression analysis in this study by describing the
framework of the research line of thinking as follow:
3 RESULT
3.1 Research Subject Description
In this study data analysis will use descriptive
statistical techniques and multiple linear regression
models. In an effort to process data in order to draw a
conclusion on the research, it uses the help of
computer applications through the SPSS 24 for
Windows program.
3.2 Instrumental Testing
3.2.1 Validity Testing
Validity can be defined as the extent to which
evidence and theory can support the interpretation of
the test scores used (American Educational Research
Association, 2014). Validity is divided into two,
namely research validity and measurement validity.
ICPsyche 2021 - International Conference on Psychological Studies
134
(Source: Primary Data, 2019)
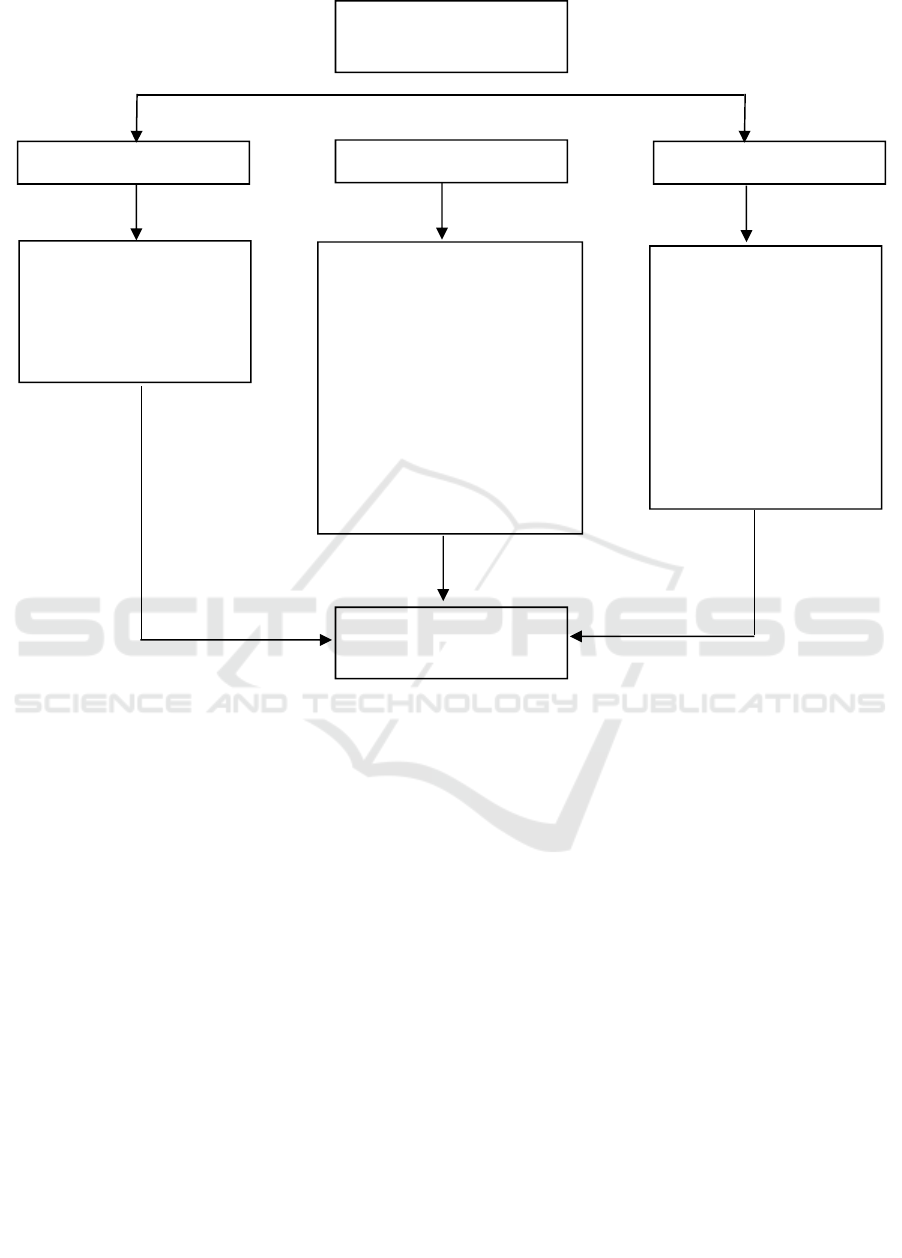
Figure 1: Thinking Flow Framework.
Research validity is defined as the degree of truth of
a conclusion drawn from a study, the degree of truth
is influenced and assessed based on the research
method used, the nature of the population from which
the sample is derived and the representativeness of
the research sample (Last, 2001, as cited in Murti,
2011). Measurement validity can be interpreted as the
extent to which a measuring instrument (instrument)
can measure what it purports to measure (Last, 2001,
as cited in Murti, 2011). In other words, a measuring
instrument (instrument) can be said to be valid if it
can measure and support the interpretation of test
scores in accordance with the purpose of the test. The
validation process relates to the process of gathering
relevant evidence with the aim of providing a solid
scientific basis for the interpretation of the proposed
score (American Educational Research Association,
2014).
The validity of the measurement consists of 4
aspects, namely: (1) Content validity; (2) Advance
validity; (3) construct validity; (4) Criterion validity.
In this study, the validity used is criterion validity.
Criterion validity focuses on the suitability of the
measurement results of a measuring instrument
(instrument) with an ideal measuring instrument
(standard), in the context of the variables studied
(Murti, 2011). Research with the validity of this
criterion is usually carried out by comparing the
measuring instruments owned with the ideal
measuring instrument (standard) qualitatively, so that
the measuring instrument has high criterion validity if
it is strongly correlated with the ideal measuring
instrument (standard).
To see the validity of the measuring instrument, it
is necessary to test the validity. The criterion validity
test was carried out through a significance test,
namely by comparing the value of r count with r table
for degree of freedom (df) = number of constructs -2.
If r count (for each item r can be seen in the corrected
item - total correlation column)> r table and the value
of r is positive, then the item or question is said to be
valid. The following are the results of the validity test
of this study:
Standardization of Student
Academic Performance
Student
Study Program
University
Tangibles
Reliability
Resposiveness
Assurance
Emphaty
Curriculum
Learning and academic
atmosphere
Students and graduation
Human resources
Academic facilities and
infrastructure
Research
Community service and
cooperation
Education administration
management system
Student and graduate
standards
Curriculum standards,
learning and academic
atmosphere
Research and
community service
Quality assurance
system
Improving Students’
Academic Performance
What Predicts Students’ Academic Performance
135

Table 1: The Result of Validity Test.
Variable Item Pearson Correlation r
tabel
Information
Student
Performance (X
1
)
X
1.1
0.990 0,300 Valid
X
1.2
0,845 0,300 Valid
X
1.3
0,881 0,300 Valid
X
1.4
0,991 0,300 Valid
X
1.5
0,993 0,300 Valid
Study program
performance (X
2
)
X
2.1
0,919 0,300 Valid
X
2.2
0,364 0,300 Valid
X
2.3
0,872 0,300 Valid
X
2.4
0,917 0,300 Valid
X
2.5
0,787 0,300 Valid
X
2.6
0,701 0,300 Valid
X
2.7
0,946 0,300 Valid
X
2.8
0,948 0,300 Valid
University
Performance (X
3
)
X
3.1
0,859 0,300 Valid
X
3.2
0,905 0,300 Valid
X
3.3
0,879 0,300 Valid
X
3.4
0,940 0,300 Valid
Students’
Academic
Performance (Y)
Y
1.1
0,859 0,300 Valid
Y
1.2
0,905 0,300 Valid
Y
1.3
0,879 0,300 Valid
Y
1.4
0,940 0,300 Valid
Y
1.5
0,872 0,300 Valid
(Source: Primary Data, 2019)
Based on Table 1, it can be seen that all items that
measure the independent variables namely work
discipline, motivation and compensation as well as
the dependent variable namely employee
performance, the entire statement items are declared
valid. This happens because the whole statement item
produces a calculated r value greater than 0.300.
3.2.2 Reliability Testing
Reliability is the overall consistency of a measure.
The results obtained will be high; if each subject's
consistency has consistent results. If the consistency
of the subject is low, the reliability results obtained
will also be below (American Educational Research
Association, 2014). There are two aspects of
measuring instrument reliability: (1) Internal
consistency, which shows that each question item is
correlated with the scores of all items. (2) Stability
which shows the stability of the measuring instrument
when used at different times (test-retest reliability),
the exact measuring instrument on two separate
occasions (intra-observer reliability), and various
measuring instruments on the same occasion (inter-
observer reliability) (Murti, 2011).
Because this instrument will describe the
variables in the research subject, a test is carried out
to show internal consistency, indicating that the items
on the questionnaire measure different aspects of the
same variable instead of measuring various aspects of
other irrelevant variables. In this study, we use
Cronbach's alpha. The higher Cronbach's alpha, the
better (consistent) the measuring instrument.
According to Streiner and Norman (2000), the
minimum cutoff of Cronbach's alpha for a measuring
instrument is 0.60. However, several authors use a
cutoff of 0.70 to classify consistency internal as
adequate and 0.80 as good (Murti, 2011). The
following are the results of the validity test of this
study:
ICPsyche 2021 - International Conference on Psychological Studies
136
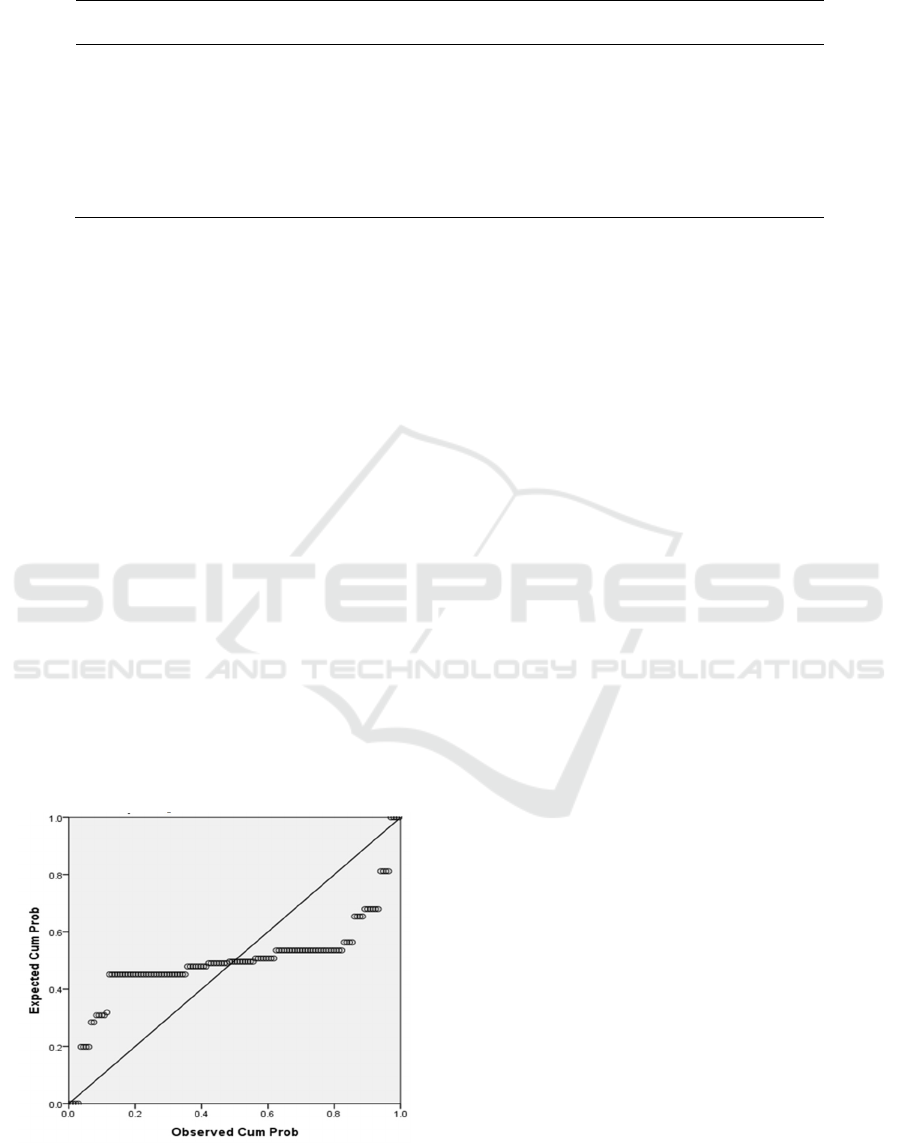
Table 2: The Result of Reliability Test.
Variable Cronbach Alpha Information
Student 0,968 Reliabel
Study Program 0,905 Reliabel
University 0,944 Reliabel
Academics’ Performance 0,961 Reliabel
(Source: Primary Data, 2019)
Table 2 shows that the statements in this
questionnaire are reliable because they have a
Cronbach alpha value greater than 0.6. This shows
that each item in the four variables as listed in the
table has very good consistency.
3.3 Classic Assumption Testing
3.3.1 Normality Testing
Normality test aims to test whether in the regression
model, the dependent variable, the independent
variable, or both have a normal distribution or not. A
good regression model is to have a normal data
distribution or statistical data spread on the diagonal
axis of the normal distribution graph. Normality
testing in this study is used by looking at the normal
probability plot which compares the cumulative
distribution of the actual data with the cumulative
distribution of normal data. The following are the
results of the data normality test using the P-Plot
graph:
Normal P-Plot of Regression Standardized Residual
Dependent Variabel :
(Source: Primary Data, 2019)
Figure 2: The Result of Normality Test Using P-Plot
Graphic.
From Figure 2 it can be seen that the data
distribution has followed a diagonal line between 0
(zero) with the meeting of the Y axis (Expected Cum.
Prob.) With the X axis (Observed Cum. Prob.). This
shows that the data in this study were normally
distributed. Thus, it can be concluded that the
regression model has fulfilled the normality
assumption.
3.3.2 Multicollinearity Testing
Multicollinearity Test aims to test the regression model
found a correlation between independent variables. A
good regression model should not occur correlation
between independent variables. If the independent
variables are correlated with each other, then these
variables are not orthogonal. Orthogonal variables are
independent variables whose correlation value
between independent variables is equal to zero. In this
study the technique to detect the presence or absence
of multicollinearity in the regression model is to look
at the value of Variance Inflation Factor (VIF), and the
tolerance value. If the tolerance value approaches 1,
and the VIF value around the number 1 and not more
than 10, it can be concluded that there is no
multicollinearity between the independent variables in
the regression model. The following are the results of
the multicollinearity test.
Based on Table 3 it can be seen that the tolerance
value approaches the number 1 and the value of the
variance inflation factor (VIF) is lower than 10 for each
variable, so this means that in the regression equation
there is no correlation between independent or
multicollinearity independent variables, so that all
independent variables (X) can be used in research.
What Predicts Students’ Academic Performance
137
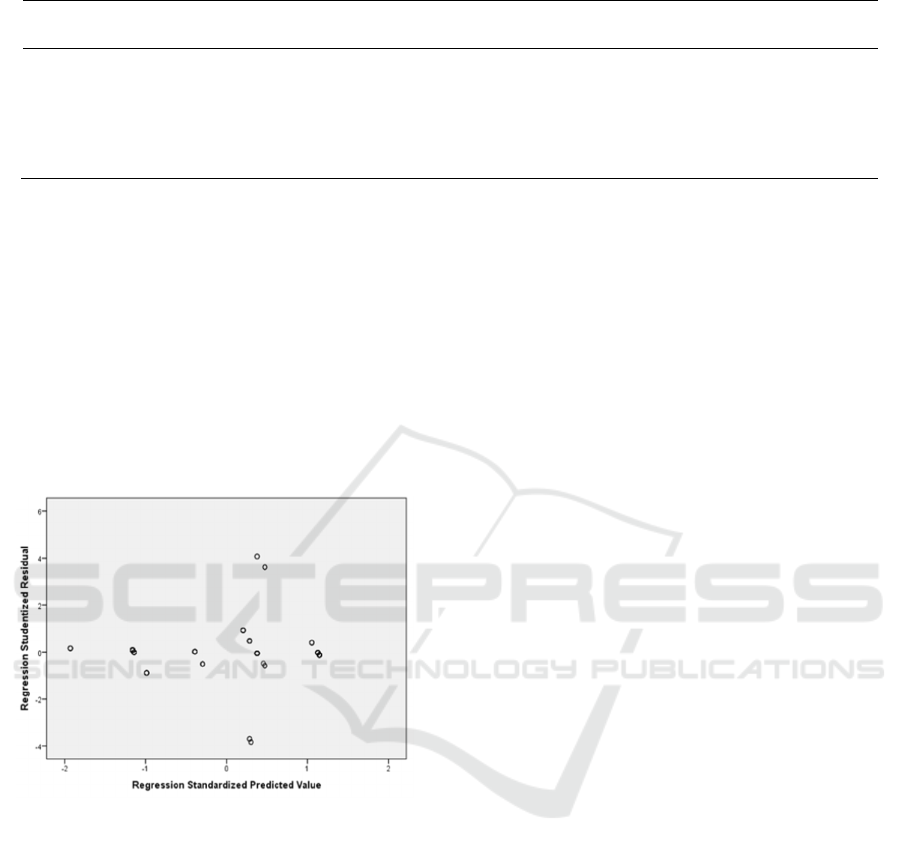
Table 3: The Result of Multicollinearity Test.
Variable Tolerance VIF Collinearity Statistics Information
Student Performance 0,53 8,735 Non-Multicollinearity
Study Program Performance 0,70 4,301 Non-Multicollinearity
University Performance 0,70 4,309 Non-Multicollinearity
(Source: Primary Data, 2019)
3.3.3 Heteroscedasticity Testing
The Heteroscedasticity test aims to test whether in the
regression model there is an inequality of variance
from one observation to another. The way to detect it
is by looking at the presence or absence of certain
patterns in the Scatterplot graph between SRESID
and ZPRED, where the Y axis is the predicted Y, and
the x axis is the residual (predictive Y - actually Y)
that has been standardized. The following are the
results of the heteroscedasticity test:
(Source: Primary Data, 2019)
Figure 3: Scatterplot Dependent Variable: Academic’s
Performance in the Heteroscedasticity Test.
Based on Figure 3 shows that the data is spread above
and below the number 0 (zero) on the Y axis and there
is no clear pattern on the spread of the data. This
means there is no heteroscedasticity in the regression
equation model, so that the regression model is
feasible to predict academic performance based on
the variables that influence it, namely students,
programs of study, and universities. After testing the
classic assumptions mentioned above, it can be
concluded that the linear regression equation model
in this study, is free from these basic (classical)
assumptions, so that decision making through the F
test and t test to be carried out in this study will not
be biased or appropriate with research purposes.
3.4 Multiply Linear Regression
Analysis
Regression equation in this study is to determine how
much influence the independent or independent
variables are student performance, programs of study
performance, university performance, and students'
academic performance. The mathematical formula of
multiple regression used in this study is as follows:
Y = a + b
1
X
1
+ b
2
X
2
+ b
3
X
3
+ e
Information:
Y: The dependent variable is the increase in
students' academic Performance
A: Constants
b
1
, b
2
, and b: Regression coefficients
X
1
: Variable of student performance
X
2
: Variable of study program performance
X
3
: Variable of university performance
E: Error disturbances
The following are the results of multiple linear
regression analysis tests:
Y = -0,056+ 0,891X
1
+ 0,102X
2
+ 0,024X
3
+ e
The results of the multiple linear regression
equation above provide an understanding that:
1) The constant value of -0.056, meaning that if
the student performance, study program
performance and university performance do
not exist or equal to 0, then the students’
academic performance will be 0.056.
2) β1 (student performance regression coefficient
value) is positive, meaning that if student
performance is increasing, the resulting
students’ academic performance is also
increasing.
ICPsyche 2021 - International Conference on Psychological Studies
138

Table 4: Multiple Linear Regression Test.
Model Unstandardized
Coefficient
Standardized
Coefficient
T Sig. 95,0% Confidence
Interval for B
B Std. Error Beta Lower
Bound
Upper
Bound
(Constant)
Student
Performance
Study program
Performance
University
Performance
-.056 .068 -.820 .414 -.192 .079
.891 .037 .875 23.828 .000
.817 .965
.102 .047 .101 2.147 .034
.008 .196
.024 .056 .021 .431 .667
-.087 .136
A Dependent Variable : Academic Performance
(Source: Primary Data, 2019)
Table 5: The Result of ANOVA
b
.
Model Sum of Squares df Mean Square F Sig.
1 Regression 72,807 3 24,269 3043,27 0,000
a
Residual 0,766 96 0,008
Total 73,573 99
(Source: Primary Data, 2019)
3) β2 (regression coefficient value of the study
program performance) is positive, meaning
that if the study program performance is
increasing, then the students’ academic
performance is also increasing.
4) β3 (the value of the university performance
regression coefficient) is positive, meaning
that if the university performance increases,
then students’ academic performance is also
increasing.
3.4.1 Model Feasibility (Goodness of Fit
Testing)
Goodness of Fit test is used to test the feasibility of
the model used in research. Goodness of Fit model
that can be seen from the value of the F test (analysis
of variance / ANOVA). The F test basically shows
whether all independent variables entered in the
model can be declared feasible if the probability value
is < 0.05 or declared inappropriate if the probability
value > 0.05. The following are the results of the
Goodness of Fit testing:
From the table above it can be seen that the F test
value with a significance level of 0,000 (under (0.05)
of 3043.27. If the probability value is less than 0.05
then the regression model is feasible to be used to
predict the simultaneous influence of the independent
variable. Based on the level of significance, it is
concluded that H
0
is rejected and H
a
is accepted,
which means that the independent variables
consisting of student performance, study program
performance, and university performance together
have a significant effect on the dependent variable,
namely students' academic performance.
3.5 Multiply Determination Coefficient
Analysis (R²)
The coefficient of multiple determination (R
2
) is the
amount of influence the independent variable gives to
the dependent variable. With R
2
, it can predict and see
how much the effect of the independent variable
contributes simultaneously to the dependent variable.
The value of R
2
ranges from 0 to 1. The smaller value
of R
2
, the weaker the influence of the independent
variable on the dependent variable. On the other hand,
if the result of R
2
is getting closer to number 1, the
effect given by the independent variable is getting
stronger. If in the research, the results of the R
2
value
are negative, it indicates that there is no influence of
the independent variable on the dependent variable
("Makna Koefisien Determinasi (R Square) dalam
Analisis Regresi linear Berganda," 2019). As
explained as follows:
Table 6: Determination Coefficient (R²).
Model R Square
1 .990
(Source: Primary Data, 2019)
What Predicts Students’ Academic Performance
139

Based on the results above, the value of the
coefficient of determination or R
2
is 0.990. These
results indicate that the student performance, study
program performance, and university performance,
simultaneously affect student academic performance
by 99%. While the remaining percentage, which is
1%, is influenced by other variables not examined. In
addition, because the value of R
2
is close to one, the
influence of the independent variable is powerful.
3.6 The Hypothesis Testing (t Test)
The hypothesis testing uses the t test to determine the
overall effect of the independent variable on the
dependent variable by comparing the significant t
value with a 95% real level. This study uses a
probability of 95% significance level or α = 0.05 so
that it can be seen the effect of individual independent
variables with the criteria if t is significant < α = 0.05,
it can be said that the independent variable has a
significant effect on the dependent variable. If t is
significant > α = 0.05, it can be said that the
independent variable has no significant effect on the
dependent variable. The following are the results of
testing the hypothesis in this study:
Table 7: The Result of t Test.
Model t Sig.
Student
15.576 0.000
Study Program
3,855 0.000
University
3,822 0.000
(Source: Primary Data, 2019)
Based on the multiple regression test calculations
listed in the above table, the test results provide an
understanding that:
1. The effect of student performance on student's
academic performance. Based on the results of
the table 7 calculation, the regression
coefficient value is positive and the
significance value for student is α = 0,000 <
0.05, indicating that student performance has
a significant effect on student academic
performance. So H
1
which states the alleged
influence of student performance on student's
academic performance is accepted.
2. The effect of the study program performance
on student's academic performance. The
results of the calculation of table 7, the
regression coefficient value is positive and the
significance value for the study program
performance is α = 0,000 < 0.05 indicating that
the study program performance has a
significant effect on students' academic
performance. So H
2
which states the alleged
influence of the study program performance
on students' academic performance is
accepted.
3. The effect of university performance on
student's academic performance. The results
of the calculation of table 7, the regression
coefficient value is positive and the
significance value for university performance
is α = 0,000 < 0.05 indicating that university
performance has a significant influence on
students' academic performance. So H
3
which
states the alleged influence of university
performance on student's academic
performance is accepted.
3.7 Discussion
Based on the results, the factors that influence the
academic performance of undergraduate students
majoring in psychology at Universitas Airlangga are
the student's performance, study program's
performance, and the university's performance, and
even those three factors have a significant effect. So
three hypotheses that mentioned above are accepted.
In a previous study, we found in Rimawati's
(2013) research that quality service of an academic's
employee as human resources of study program
performance's dimensions has positive and
significant result with student satisfaction that is
50,6% influence 8% more than other variables.
Service quality variables here must meet several
variables, including tangible, indicated by the
completeness of facilities and employee tidiness;
reliability, the ability of workers to provide services
appropriately and minimize errors; responsiveness,
indicated by the desire of workers to provide services
to students quickly and professionally; assurance,
including courtesy and, the experience provided by
workers makes student can comfortable, so they are
able to believe in workers; and lastly is empathy
which means employees' attention and understanding
of student needs. The variables that must be measured
from the workers and got good results from students
measured the same things in the dimensions of
student performance. So the following research
conducted six years ago has the same results and
supports this research, that student performance
affects student's academic performance significantly.
Santoso and Ekawaty (2018) also support the
above and this research, where universities took the
ICPsyche 2021 - International Conference on Psychological Studies
140

actions in showing empathy and paying attention to
student comfort affect student satisfaction. The place
where this research was conducted, namely the
international class, Faculty of Economics and
Business, Singaperbangsa University, Karawang, did
the following for student performance, namely:
● Providing counseling guidance for students
who have difficulties in the learning process,
● Providing scholarships as a form of
appreciation,
● Creating a learning atmosphere that is
conducive to learning, comfortable,
● Ensuring the completeness of learning
infrastructure.
In addition to facilities, the faculty also ensures
that the lecturers have good competence because
lecturers' competence increases student satisfaction
by 84%. If the competence of lecturers is
accompanied by academic performance, it gives a
simultaneous effect of 79.83% of student satisfaction.
The things done by the faculty and proven to be
related to student satisfaction will also play a role in
student academic performance because the things that
are done are included in the dimensions of student
performance, study program performance, and
university performance.
Besides that, Loscalzo et al (2018) found that
students with perfectionism have a better academic
performance because they spent time studying hours
and hours because they strive for a better GPA,
therefore enhance their academic achievement. So,
the length of time sacrificed by students to learn as
one of the student's performance affects student’
academic performance.
However, this study still has limitations due to
the small number of respondents participating.
Therefore, in further research, researchers are
expected to expand the reach to increase the number
of respondents. In addition, further research can also
consider other factors that have been stated in
previous studies, such as the influence of many
problems that students face. For example, Semb,
Glick, and Spencer (1979) said that lousy learning
habits, low motivation, and low academic scores
might cause students to fail and, worse, drop out.
Those are the problems regarding academic
performance. Also, some factors affect academic
performance. According to Ma et al (2018), a high
parental expectation positively influences students’
academic performance. High parental expectations
affect academic performance through students’
engagement and motivation to achieve academic
success. Cavilla (2017) found that self-reflection
influences academic performances. Students who
look at what they have been studying and perceive
their effort will learn the metacognitive strategy and
enhance their academic performance to about 40%.
Marcenaro-Gutierrez et al (2017) found that gender
differences also affect academic performance.
Female students tend to learn more about the subjects
on their own. Meanwhile, male students depend on
the initial studying skill, meaning they usually do not
study repeatedly. Cultural factors also take part in
influencing academic performance. Santrock (2011)
stated if a teacher learns about the ethical background
of his/her student, takes a closer look to his/her
student’s family, will know about the student's
interest, family characteristics, and parents’
occupation. The teacher will also learn about
language student uses outside the class so the teacher
can help his/her student outside the class. This will
help boost students’ academic performance.
4 CONCLUSION
Based on the results of research conducted, it can be
concluded that student performance, study program
performance, and university performance, predicts a
student's academic performance, both simultaneously
and partially for undergraduate students at the Faculty
of Psychology, Universitas Airlangga. One of the
assessment standards for universities as an
educational institution is students' academic
performance, which includes input, process and
output. The most important thing to consider when
the learning process takes place is supervision of
incoming students, improvement of student ability,
achievements of students, ratio of the number of
students graduating to total students and graduate
competencies.
The results of these achievements certainly affect
the accuracy of students in completing the time of
study, and the graduates produced will have full trust
from their users. The recommendations we propose in
this study include: 1.) The Faculty of Psychology,
Universitas Airlangga needs to encourage an increase
in the number of lecturers with Doctor / PhD
qualifications so that the impact on improving lecture
services can increase; 2.) The Faculty of Psychology,
Universitas Airlangga needs to develop instruments
to monitor and evaluate the academic services of
lecturers to students.
What Predicts Students’ Academic Performance
141

ACKNOWLEDGEMENTS
Researchers express gratitude to God Almighty for
His blessings and graces, we were able to complete
this research with good and optimal results. We do
not forget to say thank you to the Faculty of
Psychology, Universitas Airlangga, who provided
research analysis subjects and also students who were
respondents in this study. We would also like to thank
Airlangga Global Engagement for providing the
opportunity to conduct collaborative research with
Asia University.
REFERENCES
Abid, M. A., Kanwal, S., Nasir, M. A. T., Iqbal, S. & Huda,
N. U. (2016). The Effect of Locus of Control on
Academic Performance of the Students at Tertiary
Level. International Review of Management and
Business Research, 5(3), 860-869.
Ahmad, A. & Safaria, T. (2013). Effects of Self-Efficacy on
Students’ Academic Performance. Journal of
Educational, Health, and Community Psychology, 2(1),
22-29.
Alsalem, W. S. Y., Alamodi, L. A., Hazazi, A. T. M.,
Shibah, A. M., Jabri, S. A., Albosruor, Z. A. (2017).
The Effect of Time Management on Academic
Performance among Students of Jazan University. The
Egyptian Journal of Hospital Medicine, 69(8), 3042-
3049. http://dx.doi.org/10.12816/0042853
Al-Zoubi, S. M. & Younes, M. A. B. (2015). Low
Academic Achievement: Causes and Results. Theory
and Practice in Language Studies, 5(11), 2262-2268.
http://dx.doi.org/10.17507/tpls.0511.09
American Educational Research Association. (2014).
Standards for Educational and Psychological Testing.
Anderton, R. S., Evans, T. & Chivers, P. T. (2016).
Predicting Academic Success of Health Science
Students for First Year Anatomy and Physiology.
International Journal of Higher Education, 5(1), 250-
260.
Arimawati, R. (2013). Pengaruh Kualitas Pelayanan
Kinerja Pegawai Administrasi Akademik Terhadap
Kepuasan Mahasiswa Fakultas Egonomika dan Bisnis
Universitas Diponegoro [Undergraduate’s Thesis,
Universitas Diponegoto]
Bragdon, R. A. & Dowler, K. (2016). College Student
Technology Use and Academic Performance.
International Journal of Humanities and Social
Science, 6(1), 12-22.
Cavilla, D. (2017). The effects of student reflection on
academic performance and motivation. Special
Collection-Student Diversity SAGE Open.
https://doi.org/10.1177/2158244017733790
Cimermanová, I. (2018). The Effect of Learning Styles on
Academic Achievement in Different Forms of
Teaching. International Journal of Instruction, 11(3),
219-232. https://doi.org/10.12973/iji.2018.11316a
Damavandi, A. J., Mahyuddin, R., Elias, H., Daud, S. M. &
Shabani, J. (2011). Academic Achievement of Students
with Different Learning Styles. International Journal of
Psychological Studies, 3(2), 186-172. http://dx.doi.org/
10.5539/ijps.v3n2p186
Ellore, S. B., Niranjan, S. & Brown, U. J. (2014). The
Influence of Internet Usage on Academic Performance
and Face-to-Face Communication. Journal of
Psychology and Behavioral Science, 2(2), 163-186.
Ergen, B. & Kanadli, S. (2017). The Effect of Self-
Regulated Learning Strategies on Academic
Achievement: A Meta-Analysis Study. Eurasian
Journal of Educational Research, 69(4), 55-74.
http://dx.doi.org/10.14689/ejer.2017.69.4
Gbollie, C. & Keamu, H. P. (2017). Student Academic
Performance: The Role of Motivation, Strategies, and
Perceived Factors Hindering Liberian Junior and Senior
High School Student Learning. Education Research
International, 1, 1-12. https://doi.org/10.1155/2017/
1789084
Goulao, M. F. (2014). The Relationship Between Self-
Efficacy and Academic Achievement in Adults’
Learners. Athens Journal of Education, 1(3). 237-246.
https://doi.org/10.30958/aje.1-3-4
Guhn, M., Emerson, S. D. & Gouzouasis, P. (2019). A
Population-Level Analysis of Associations Between
School Music Participation and Academic
Achievement. Journal of Educational Psychology, 1, 1-
22. http://dx.doi.org/10.1037/edu0000376
Gull, F. & Shehzad, S. (2015). Effects of Cooperative
Learning on Students’ Academic Achievement.
Journal of Education and Learning, 9(3), 246-255.
Kapinga, O. & Amani, J. (2016). Determinants of Students’
Academic Performance in Higher Learning Institution
in Tanzania. Journal of Education and Human
Development, 5(4), 78-86. https://doi.org/10.15640/
jehd.v5n4a8
Kpolovie, P. J., Joe, A. I. & Okoto, T. (2014). Academic
Achievement Prediction: Role of Interest in Learning
and Attitude Towards School. International Journal of
Humanities Social Sciences and Education, 1(11), 73-
100.
Li, G., Chen, W. & Duanmu, J. (2010) 'Determinants of
International Students' Academic Performance: A
Comparison between Chinese and Other International
Students'. Journal of Studies in International
Education, 14(4), 389-405. http://doi.org/10.1177/
1028315309331490
Loscalzo, Y., Rice, S. P. M., Giannini, M., & Rice, K. G.
(2018). Perfectionism and academic performance in
Italian college students. Journal of Psychoeducational
Assessment. https://doi.org/10.1177/0734282918800784
Ma, Y., Siu, A., & Tse, W. S. (2018). The role of high
parental expectation in adolescents’ academic
performance and depression in Hong Kong. Journal of
Family Issues, 39 (9), 2505-2522. http://doi.org/
10.1177/0192513X18755194
ICPsyche 2021 - International Conference on Psychological Studies
142

Makna Koefisien Determinasi (R Square) dalam Analisis
Regresi linear Berganda. (2019, March 28). SPSS
Indonesia. https://www.spssindonesia.com/2017/04/m
akna-koefisien-determinasi-r-square.html
Murti, B. (2011). Validitas dan Reliabilitas Pengukuran.
Matrikulasi Program Studi Doktoral.
Ogweno, P. O., Kathuri, N. N. & Obara, J. (2014). Influence
of Students Characteristics on Academic Performance
in Secondary Agriculture in Rachuonyo North Sub
Country of Kenya. International Journal of Education
and Research, 2(3), 1-12.
Oke, K., Ayodele, K. O., Aladenusi, O. & Oyinloye, O. &
Comfort, A. (2016). Academic Motivation,
Satisfaction, and Resilience as Predictors of Secondary
School Students’ Academic Confidence in Ogun State
of Nigeria. Journal of Research & Method in
Education, 6(6), 59-64. http://doi.org/10.9790/7388-
0606015964
Olufemi, O. T., Adediran, A. A. & Oyediran, W. O. (2018).
Factors Affecting Students’ Academic Performance in
Colleges of Education in Southwest Nigeria. British
Journal of Education, 6(10), 43-56.
Santoso, M. P. T., Ekawaty, N. (2018). Pengaruh
Kompetensi Dosen Terhadap Kinerja Akademik dan
Kepuasan Mahasiswa: Studi Kasus Kelas Internasional
di Program Studi Manajemen dan Akuntansi Fakultas
Ekonomi dan Bisnis Universitas Singaperbangsa
Karawang. Buana Ilmu, 3(1).
Santrock, J. (2010). Educational Psychology. McGraw-
Hill Companies
Semb, G., Glick, D, M., & Spencer, R, E. (1979). Student
withdrawls and delayed work patterns in self-paced
psychology courses. Teaching of Psychology, 6 (1), 23-
25. http://doi.org/10.1207/s15328023top06018
Siming, L., Niamatullah. Gao, J., Xu, D. & Shafi, K. (2015).
Factors Leading to Students’ Satisfaction in the Higher
Learning Institutions. Journal of Education and
Practice, 6(31), 114-118.
Tani, K., Dalzell, E., Ehambaranathan, N., Murugasu, S. &
Steele, A. (2019). Evaluation of Factors Affecting
Students’ Performance in Higher Education in New
Zealand. Journal of Pedagogical Research, 3(2), 1-10.
http://dx.doi.org/10.33902/JPR.2019252504
Zotorvie, J. S. T. (2017). Students’ Accommodation and
Academic Performance: The Case of Ho Technical
University in Ghana. European Scientific Journal,
13(13), 290-302. http://dx.doi.org/10.19044/esj.2017.v
13n13p290
What Predicts Students’ Academic Performance
143
