
Epidemiology of Childhood Obesity and Their Lifestyle in Preschool
Children from Medan Deli
Zata Ismah, Saidah Fatimah Sari Simanjuntak, Rahayu Sakinah Pasaribu, Apriliani,
Rani Elviyanti Siregar, Siti Khadijah and Ahmad Rizqi Aulia Ramadhan Lubis
Faculty of Public Health, Universitas Islam Negeri Sumatera Utara, Deli Serdang, Indonesia
relmorra@gmail.com, khodijahazhar39@gmail.com, auliarizqi121@icloud.com
Keywords: Obesity, Lifestyle, Early Childhood.
Abstract: Obesity in children is a serious problem because it can interfere with children's growth and continue into
adulthood. This study aims to determine the epidemiology of obesity and how the lifestyle in early childhood
in Medan Deli. This research is a descriptive quantitative study using a cross-sectional design with a rapid
survey approach. The population in this study were all early childhood children in Medan Deli, with a sample
of 210 people. The sampling method was the WHO proportional random sampling, which was 30 clusters x
7 samples. The results found 13.8% obese early childhood and 13.3% overweight children. The most obese
early childhood children were girls, aged 56-60 months, with a history of obese parents. In the lifestyle of
obese early childhood, they rarely do physical activity, often consume milk, fruit, vegetables, soft drinks, and
junk food and live with smokers and often inhale cigarette smoke. The incidence of obesity in early childhood
in the study area is high with a very vulnerable lifestyle to their health in the future, such as rarely doing
physical activity, often consuming milk, soft drinks and junk food, and being exposed to cigarette smoke.
1 INTRODUCTION
Overweight and obesity are defined as abnormal or
excessive fat accumulation that can be detrimental to
health. It is a major risk factor for chronic diseases,
including diabetes, cardiovascular disease and
cancer. Furthermore, considered a problem in high-
income countries, overweight and obesity are also
increasing in low- and middle-income countries
(WHO, 2021b).
WHO states that in 2016 more than 124 million
children in the world were obese. Obesity in children
in the world has increased from 4.2% in 1990 to 6.7%
in 2010 and is expected to reach 9.1% in 2020. In
2010, obesity in children under five years in
developing countries reached 5.4% and increased in
2012 to 6.7% (WHO, 2021c).
Based on Riskesdas 2018 data, the prevalence of
obesity in children in Indonesia is 8.04%, and
Riskesdas 2013 data shows that the prevalence of
overweight and obesity in children in North Sumatra
is 10.5%. The prevalence of obesity in children in
Medan City has increased from 1.7% in 2016 to 1.9%
in 2017, with the highest prevalence in Medan Deli
District, which is 21%
(Dinkes Kota Medan, 2016,
2018; Kemenkes RI, 2013, 2018)
Obesity in children occurs in three critical period
that are the first year of life, ages 5-6 years, and
adolescence. Along with the times, there is a change
in lifestyle among the community, especially children.
This change is a contributing factor to obesity.
According to Pavilianingtyas (2017) research, the
risk of obesity in children can be influenced by three
factors, namely the agent, the host, and the
environment. Agent factors include fast food
consumption habits and light physical activity, host
factors including genetics, and environmental factors,
including household income and expenditure levels
and mother's education level (Pavilianingtyas, 2017).
Obesity in children is a very serious problem
because it can interfere child development then
continue into adulthood and can be risk factors for
diseases such as hypertension, type 2 diabetes,
hyperlipidaemia, NAFLD, polycystic ovary
syndrome, sleep disorders, and depression. For that,
detection of obesity needs to be done early on
(Benzies et al., 2018).
Early childhood, in general, can be found in Early
Childhood Education (PAUD). The types of PAUD
Ismah, Z., Simanjuntak, S., Pasaribu, R., Apriliani, ., Siregar, R., Khadijah, S. and Lubis, A.
Epidemiology of Childhood Obesity and Their Lifestyle in Preschool Children from Medan Deli.
DOI: 10.5220/0010759300003235
In Proceedings of the 3rd International Conference on Social Determinants of Health (ICSDH 2021), pages 77-87
ISBN: 978-989-758-542-5
Copyright
c
2022 by SCITEPRESS – Science and Technology Publications, Lda. All rights reserved
77
in Indonesia are playgroups (KB), kindergartens (TK)
and raudhatul athfal (RA). The range of early
childhood according to Article 28 of the National
Education System Law No.20/2003 paragraph 1 is 0-
6 years. Meanwhile, according to the NAEYC
(National Association For The Education Of Young
Children), the range of early childhood is 0-8 years
(golden age) (Depdiknas, 2003).
Many studies on obesity in adults and adolescents
have been carried out, especially in Medan, North
Sumatra. However, studies related to obesity in early
childhood (0-6 years) are still few. Based on some of
the considerations above, researchers are interested in
analyzing obesity in early childhood. Therefore, this
study aimed to describe the incidence of obesity in
early childhood in Medan Deli District in 2019.
2 METHOD
2.1 Type of Research
This research is descriptive quantitative research
using the Epidemiological rapid survey method,
conducted in November 2019.
2.2 Population and Research Sample
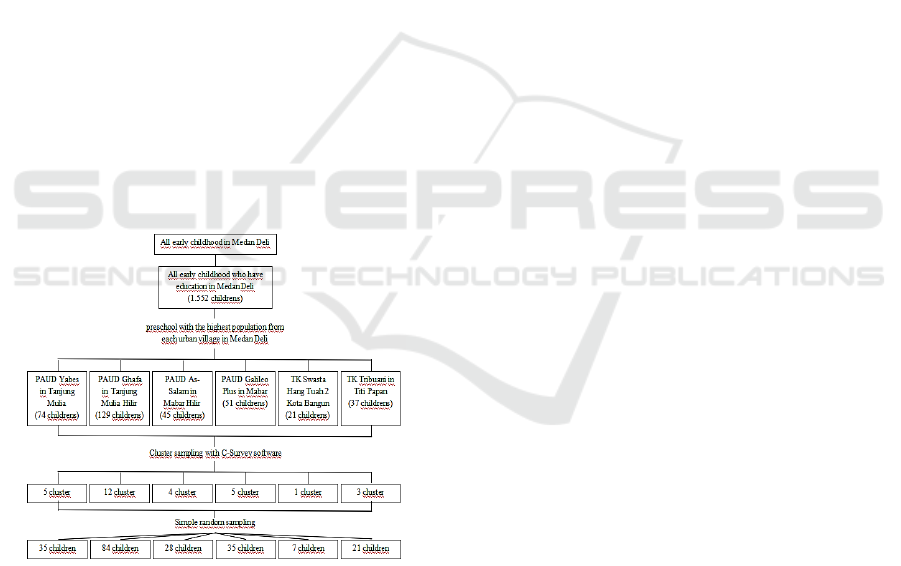
Figure 1. Sampling Profile’s Chart
The population in this study is all early childhood in
the District of Medan Deli. The sample used is 210
people with the calculation of using the WHO Rapid
Survey approach, which is 30 clusters x 7 samples
with the help of C-Survey software. Sampling shows
in the figure above.
2.3 Data Collection
Data was collected primarily with a research
instrument in the form of a questionnaire containing
questions about demographic characteristics, physical
activity, diet and exposure to cigarettes.
Determination of obese and non-obese respondents
was carried out using a Z-Score table, which
compared the values of Body Mass Index (BMI)
through weighing (kg) and measuring height (m) with
age. Bodyweight was measured using a scale, and
height was measured using a microtome.
2.4 Research Instruments
The instrument in this study used the Global Physical
Activity Questionnaire (GPAQ). The GPAQ
instrument is useful for measuring the level of
physical activity originating from WHO. In
comparison, Food Frequency Questionnaire (FFQ)
instrument of the Ministry of Health of the Republic
of Indonesia is to measure the frequency of eating in
a day, consumption of milk in a day, consumption of
snacks in a day, soft drinks in a week, consumption
of fast food in a week, consumption of junk food in a
week, consumption of fruit in a week, consumption
of vegetables in a week.
2.4.1 Definition of Obesity
Obesity is a condition of the accumulation of excess
fat in the body. Obesity in children is a medical
condition characterized by an above-average body
weight index (BMI). Children with obesity are one of
the public health problems that can harm children in
the future (Camara-Lopes et al., 2013; Jannah &
Utami, 2018; Reilly et al., 2003).
Obesity criteria in children can be measured using
a Body Mass Index (BMI) chart adjusted for age,
weight, height, and sex of the child. Z scores for
Height/Age and BMI/Age were calculated using the
WHO Anthro Plus program (Kemenkes RI, 2011).
According to Kemenkes RI, the Height/Age z-
score data are categorized as follows:
1. > 2 SD to + 3 SD: Obesity
2. 1 SD to + 2 SD: Overweight
3. -2 SD to + 1 SD: Normal.
In addition, the determination of obesity and
overweight in children can be determined through the
following index :
A. For children ≤ 5 years (WHO, 2021a)
1. Overweight : > +1 SD (equivalent to BMI 25
kg/m2 at 19 years)
ICSDH 2021 - International Conference on Social Determinants of Health
78

2. Obesity: > +2 SD (equivalent to BMI 30
kg/m2 at 19 years)
3. Thinness: < -2sd >
B. For children >5 years (World Health
Organization (WHO), 2021)
1. Overweight : >+2 SD above WHO Child
Growth Standards median (Weight for
Height)
2. Obesity : >+3 SD above the WHO Child
Growth Standards median (Weight for
Height).
2.5 Data Analysis
The analysis used in this study is univariate analysis.
The univariate analysis will describe the incidence of
obesity in early childhood in Medan Deli District in
2019, then describe the demographic characteristics,
physical activity, eating patterns and exposure to
cigarettes.
3 RESULT
The results of the research conducted are as follows:
Table 1: Frequency Distribution of Respondents Demographic Characteristics (n = 210).
Variable N % 95% CI
Sex
Boy 115 54.8% 48.2 - 61.9
Girl 95 45.2% 38.1 - 51.8
A
g
e
(
months
)
36
–
49 16 7.6% 3.9
–
11.4
50
–
63 162 77.1% 72.0
–
84.1
64 - 77 32 15.2% 10.1
–
20.0
Father's Education Level
Low
(
SD and SMP
)
43 20.5% 15.7 - 25.4
Hi
g
h
(
hi
g
h school and universit
y)
167 79.5% 74.6 - 84.3
Mother's Education Level
Low (SD and SMP) 35 16.7% 11.4 - 21.0
High (high school and university) 175 83.3% 79.0 - 88.6
Father's occu
p
ation
Does not wor
k
2 1.0% 0.0 - 2.4
Teacher/ TNI/ Sat
p
ol PP 32 15.2% 10.5 - 20.0
entrepreneu
r
125 59.5% 51.0 - 65.6
Merchants 21 10.0% 5.7 - 13.3
Labour/ Drive
r
30 14.3% 9.7 - 20.0
Mother's Job
Housewife 174 82.9% 78.6 - 88.6
Teache
r
16 7.6% 3.9 -11.3
Midwife 1 0.5% 0.0 - 1.4
Merchants 8 3.8% 1.4 - 6.7
entre
p
reneu
r
11 5.2% 2.4 - 7.6
Parents' Income Level
Low
(
≤ R
p
. 1.000.000,-
)
3 1.4% 0.0 - 3.8
Medium (Rp. 1.000.000 - Rp. 2.000.000,-) 46 21.9% 16.2 - 28.4
High (> Rp. 2.000.000,-) 161 76.7% 71.0 - 81.9
Parental Obesity Histor
y
Obesit
y
26 12.4% 8.1 - 17.1
No Obesit
y
184 87.6% 82.9 - 91.9
BMI/U Status
Obesity (>2SD) 29 13.8% 9.0 - 19.0
Fat (> 1 SD to 2 SD) 28 13.3% 9.0 - 18.0
Normal
(
-2 SD to 1 SD
)
136 64.8% 58.2 - 71.6
Underwei
g
ht
(
-3 SD to < -2 SD
)
9 4.3% 1.9 - 7.0
Ver
y
Thin
(
< -3 SD
)
8 3.8% 1.4 - 6.5
Epidemiology of Childhood Obesity and Their Lifestyle in Preschool Children from Medan Deli
79

Based on table 1, the majority of respondents are
girl (54.8%), with a maximum age of 50-63 months
(77.1%), having a father and mother with a high level
of education (79.5%) and (83.3%), most of the
respondents' fathers work as entrepreneurs (59.5%),
and the mother's occupations are mostly housewives
(82.9%), the majority of respondents' parents have
high incomes above Rp. 2.000.000,- (76.7%). About
12.4% of respondents have parents with a history of
obesity and 13.8% of the 210 respondents have
obesity BMI/U status that is >2 SD.
Table 2: Frequency Distribution of Respondents Demographic Characteristics with Obesity Status (n = 29)
Variable N % 95% CI
Sex
Boy 14 48.30% 32.0 - 70.4
Girl 15 51.70% 29.6 - 68.0
Age (months)
36 – 49 1 3.40% 0.0 - 14.8
50 – 63 24 82.80% 66.9 - 96.0
64 – 77 4 13.80% 2.9 - 26.0
Father's Education Level
Low (SD and SMP) 8 27.60% 10.7 - 41.2
High (high school and university) 21 72.40% 58.8 - 89.3
Mother's Education Level
Low (SD and SMP) 5 17.20% 3.3 - 33.3
Hi
g
h
(
hi
g
h school and universit
y)
24 82.80% 66.7 - 96.7
Father's occupation
Does not wor
k
0 0.00% -
Teacher/ TNI/ Satpol PP 8 27.60% 13.3 - 46.0
Entrepreneur 18 62.10% 43.2 - 78.7
Merchants 1 3.50% 0.0 - 11.0
Labor/ Drive
r
2 6.80% 0.0 - 19.0
Mother's Job
Housewife 25 86.20% 73.2 - 97.3
Teache
r
2 6.80% 0.0 - 18.7
Midwife 1 3.50% 0.0 - 15.0
Merchants 0 0.00% -
Entrepreneur 1 3.50% 0.0 - 11.2
Parents' Income Level
Low (≤ Rp. 1.000.000,-) 1 3.50% 0.0 - 11.5
Medium (Rp. 1.000.000 - Rp. 2.000.000,-) 4 13.80% 3.0 - 29.6
High (> Rp. 2.000.000,-) 24 82.70% 68.2 - 95.6
Parental Obesity History
Obesity 17 58.60% 38.5 - 77.0
No Obesit
y
12 41.40% 23.0 - 61.5
Based on table 2, the majority of obese
respondents are girl (51.7%), with a maximum age of
50-63 months (82.8%), having a father and mother
with a high level of education (72.4%) and (82.8%),
most of the respondents' fathers work as
entrepreneurs (62.1%), and the mother's occupations
are mostly housewives (86.2%), the majority of
respondents' parents have high incomes above Rp.
2,000,000,- (82.7%), and also has a history of obesity
(58.6%).
ICSDH 2021 - International Conference on Social Determinants of Health
80

Table 3: Physical Activity of Respondents with Obesity Status (n = 29)
Variable N % 95% CI
Never 1 3.50% 0.0 - 12.1
Rarely (1 time a week) 15 51.70% 35.6 - 71.4
Often (3 times a week) 13 44.80% 25.0 - 60.8
Based on table 3. one respondent who is obese
never does physical activity (3.5%), and the majority
rarely does physical activity (1 time a week)
(51.70%).
Table 4: Frequency of Respondents' Daily Physical Activity Time with Obesity Status (n = 29)
Variable (minutes) N % Mean Min Max SD
95% CI of
Mean
5 - 31 5 17.2%
99.83 5 210 58,653
4.0 - 33.1
32 - 58 0 0.0% -
59 - 85 7 24.1% 10.9 - 38.9
86 - 112 3 10.3% 0.0 - 22.9
113 - 139 8 27.6% 11.8 - 45.4
140 - 166 0 0.0% -
167 - 193 4 13.8% 3.7 - 29.9
194 - 220 2 6.9% 0.0 - 16.0
221 - 247 0 0.0% -
Based on table 4, there are 17.2% of obese
respondents do a physical activity only for 5 – 31
minutes a day. The average physical activity of obese
respondents is 99.83 minutes per day or about 1.6
hours
Table 5: Dietary Patterns of Respondents with Obesity Status (n = 29)
Variable N % 95% CI
Breakfast Every Morning
Breakfast 27 93.10% 81.1 – 100
No Breakfast 2 6.90% 0.0 - 18.9
Consumption of Milk
Yes 22 75.90% 59.1 - 91.7
Not 7 24.10% 8.3 - 40.9
Type of Milk Consumed
Sweet Thick 6 27.30% 9.7 - 52.2
Powde
r
12 54.50% 29.2 - 78.7
Fresh/ Liquid 4 18.20% 3.9 - 35.8
Like Consumption of Snacks
Yes 23 79.30% 64.8 - 92.6
Not 6 20.70% 7.4 - 35.2
Based on table 5, 93.1% of obese respondents eat
breakfast every morning and 24.1% do not drink milk.
27.3% of obese respondents consume sweetened
condensed milk and like to eat snacks (79.3%).
Epidemiology of Childhood Obesity and Their Lifestyle in Preschool Children from Medan Deli
81
Table 6: Frequency Distribution of Respondents' Eating Patterns with Obesity Status (n = 29)
Variable N % Mean Min Max SD 95% CI of Mean
Number of meals in a da
y
2 times 0 0.00%
3.10 3 4 0.310
-
3 times 26 89.70% 77.4 - 100
4 times 3 10.30% 0.0 - 22.6
Amount of Milk Consum
p
tion in a Da
y
Neve
r
7 24.10%
1.52 0 3 1,122
9.2 - 40.7
1 time 7 24.10% 7.5 - 43.7
2 times 8 27.60% 9.9 - 47.1
3 times 7 24.10% 9.8 - 41.2
Amount of Snack Consum
p
tion in a Da
y
Neve
r
1 3.50%
2.52 0 7 1,595
0.0 - 13.0
1 time 8 27.60% 10.8 - 47.2
2 times 7 24.10% 9.8 - 41.2
3 times 13 44.80% 23.3 - 62.6
Consum
p
tion of Soft Drinks in a Wee
k
Neve
r
1 3.50%
2.21 0 4 1.082
0.0 - 13.0
1 time 8 27.60% 10.8 - 47.2
2 times 7 24.10% 9.8 - 41.2
3 times 13 44.80% 23.3 - 62.6
Consum
p
tion of Fast Food in a Wee
k
Neve
r
7 24.10%
1.66 0 5 1,565
7.2 - 43.8
1 time 11 37.90% 19.4 - 54.4
2 times 3 10.30% 0.0 - 24.2
3 times 8 27.60% 10.6 - 46.7
Consum
p
tion of Junk Food in a Wee
k
Neve
r
1 3.50%
3.59 0 7 1,763
0.0 - 11.5
1 time 2 6.90% 0.0 - 17.5
2 times 3 10.30% 0.0 - 25.0
3 times 23 79.30% 61.5 - 95.1
Consumption of fruit in a wee
k
Neve
r
2 6.90%
3.52 0 7 2,544
0.0 - 17.5
1 time 6 20.70% 6.6 - 38.5
2 times 3 10.30% 0.0 - 24.5
3 times 18 62.10% 42.8 - 82.2
Consumption of Vegetables in a Wee
k
Neve
r
3 10.30%
4.1 0 7 2,623
0.0 - 21.7
1 time 4 13.80% 0.0 - 30.0
2 times 2 6.90% 0.0 - 16.7
3 times 20 69.00% 52.5 - 87.8
Based on table 6, 10.3% of obese respondents eat
4 times a day and 24.1% do not drink milk. And that
44.8% of obese respondents consumed snacks and
soft drinks 3 times, with the most consumption being
7 times and 4 times a day. 27.6% of obese
respondents consumed fast food 3 times, with the
most consumption being 5 times a week. 79.3% of
obese respondents consumed junk food 3 times, with
the most consumption 7 times a week. There are 6.9%
of obese respondents who never eat fruit and 10.3%
who never eat vegetables.
ICSDH 2021 - International Conference on Social Determinants of Health
82

Table 7: Cigarette Exposure of Respondents with Obesity Status (n = 29)
Variable N % 95% CI
Living With Smokers
Yes 21 72.40% 53.2 - 88.4
Not 8 27.60% 11.6 - 46.8
Smokin
g
area
In the roo
m
14 66.70% 46.2 - 85.3
Outdoors 7 33.30% 14.7 - 53.8
Cigarette Type
Non Filter Cigarettes 2 9.50% 0.0 - 23.9
Ci
g
arette Filte
r
19 90.50% 76.1 - 100.0
Based on table 7, the majority of obese
respondents live with smokers (72.4%), that smoke
the most in indoors (66,7%), with the most consumed
type of cigarette is filter cigarettes (90,5%).
Table 8: Frequency Distribution of Respondents' Cigarette Exposure with Obesity Status (n = 29)
Variable N % Mean Min Max SD 95% CI of Mean
Length of Stay with Smokers
2 Years 2 9.50%
4.33 2 6 1,155
0.0 - 23.7
> 2 - 3 Years 4 19.10% 5.2 - 35.0
4 Years 15 71.40% 54.7 - 90.5
How long does a child inhale cigarette smoke in a day
Never 5 23.80%
1.38 0.5 3 0.958
5.3 - 42.6
Rarely (< 3 Hours) 3 14.30% 43.3 - 85.7
Often (≥ 3 Hours) 13 61.90% 0.0 - 31.1
Length of Children with Smokers in a Week
Never 5 23.80%
4.95 1 7 3,122
5.6 - 46.5
Rarely (< 3 days) 1 4.80% 0.0 - 16.7
Often (≥ 3 days) 15 71.40% 50.0 - 90.2
Based on table 8, respondents who are obese
mostly live with smokers for 4 Years (71.4%) with an
average stay of 4.3 years. 61.9% of obese respondents
often inhale cigarette smoke in a day approx3 hours,
and the average respondent is obese with smokers a
week for almost five days a week.
4 DISCUSSION
4.1 Sex
The results showed that the majority of obese children
were girls (51.7%). The sexes of boy and girl have
different tendencies in obesity in children, where the
sexes differ in their intake and food. This is in line
with Lindhom's research (2019) that the proportion of
overweight in early childhood is higher in girls
(10.6%) than boys. (7.9%), as well as obesity status
is more common in girls (2.5%) than boys (2%)
(Lindholm, 2019; Malik & Bakir, 2006). However,
Suriani's (2019) study showed that the incidence of
obesity was higher in boys than girls because boys
more have a large appetite than women and require
more energy and intake (Suriani, 2019).
4.2 Age
The results showed that the most obese children aged
56-60 months or equivalent to 4-5 years (82.7%). The
incidence of obesity occurs in adults and occurs in
many age groups of children. According to
Lindholm's research (2019), early childhood 5 years
(42-60 months) were significantly more overweight
and obese. However, based on Faridah & Indriani
(2017) research, the most obese preschool children
are aged >5 years (Faridah & Indriani, 2017;
Lindholm, 2019).
Epidemiology of Childhood Obesity and Their Lifestyle in Preschool Children from Medan Deli
83

4.3 Education
The results showed that children with obesity status
had fathers and mothers with high levels of education,
namely (72.4%) and (82.8%). Parents' education level
has a positive correlation with the incidence of being
overweight (overweight), where the better the
socioeconomic status of the parents, the more likely
they are to change their children's eating habits. So
that the incidence of childhood obesity in this study
is a sign of high levels of social status, fertility and
parental welfare; however, this is not following the
previous researches which shows that children with
obese status have parents with low levels of education
(de Munter et al., 2016; Sartika, 2011).
4.4 Income
The results showed that children with obesity status
came from families with high incomes or above Rp.
2,000,000/month (82.7%). WHO (2000) states that
income affects increasing household consumption,
such as consuming foods high in fat and meat.
Following Hadi's research (2005), obesity tends to
occur in children who come from high-income
families because family income supports the ability
to buy fast food that is high in energy. Parents with
high incomes tend to give sizeable pocket money to
their children. With a large enough pocket money,
children usually consume everyday foods such as
junk food and fast food (Hadi, 2005; WHO, 2000).
4.5 Obesity History
The results showed that most obese children had
parents with a history of obesity (58.6%). Haines et
al. (2007) showed that obesity in parents has a
positive relationship with the incidence of obesity in
children. Genetic factors are associated with weight
gain, BMI, waist circumference and physical activity.
If the father and/or mother are overweight
(overweight), then there is a 40-50% chance that the
child will also be overweight (obese), but if both
parents are obese, then there is a 70-80% chance that
the child will also be obese (Haines et al., 2007).
4.6 Physical Activity
The results showed that the majority of obese children
rarely did a physical activity or 1 time/week (51.7%),
and the most time to do physical activity was 113-139
minutes/day (28.6%), with physical activity in the
form of playing soccer, playing bicycles, and playing
catch-up. According to Brambilla (2011) research,
children do physical activity at least 3 times a week
to train muscles and bones as a process of energy
expenditure in preventing obesity in children
(Brambilla et al., 2011).
According to the Australian Government
Department of Health, toddlers and preschoolers
perform active activities for 3 hours a day to prevent
obesity (Australian Government Department of
Health, 2021). Following research conducted,
children who are declared obese carry out the
physical activity for 113 to 139 minutes or about 2
hours per day. Doing physical activity every day is
very beneficial for the body. In addition to getting a
healthy body condition, it is also beneficial for mental
health and entertainment in preventing stress. Low
physical activity is a factor that can affect the
occurrence of obesity in children, so that the role and
support of parents are needed in children's physical
activity activities to prevent obesity (Kurniasih et al.,
2010; Mustelin et al., 2009).
4.7 Consumption of Milk
The results showed that most obese children liked to
drink milk (75.9%), with an average consumption of
2 times/day, with the type of milk consumed in the
form of powdered milk (54.5%). Similar research was
also produced by Dougkas et al. (2019), which
showed that obese preschool children aged 2-6 years
always consume energy drinks derived from dairy
sources, such as low-fat milk, high-fat milk, and
sweetened condensed milk (Dougkas et al., 2019).
4.8 Consumption of Soft Drink
The results showed that most obese children
consumed soft drinks 3 times/week (44.8%). The
habit of consuming various types of soft drinks can
increase the occurrence of obesity. The risk is even
higher than those who love fried foods. According to
Faridah and Indriani (2017), there is a relationship
between soft drink consumption and the incidence of
obesity in children that children who consume soft
drinks 2 times/week are obese (54.9%) and
overweight (10.7%) (Faridah & Indriani, 2017).
Soft drinks usually contains sparkling
(carbonated) water, sweeteners, and natural or
artificial flavours. Sweeteners can be sugar, high
fructose cereal syrup, fruit juices, sugar substitutes (in
diet drinks) (Begunca, 2019).
ICSDH 2021 - International Conference on Social Determinants of Health
84

4.9 Consumption of Fast Food
The results showed that obese children consumed fast
food once per week (37.9%). According to Suryanti's
research (2013), fast food contains a lot of sugar and
fat, increasing the accumulation of calories in body
fat tissue (Suryanti, 2013).
According to Hardinsyah's research (2012), the
increasing incidence of childhood obesity at this time
is caused by the consumption of fast food, which
contains high calories and fat and is low in fibre, so
that frequent consumption of fast food can lead to
overweight and obesity in children (Hardinsyah,
2012).
Fast food is available quickly and ready to eat,
such as fried chicken, pizza, burgers, french fries,
pasta, nuggets, sausages, fried foods and so on such
as KFC, hamburgers, pizza (Hardinsyah, 2012;
Virgianto & Purwaningsih, 2016).
4.10 Consumption of Junk Food
The results showed that obese children consumed
junk food 3 times/week (79.3%). According to
Virgianto's research (2016), junk food can cause
obesity because the content of junk food is high in
sugar and fat, so children who often consume junk
food can have risk factors for obesity (Virgianto &
Purwaningsih, 2016).
Ashlesha and Nancy's research (2012) found that
children who consumed junk food 3 times/week had
a 3.28 times greater risk of being overweight
(overweight) and obesity than those who rarely or 1-
2 times/week. The high frequency of consuming junk
food can increase the accumulation of calories in the
body, causing an abnormal increase in BMI in
children (Ashlesha & Nancy, 2012).
Junk food has a low nutritional content to little
nutrition. However, junk food has a high-fat content
and is not good for human health. Examples of junk
food are candy, soft drinks, chocolate, potato chips or
light snacks, ice cream, and much more (Musa, 2010).
4.11 Consumption of Vegetables and
Fruits
The results showed that children with obesity status
consumed vegetables and fruit as much as 3
times/week (69%) and (62.1%). The level of fruit and
vegetable consumption determined by the
Government of Indonesia and the Guidelines for
Balanced Nutrition (PGS) is a minimum of 3 to 5
servings a day. One of the causes of overweight or
obesity in children is the low consumption of
vegetables and fruits (Anggraeni, 2016).
Consumption of vegetables and fruit is a source of
fibre which is very important for children's growth, so
it is closely related to the incidence of obesity in
children. Children who are overweight (overweight)
and obese need foods that are high in fibre. Based on
the General Guidelines for Balanced Nutrition
(PUGS), the recommended consumption of
vegetables and fruit is at least 3 servings/day. To
prevent obesity in children, it is always recommended
to eat at least 3 servings of vegetables and fruit every
day (Field et al., 2003; Kemenkes RI, 2003).
4.12 Cigarette Exposure
The results showed that most obese children lived
with smokers (72.4%), and most lived for 4 years
(71.4%). Smokers smoke the most indoors (66,7%),
with the type of cigarette consumed in the form of
filter cigarettes (90,5%). The majority of respondents
often smoke cigarettes for 3 hours/day(61.9%) and
often with a smoker while the smoker is smoking for
3 hours/week (71.4%). According to research by
Cornelius et al. (2001), there is a positive relationship
between exposure to cigarettes from the first year of
birth and overweight (OR: 2.08, 95% CI: 1.02); this
is in line with the meta-analysis conducted by Oken
et al. (2007) that there is a relationship between
mothers who smoke during pregnancy and after
delivery, which is significantly related to the
incidence of obesity in children (Cornelius et al.,
2001; Oken et al., 2008).
The quantity of cigarettes smoking is associated
with an increased risk of being overweight at 5 years
of age. One cigarette smoked and inhaled per day by
children can increase the risk of overweight and
obesity in children. There is a significant relationship
between exposure to cigarette smoke and the Z-Score
BMI of children in the pooled analysis. Children who
have one parent who smokes and are exposed to
secondhand smoke 4 years experienced an increase in
the BMI Z-Score value of 0.27 SD (95% CI: 0.08-
0.47), and for children who have two parents who are
smoking, experienced a higher BMI Z-Score value
increase of 0.39 SD (95% CI: 0.14-0.65) compared to
children who did not have parents who smoked
(Robinson et al., 2016).
5 CONCLUSION
The incidence of obesity in early childhood in Medan
Deli District is generally occurred due to heredity,
Epidemiology of Childhood Obesity and Their Lifestyle in Preschool Children from Medan Deli
85

rarely do physical activity, often consume milk, soft
drinks and junk food, and exposure to cigarette
smoke.
ACKNOWLEDGEMENTS
Thanks to Allah SWT, who has made it easy for this
research to be completed without any significant
obstacles, besides that, thanks also to dean faculty of
public health UIN Sumatera Utara, Mr. Prof. Dr.
Syafaruddin, M.Pd, who have guided so that this
research can be completed, as well as for criticism
and suggestions from all of you.
REFERENCES
Anggraeni, A. S. (2016). Hubungan Pola Konsumsi Buah
Dan Sayur Dengan Risiko Obesitas Pada Anak Usia
Sekolah Di Sdn Ketabang I Surabaya [PhD Thesis].
Universitas Airlangga.
Ashlesha, D., & Nancy, N. (2012). Junk Food in Schools
and Childhood Obesity. J. Policy And Manage, 31(2),
312–337.
Australian Government Department of Health. (2021,
January 14). For infants, toddlers and preschoolers
(birth to 5 years) [Text]. Australian Government
Department of Health; Australian Government
Department of Health.
https://www.health.gov.au/health-topics/physical-
activity-and-exercise/physical-activity-and-exercise-
guidelines-for-all-australians/for-infants-toddlers-and-
preschoolers-birth-to-5-years
Begunca, A. (2019). Soft Drink Consumer Segmentation
Using Demographic and the Consumption
Characteristics Case Study City Of Pristina. European
Journal of Business, Economics and Accountancy.
Benzies, K. M., Yates., M. T., Patel., A. B., Afzal., A. R.,
Kurilova., J., & McNeil., D. A. (2018). Association
Between Obesity In 4 to 7 Year‐Old Children and Eight
Types Of Crime: A Hierarchical Linear Modelling
Approach. Obesity Science and Practice.
Brambilla, P., Pozzobon, G., & Pietrobelli, A. (2011).
Physical activity as the main therapeutic tool for
metabolic syndrome in childhood. International
Journal of Obesity, 35(1), 16–28.
Camara-Lopes, G., Mattedi, R., Antunes, A. A., Carnevale,
F. C., Cerri, G. G., Srougi, M., Alves, V. A., & Leite,
K. R. (2013). The histology of prostate tissue following
prostatic artery embolization for the treatment of
benign prostatic hyperplasia.
Cornelius, J. R., Lynch, K., Martin, C. S., Cornelius, M. D.,
& Clark, D. B. (2001). Clinical correlates of heavy
tobacco use among adolescents. Addictive Behaviors,
26(2), 273–277.
de Munter, J. S., Friedl, A., Lind, S., Kark, M., Carlberg,
M., Andersson, N., Georgellis, A., & Rasmussen, F.
(2016). Stability in the prevalence of Swedish children
who were overweight or obese in 2003 and 2011. Acta
Paediatrica, 105(10), 1173–1180.
Depdiknas. (2003). Undang-Undang RI No. 20 Tahun 2003
Tentang Sistem Pendidikan Nasional.
Dinkes Kota Medan. (2016). Profil Kesehatan Kota Medan
Tahun 2016.
Dinkes Kota Medan. (2018). Profil Kesehatan Kota Medan
Tahun 2017.
Dougkas, A., Barr, S., Reddy, S., & Summerbell, C. D.
(2019). A critical review of the role of milk and other
dairy products in the development of obesity in children
and adolescents. Nutrition Research Reviews, 32(1),
106–127.
Faridah, D., & Indriani, S. K. M. (2017). Faktor Yang
Berhubungan Dengan Overweight Dan Obesitas Pada
Anak Usia Prasekolah Di TK ‘Aisyiyah Bustanul Athfal
Kecamatan Tegalrejo Kota Yogyakarta [PhD Thesis].
Universitas’ Aisyiyah Yogyakarta.
Field, A. E., Gillman, M. W., Rosner, B., Rockett, H. R., &
Colditz, G. A. (2003). Association between fruit and
vegetable intake and change in body mass index among
a large sample of children and adolescents in the United
States. International Journal of Obesity, 27(7), 821–
826.
Hadi, H. (2005). Beban Ganda Masalah Gizi dan
Implikasinya Terhadap Kebijakan Pembangunan
Kesehatan Nasional. Pidato Pengukuhan Jabatan Guru
Besar Pada Fakultas Kedokteran Universitas Gadjah
Mada.
Haines, J., Neumark-Sztainer, D., Wall, M., & Story, M.
(2007). Personal, behavioral, and environmental risk
and protective factors for adolescent overweight.
Obesity, 15(11), 2748–2760.
Hardinsyah. (2012). Kebiasaan Sarapan Anak Indonesia
berdasarkan Data Riskesdas 2010. Jurnal Gizi Dan
Pangan. Secretariat Pergizi Pangan Indonesia,
Departemen Gizi Masyarakat. FEMA IPB, Bogor.
Jannah, M., & Utami, T. N. (2018). Faktor Yang
Mempengaruhi Terjadinya Obesitas Pada Anak
Sekolah Di SD N 1 Sigli Kabupaten Pidie Tahun 2018.
Jurnal Kesehatan Global, 1(3), 110–118.
Kemenkes RI. (2003). Pedoman Umum Gizi Seimbang
(PUGS). Direktorat Jenderal bina Kesehatan
Masyarakat, Departemen Kesehatan RI.
Kemenkes RI. (2011). Keputusan Menteri Kesehatan
Republik Indonesia tentang Standar Antropometri
Penilaian Status Gizi Anak.
Kemenkes RI. (2013). Riskesdas 2013.
Kemenkes RI. (2018). Riskesdas 2018.
Kurniasih, D., Hilmansyah, H., Astuti, M. P., & Imam, S.
(2010). Sehat dan bugar berkat gizi seimbang. Jakarta:
Kompas Gramedia, 93–94.
Lindholm, A. (2019). Overweight and Obesity In Preschool
Children, Early Risk Factors and Early Identification
Overweight and Obesity In Preschool Children (Issue
56).
ICSDH 2021 - International Conference on Social Determinants of Health
86

Malik, M., & Bakir, A. (2006). Prevalence of Overweight
and Obesity Among Children In The United Arab
Emirates. Obes. Rev, 8(1), 15–20.
Musa. (2010). Faktor Risiko Obesitas Pada Remaja.
Mustelin, L., Silventoinen, K., Pietiläinen, K., Rissanen, A.,
& Kaprio, J. (2009). Physical activity reduces the
influence of genetic effects on BMI and waist
circumference: A study in young adult twins.
International Journal of Obesity, 33(1), 29–36.
Oken, E., Levitan, E. B., & Gillman, M. W. (2008).
Maternal smoking during pregnancy and child
overweight: Systematic review and meta-analysis.
International Journal of Obesity, 32(2), 201–210.
Pavilianingtyas, A. (2017). Faktor Agen, Pejamu dan
Lingkungan Kejadian Obesitas Pada Anak Usia 5-6
Tahun. Jurnal Gizi Indonesia, 5(2), 105–111.
Reilly, J. J., Methven, E., McDowell, Z. C., Hacking, B.,
Alexander, D., Stewart, L., & Kelnar, C. J. H. (2003).
Health consequences of obesity. Archives of Disease in
Childhood, 88(9), 748–752.
Robinson, O., Martínez, D., Aurrekoetxea, J. J., Estarlich,
M., Somoano, A. F., Íñiguez, C., Santa-Marina, L.,
Tardón, A., Torrent, M., & Sunyer, J. (2016). The
association between passive and active tobacco smoke
exposure and child weight status among Spanish
children. Obesity, 24(8), 1767–1777.
S, S. (2019). Faktor-Faktor Yang Berhubungan Dengan
Kegemukan Pada Balita di Kelurahan Warnasari
Kecamatan Citangkil Kota Cilegon. Falatehan Health
Journal, 6(1), 1–10.
Sartika, R. A. D. (2011). Prevalensi dan Determinan
Kelebihan Berat Badan dan Kegemukan pada anak
berusia 5-15 tahun. Kesmas: Jurnal Kesehatan
Masyarakat Nasional (National Public Health Journal),
5(6), 262–268.
Suryanti. (2013). Analisis Faktor Penyebab Obesitas dan
Cara Mengatasi Obesitas.
Virgianto, & Purwaningsih. (2016). Konsumsi Fast Food
Sebagai Risiko Terjadinya Obesitas Pada Anak.
WHO. (2000). Obesity: Preventing and managing the
global epidemic : report of a WHO consultation. World
Health Organization.
https://apps.who.int/iris/handle/10665/42330
WHO. (2021a). BMI for age 5-19 years.
https://www.who.int/tools/growth-reference-data-for-
5to19-years/indicators/bmi-for-age
WHO. (2021b). Obesity and overweight in the Western
Pacific. https://www.who.int/westernpacific/health-
topics/obesity
WHO. (2021c, June 9). Obesity and overweight.
https://www.who.int/news-room/fact-
sheets/detail/obesity-and-overweight
World Health Organization (WHO). (2021). Obesity and
overweight. WHO. https://www.who.int/news-
room/fact-sheets/detail/obesity-and-overweight
Epidemiology of Childhood Obesity and Their Lifestyle in Preschool Children from Medan Deli
87
