
The Factors of Innovations Implementation and Information
Technology Utilization in the Health Sector to Quality of Services at
the DKI Jakarta Provincial Health Centre during the COVID-19
Pandemic for the Year 2020-2021
Manda Hafni Permana, Syahrizal
Faculty of Public Health, University of Indonesia, Margonda Street, Depok, Jawa Barat, Indonesia
Keywords: Innovation in Pandemic, Quality of Health Service, Outbreak of DKI Jakarta Province
Abstract: Health is a complex field with highly dynamic environmental conditions, where quality improvement needs
to be done continuously. Thus, the application of renewal or innovation in health organizations is needed
supported by technology and information in its application. Along the development of the situation and
conditions of the pandemic, the Emergency Response Status for the COVID-19 Outbreak of the DKI Jakarta
Province in 2020 requires innovation in improving the quality of public services and the performance
achievements of each health care. This type of research is mix method, with the independent variables include
leadership, innovation culture, resource training, communication channels, networks and partnerships,
reward, complexity and relative advantage, perceived usefulness, and perceive ease of use, as well as the
dependent variable consisting of quality aspect with a structure, process, and output approach. The research
was conducted in Community Health Center Mei-June 2021. The research locations in 5 Regencies in DKI
Jakarta Province. There was a relationship between innovation implementation factors and the use of
information technology (leadership, innovation culture, reward, network and partnership) on the quality of
services during the COVID-19 pandemic at the DKI Jakarta Provincial Health Center for the 2020-2021
Period.
1 INTRODUCTION
Health services have a significant impact on an
individual's quality of life and well-being, both
individually and in groups (Ostrom et al. 2015).
Every day, the health sector must confront new hopes
and challenges as calls for modernization and
reorganization, but this has not been matched by the
sector’s ability to adapt quickly to change (Dias
2018). Health is a complicated sector with highly
dynamic environmental conditions, necessitating
continuous quality improvement. Thus, the
application of renewal or innovation in health
organizations is critical and must be supported by
technology and information (IT) in order to realize
public services with good governance that ensures
transparency, accountability, and efficiency, and
impactiveness in administering government.
Meanwhile, innovation is defined in Permenpan-RB
No. 3 of 2018 as “creative ideas or notion and/or
adaptations/modifications that can benefit the
community both directly and indirectly, particularly
in public services.”
While most health care organizations claim to
engage in Quality Improvement (QI) activities, just a
handful consistently and sustainably improve the
quality of health care (Strome 2013). Frequently, the
service quality In general, innovation as an
assessment of service innovation and quality
management is less concerned, both in theory and
practice (Mu, Bossink, and Vinig 2019).
Additionally, the failure rate for implementing
complex innovations is fairly high, ranging between
30% and 90%, depending on the scale of the change
organization, the definition of failure, and the
assessment criteria. Healthcare innovations
frequently fail in part due to inimpactive
implementation, which might result from significant
uncertainty, risk, and the clinical discretion required
(Jacobs et al. 2015).
156
Permana, M. and Syahrizal, .
The Factors of Innovations Implementation and Information Technology Utilization in the Health Sector to Quality of Services at the DKI Jakarta Provincial Health Centre during the COVID-19
Pandemic for the Year 2020-2021.
DOI: 10.5220/0010758000003235
In Proceedings of the 3rd International Conference on Social Determinants of Health (ICSDH 2021), pages 156-169
ISBN: 978-989-758-542-5
Copyright
c
2022 by SCITEPRESS – Science and Technology Publications, Lda. All rights reserved

1.1 Background
According to the 2020 Global Innovation Index (GII)
report, Indonesia was ranked 85th out of 113
countries, a position that appeared to have remained
stagnant from the previous year and was still lower
than other ASEAN countries such as the Philippines,
Thailand, Malaysia, and Singapore. At the national
level, the Government has enacted Government
Regulation No. 38 of 2017, which includes indicators
of regional innovation indexes with assessment
criteria based on renewal, benefits, public interest,
local government affairs and authorities, replication,
and application. The indicators are divided into
aspects of local government units and innovation
units and include seven variables, including. The
instrument is composed of 35 indicators for assessing
the regional innovation index.
The government has implemented a regional
innovation policy to accelerate the achievement of
community welfare through reforms and the
implementation of Regional Government, as stated in
Government Regulation No. 18 of 2017. This policy
was also revealed in the DKI Jakarta Provincial
Health Office’s Strategic Plan for 2017-2022 through
a decree jointly to become a quality organization in
the implementation of health efforts as a regulator in
the implementation of sustainable quality
management and in accordance with applicable
regulations, using the jargon “One Agency One
Innovation” with a target of 95%. In 2020, the
percentage of SKPD/UKPD in health affairs will have
innovation in the health sector. Concerning various
other efforts to enhance the quality of health services,
including fostering and assisting in the accreditation,
maintenance, and development of the ISO quality
management system, community satisfaction surveys
of internal and external customers, and various
sustainable quality cultures.
The Provincial Government of DKI Jakarta
frequently conducts activities related to innovation in
the health sector for its institutions, which include 6
Health Sub-Departments, 44 District Health Centers,
32 RSUD/RSKD, and four Technical Implementing
Units. These activities include: Quality Control
Group, Contributing Suggestions, Quality Control
Projects, and various other health service activities.
The following table summarizes health innovation
data from 2017-2019 by agency type:
Table 1: Innovation in the Health Sector of DKI Jakarta
Province in 2017-2019
N
o. Region Agency
Number of
Innovations
2017 2018 2019
1Central
Jakarta
Health Centre 15 13 13
Hospital 2 1 3
AGD 1 - 2
PPKP 1 1 1
Labkesda/
Training Centre
- 1 -
2 North
Jakarta
Health Centre 7 7 7
Hos
p
ital 1 1 2
3 West
Jakarta
Health Centre 28 32 29
Hos
p
ital 5 3 3
4 South
Jakarta
Health Centre 14 14 15
Hospital 3 4 4
5East
Jakarta
Health Centre 15 21 20
Hos
p
ital 1 - 3
Puslatkesda/
Training Centre
1 - -
6 Thousan
d Islands
Health Centre - - 2
Hos
p
ital 1 1 1
Total 95 99 105
Source: DKI Jakarta Provincial Health Office 2019
According to the data above, the Jakarta Health
Office Strategic Plan target of increasing productivity
and innovation in the health sector has been achieved,
as well as an increase in innovation produced or
developed from previous innovations each year, even
though the health sector is still dominated by agencies
originating from health centre as Health Facilities
First Level (FKTP). There are several strategic health
challenges in DKI Jakarta Province, one of which is
Triple Burden Disease, in which Communicable
Diseases (CD) remain high, but Non-Communicable
Diseases (NCD) are increasing, besides Emerging
Infectious Diseases (EID) / Re-Emerging and / or
New Emerging. According to the Republic of the
Indonesia Ministry of Health, PIE got special
attention due to its serious impact on health and socio-
economics, particularly in the current digital era and
globalization.
The WHO recommends a population density of
9,600 km2, whereas DKI Jakarta has reached 17,000
km2. This circumstance undoubtedly has a significant
impact on changes in public health conditions, making
environmental conditions a difficulty (DKI Jakarta
Health Office, 2019). Along with the evolution of the
pandemic’s situation and conditions, establishing the
Emergency Response Status for the COVID-19
Outbreak in the DKI Jakarta Province in 2020 will
require innovation to improve the quality of public
services and increasing each SKPD/UKPD’s
achievements. This is also supported by the Governor
The Factors of Innovations Implementation and Information Technology Utilization in the Health Sector to Quality of Services at the DKI
Jakarta Provincial Health Centre during the COVID-19 Pandemic for the Year 2020-2021
157

of DKI Jakarta Province’s Instruction No. 16 of 2020
on enhancing awareness of the risk of COVID-19
virus transmission and the DKI Jakarta Provincial
Health Office’s Circular Letter No. 93 of 2020. The
DKI Jakarta Provincial Government is attempting to
improve service quality through innovations used by
hospitals and health centers during the COVID-19
pandemic.
Activities aimed at improving the quality of health
services can be implemented through the certification
system or the ISO, through mentoring and supporting
quality management reviews, and by developing
innovations. Additionally, each UKPD/UPT is urged
to develop innovations that expedite the handling of
COVID-19. According to the results of the DKI
Jakarta Provincial Health Office’s innovation
recording and reporting system, namely the 2020
Ring-Innovation, there were 48 innovations
originating from Health Centre and hospitals, most
which were information technology-based and
covered a variety of program categories, including
SPM, PIS-PK, RENSTRA, Surveillance,
Acceleration of COVID-19 Handling, etc. While DKI
Jakarta Province has achieved various awards, one of
which is being awarded the Most Innovative Province
in 2020, advancements in the health sector are
represented by only 2% of the Top 99 Public Service
Innovations. Because some recommendations and
analyses of previous studies’ limitations, as well as
proposals to expand research with different sample
sizes, enable researchers to compare research
characteristics and locations, it is critical for
researchers to conduct additional analysis on how
innovation implementation can be managed
successfully through factor relationship analysis
implementation of innovation and utilization of
information technology in the health sector on the
quality of services during the COVID-19 pandemic at
the DKI Jakarta Provincial Health Center for the
2020-2021 Period.
2 LITERATURE REVIEW
2.1 Innovation
Joseph Schumpeter in 1934, one of the researchers in
the theory of innovation defining the term innovation
in five ways different is the new product, new methods
of production, new sources of supply, and the way of
how to set business and exploitation the new market
(Lundvall 2016). At the level of organization,
innovation is defined as the adoption of a product,
service, process, technology, new policy, structures or
system administration (Damanpour and Schneider
2006). While it is, The Manual of Oslo in 2018 to
distinguish between innovation as result (innovation)
and activities that make innovation appears (activity
of innovation), where innovation is defined as
something that is new or improvement of products or
processes (or combination) which differ in significant
of unit product or process previously and which has
been available to used by the unit.
Innovation system that is innovation in an
integrated system that includes the renewal of ways in
interacting with the other or can be called also by
changes or updates in order to manage administration
(changes in governance). There are several things that
are needed to be able to generate good acceptance in
the community so that later the innovations that have
been implemented can be successful. The theory
namely Diffusion Innovation that was popularized by
Everett M. Rogers in the year 1964. Some authors
restrict the term " diffusion " be spontaneous, namely
the spread of ideas just are not planned and use the
concept of " dissemination " for diffusion are directed
and managed. There are four main elements in
diffusion: innovation, communication channel, time,
and social system.
Figure 1: Innovation Diffusion Process
There are several factors that contribute to the
implementation of innovation, especially in the health
sector. The result of identification obtained the
findings of the latest of the results of research Leue &
Marxicoff (2017) classifying the concept that became
the three levels of analysis, namely: the level of
organization, the level of the individual, and the level
of innovation. Where the organizational level consists
of organizational structure, organizational culture,
and communication. Then at the level of individuals
associated with the characteristics of the individuals
who are involved in innovation, covering the
championship, leadership and management. While at
the level of innovation describes the characteristics
and aspects that are relevant to the process of
ICSDH 2021 - International Conference on Social Determinants of Health
158
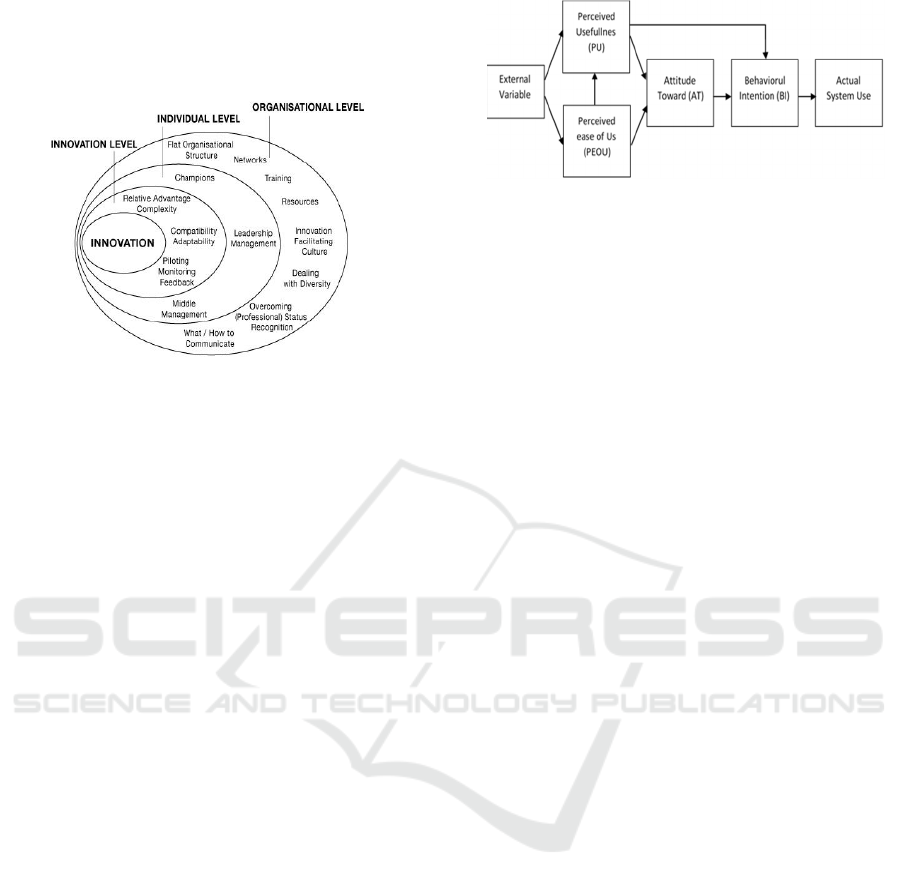
innovation that it self (Leue, 2017). The description
of the level of factor analysis that facilitates
innovation in health services is as follows:
Figure 2: Framework of Factor Facilitating Innovation of
Health Services
2.2 Technology Utilization
In the collection of data and Information Health
implemented through activities with the use of
technology and sources of other appropriate
development of science knowledge and technology
that can be accounted for. The theory that relate is
Technology Acceptance Model (TAM) that found by
Davis in the year 1986 to explain the potential
intention of behavior for using innovative technology.
TAM was developed from the Theory of Reasoned
Action (TRA) of Martin Fishbein and Icek Ajzen
(1975), although it is less general because it applies
specifically to explaining computer usage behaviour.
Davis et al stated that the aim of TAM is to provide
an explanation of the determinants of technology
acceptance in various contexts and be able to explain
behaviour users and populations of computing
technology. The model that is based on the premise
that the use of ICT someone is determined by two
variables principal, namely usability are perceived
(Perceived usefullness / PU) which is the probability
of subjective prospective users that use ICT particular
will improve the achievement of work a person within
the context of the organization and ease of use are
perceived (Perceived Ease of Use (PEOU) which is
defined as the extent to which potential users expect
ease of use of technology that can be applied in their
activities.
Figure 3: Technology Acceptance Model Framework
2.3 Quality
In point of view the patients, health care are
considered and expressed in question such as, “Which
is the hospital or provider will give the best health
care?” Because the patient wants to receive the
affordable and high quality services. Services are
qualified into aspects of the most important for the
institution of health. Many institutions or
organizations of health care risking the reputation of
the quality of service for the life of the patient who
dependent to them. Hospital, clinics, and other
providers who are considered high qualified to attract
patients, managed to attract the staff 's best (including
professional clinical and research), as well as get
more profit registered for the investment process
improvement for having a reputation that beyond the
ordinary. So, most of people have determined
themselves to desired the attributes and criteria in
identifying the quality of their favorite products and
brands (Strome 2013).
According to the Institute of Medicine, the quality
is how long the service of health for individuals and
populations can increase the degree of health the
people who correspond with the science knowledge
by the health professional. The definition is expected
to have more benefits for the community, where the
measurement of quality must reflect the satisfaction
of patients, health status, measure the quality of life
and / interaction and the process of decision making
between patients or providers of health services.
Product quality can be characterized by several
components which include efficacy, effectiveness,
optimality, acceptability, legitimacy and equity. This
components can be used by itself or through a
combination of the definitions of quality which when
measured in a way will indicate the amount of the size
(Donabedian 2003). The explanation and description
of the quality components are as follows:
Assessment of service indicators can use a
performance measure approach in the list of steps to
be taken. In other words, we need to have a way to
determine whether the quality of care has been " good
", " medium ", or " bad ". More than last of 40 years,
The Factors of Innovations Implementation and Information Technology Utilization in the Health Sector to Quality of Services at the DKI
Jakarta Provincial Health Centre during the COVID-19 Pandemic for the Year 2020-2021
159
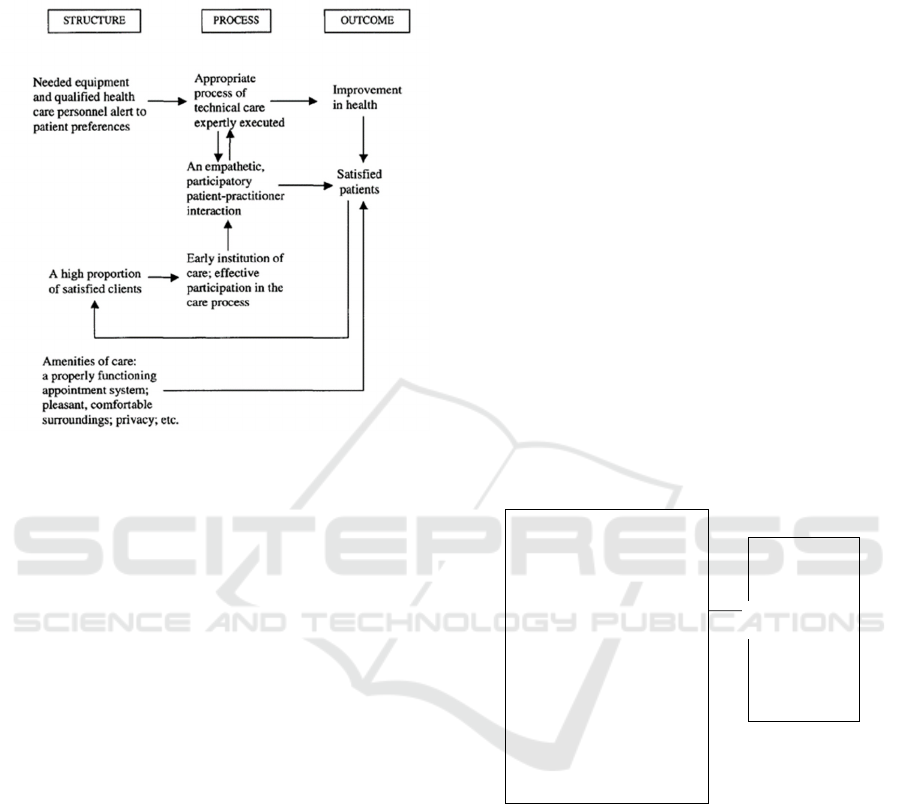
has suggested three approaches to improving the
quality of service by Avedis Donabedian who are
called " structure ", "process" and " results ".
Figure 4: Characteristic of Quality Measurement Approach
As some of the literature indicates several factors
influence on the results of the performance of services
services health , including that : Factors that Affect
effectiveness of Innovation Results by the research of
Jacobs (2015) showed that not only the perception of
implementation which have the effect of significantly
towards the effectiveness of innovation, but the
perception of physicians is also related to the
implementation of policies the organization, such as
the status of job, age, specialist, structural
organization of an impact on the effectiveness of the
implementation of the innovation services of Health.
Leaders look at the ways to improve the effectiveness
of the implementation of an innovation with a focus
on creating environments that support the physician
to generate the perception that positive in its
application, such as expectations specifically,
support, and appreciation. Factors that affect
performance innovative by the results of the study
Lundvall (2016) states that the high performance and
design organizations to identify the type of
organization that differ in placing a relationship
between the way companies organize work and
capacity innovative. In identifying the type of
organization of work specifically, we used the data
survey of the conditions of work in building 15
variables that include responsibilities responsibilities
and duties of work and then use the analysis cluster to
identify four types of primary organization of work.
15 variables consisted of four variables first to
measure the use of the core practices of work -related
literature of performance are high, namely: team
work, job rotation, responsibilities of employees,
control and norms of quality. Two in whom variable
captures whether the employees are involved in
learning and solving problems, characteristics
adhocracy or type of bureaucracy as well as ascertain
whether the assignment of work was complex or not,
and relevant to the operation of adhocracy.
3 CONCEPTUAL FRAMEWORK
In this study, it will be discussed in depth about the
implementation of health service innovations seen
through the characteristics and several factors that
contribute or facilitate including aspects of
technology acceptance which are considered
important by researchers to be analyzed further in
relation to service quality, especially at the
Puskesmas level during the COVID-19 pandemic for
the year 2020-2021. The conceptual framework is as
follows:
Figure 5: Conceptual Framework of The Research
4 METHOD
The purpose of this form of research is to employ both
quantitative and qualitative methods concurrently in
order to acquire more comprehensive data. The
design of this research is a sequential explanatory
type combination, which is a design that begins with
the collection and analysis of quantitative data and
continues with the collection and analysis of
qualitative data, in order to interpret how qualitative
data explains quantitative results (Creswell 2013).
The research design phase begins with data collection
IndependentVariable DependentVariable
RELATEDFACTORS:
InnovationImplementation
Leadership
InnovationCulture
ResourceTraining
CommunicationChannel
NetworkandPartnership
Apreciation/Reward
ComplexityandRelativeAdvantage
UtilizationofInformationTechnology
PerceivedUsefullness
PerceivedEaseofUse
QUALITYOF
HEALTHSERVICES
INCOVID‐19
PANDEMICERA
Pendekatan
- Structure
- Process
- Output
A
pp
roach
ICSDH 2021 - International Conference on Social Determinants of Health
160

from respondents who have been determined to
provide quantitative data, followed by qualitative data
collection from selected informants. The
questionnaire have 48 questions with likert scale 1-4
start from strongly disagree until strongly agree for
the quantitative and for the qualitative data use semi-
structure interview guidelines.
On May-June 2021, the research was conducted in
Health Centre under the auspices of the DKI Jakarta
Provincial Health Office. The research was conducted
in Sub-district Health Centres throughout 5
Regencies/Cities in DKI Jakarta Province, as well as
in the head office of DKI Jakarta Provincial Health
Office. This study used a technique known as Cluster
Sampling, which is a sort of probability sampling in
which a sample is selected based on a predetermined
population area. In this study, a One Stage Cluster
was used to determine sample sizes, with the first
stage identifying samples as a result, samples will be
collected from staff representatives or employees at
Health Centre. Each Health Centre may include up to
three innovation teams (see attached calculation), as
well as facilitators, coaches, chairpersons, and or
implementing members. In-depth interviews with
informants were conducted using a purposive
sampling technique, in which informants were chosen
based on special considerations, namely those who
were involved or had in-depth knowledge of the
research problems and whose opinions were believed
to adequately describe the problem of health
innovation on service quality at the DKI Jakarta
Provincial Health Center, namely the Head of
(Quality of the Jakarta Health Sub-dept., Head of
Public Health Center, Community) by virtual meeting
app. The sample size calculation for implementing
health innovations at the DKI Jakarta Health Center
is 78 people.
The analysis was conducted following the
collection of all research data in this study. Among
the activities associated with data analysis are
classifying data according to variables and
respondent types, tabulating data according to
variables from all respondents, presenting data from
each variable studied, performing calculations to
resolve the problem formulation, and performing
calculations to test hypotheses that have been
proposed. The data analysis results will be used as a
basis for interpreting the research findings in order to
ascertain the meaning of the collected data.
Univariate analysis is used to gain an overview of the
features of each variable, with the goal of simplifying
or summarizing the collected data in order to make it
useful. After determining the properties of each
variable, further analysis can be conducted. Chi
Square is used to assess the relationship between
variables by comparing the percentage difference
between two or more sample groups. Then, using
logistic regression analysis, proceed to multivariable
analysis, which is a complex analysis that is an
extension or development of a simple analysis. It tries
to visualize the relationship between many
independent factors and the dependent variable
concurrently. And then a qualitative analysis was
conducted to compare the field findings to the
literature used as a reference for author.
5 RESULTS
5.1 Validity and Reliability Test
Thirty respondents were used to conduct a validity
test. Invalid questions will be excluded from the
study’s data processing. Correlation analysis was
used to determine the questionnaire instrument’s
validity by comparing the scores for each variable to
the total score. The Pearson Product-Moment
correlation is used, and the test is valid if the value of
r count > r table. The r table value is 0.3610 based on
the respondent’s test sample. The validity test
revealed that all questions were valid, specifically 48
with a Cronbach Alfa value ≥0.6, which was 0.975,
indicating that the questions are also reliable, as
demonstrated in the appendix. Additionally,
qualitative data are validated by triangulating data
and sources.
5.2 Respondents Characteristics
This analysis summarizes the characteristics of
research respondents, specifically employees who
implement innovation at the DKI Jakarta Provincial
Health Center. Based on the results of the study, it
was found that of the 78 respondents, most of them
were 20-30 years old and 31-40 years old with a
percentage of 44.9% each and the majority worked as
doctors (61.5%) with the highest employment status
category being BLUD employees or honorary health
center (57.7%). The positions of the respondents at
the health center were mostly as implementers
(46.2%), the largest length of work was starting from
3-5 years (35.9%). Furthermore, the involvement of
the most respondents in the team was as a member
(39.7%) and the region where most respondents came
from was North Jakarta (28.2%).
The Factors of Innovations Implementation and Information Technology Utilization in the Health Sector to Quality of Services at the DKI
Jakarta Provincial Health Centre during the COVID-19 Pandemic for the Year 2020-2021
161

5.3 Innovation Characteristics
According to the study’s findings, most innovation
occurred as health products/services (53.8%), with
most programs chosen to develop, namely from basic
service standards (53.8%). Most innovation teams
inside an agency comprise of four to seven employees
(82.1%), with most funds receiving from BLUD
Health Centre funds (80.8%). The most gathering
time for the innovation team is 1x/week (32.1%) with
the most widely used approach to innovation, namely
PDCA (Plan, Do, Check, Action) (96.2%).
Additionally, the most common level of innovation is
associated with fundamental changes in public
services in new ways (48.7%), with most ideas
emerging from surveys or phenomena in the field
(56.4%). Most innovations generated by respondents
have been tested (76.9%), and the majority of
innovations have taken the form of pilot projects in a
single location or region.
5.4 Quality of Health Services
This study will describe each aspect from quality of
health services variable by the respondent’s
percspective. This variable have 15 questions with the
cut off categories is <(mean-1SD) = 3,17 (Widhiarso,
2010). Majority respondent stated strongly agree with
the sustainability of the quality of health services
question is about 65%. Then, the data distribution of
the variable (structure, process, and output) by the
categories are:
Table 2: Distribution frequencies of Quality of Health
Services Variables
The result of the quality of health services was
quite good is about 71,8%.
5.5 Bivariate Analysis
This analysis was conducted to see the relationship
between the factors that influence implementation of
innovation and utilization of health technology on
service quality during the COVID-19 pandemic by
using the Chi Square test. The result is as follows:
Table 3: Bivariate Analysis of Factors Affecting Innovation
Implementation and Utilization of Health Technology in
Quality of Services During the COVID-19 Pandemic
Variable
Quality of service
Total
P
Value
Not Good Good
N % N % N %
Leadership
Not
Goo
d
11 64.7 6 35.3 17 100 0.00
1
Good 11 18 50 82 61 100
Innovation Culture
Not
Goo
d
16 69.6 7 30.4 23 100 0.001
Good 6 10.9 49 89.1 55 100
Resource Training
Not
Goo
d
6 66.7 3 33.3 9 100 0.013
Good 16 23.2 53 76.8 69 100
Communication Channel
Not
Goo
d
1 100 0 0 1 100 0.282
Good 21 27.3 56 72.7 77 100
Appreciation/ Reward
Not
Goo
d
8 66.7 4 33.3 12 100 0.003
Good 14 21.2 52 78.8 66 100
Complexity and Relative Advantage
Not
Goo
d
13 68.4 6 31.6 19 100 0.001
Good 9 15.3 50 84.7 59 100
Perceived Usefullness
Not
Goo
d
13 72.2 5 27.8 18 100 0.001
Good 9 15 51 85 60 100
Perceived ease of Use
Not
Goo
d
2 66.7 1 33.3 3 100 0.190
Good 20 26.7 55 73.3 75 100
The following table shows the results, which have a
p-value <0.05, indicating that Ha is accepted and Ho
is rejected, showing that there is a significant
relationship between the independent variables
(leadership, innovation culture, resource training,
network-partnerships, complexity and relative
advantage, perceived of usefullness) on the dependent
variable, namely the quality of health services.
Quality of Health
Services
Total
Presentati
on (%)
Good 56 71.8
Not Good 22 28.2
Total 78 100
ICSDH 2021 - International Conference on Social Determinants of Health
162

5.6 Multivariate Analysis
This study is used to determine the relationship
between different variables concurrently using
logistic regression in order to select the most relevant
relationship. The following table is the findings.
Table 4: The Results of Bivariate Selection in Independent
Variable to Dependent Variable
No Variabel
P
Value
OR
1 Leadership 0.001 Continue to
multivariate
2 Innovation
Culture
0.001 Continue to
multivariate
3 Resource
Training
0.010 Continue to
multivariate
4 Communication
Channel
0.109 Continue
t
multivariate
5 Network and
Partnership
0.001 Continue to
multivariate
6 Appreciation/
Reward
0.002 Continue to
multivariate
7 Complexity and
Relative
Advanta
g
e
0.001 Continue to
multivariate
8 Perceived
Usefullness
0.001 Continue to
multivariate
9 Perceived ease
of Use
0.158 Continue to
multivariate
Then, all variables with p value >0,25 can entered
to the logistic regression model. The following table
is the findings.
Table 5: Logistic Regression 1
st
Model
No Variabel B P Value OR
1 Leadership 0.886 0.441 2.425
2 Innovation Culture 2.117 0.060 8.304
3 Resource Training -0.827 0.579 0.438
4 Communication
Channel
17.178 1.000 288733
52.819
5 Network and
Partnershi
p
3.784 0.004 43.978
6 Appreciation/
Rewar
d
-0.564 0.690 0.569
7 Complexity and
Relative Advantage
-0.110 0.932 0.896
8 Perceived
Usefullness
0.477 0.734 1.612
9 Perceived ease of
Use
1.525 0.516 4.593
Based on the result of multivariate first model
analysis, it can be seen that there are 8 variables
whose p value<0,05, namely leadership, innovation
culture, resource training, communication channels,
appreciation/ reward, complexity and relative
advantages, perceived usefullnes and perceived ease
of use. As for whose p value is the largest, namely
communication channel, then the variable is removed
from the model. After the 9 times modelling by using
the OR Comparison, the variable elimination has
been completed. Finally, the last result model is as
follows:
Table 6: Final Logistic Regression Modeling
No Variabel B
P
Value
OR
1 Leadership 0.899 0.433 2.457
2 Innovation
Culture
2.092 0.050 8.100
3 Resource
Training
-0.765 0.587 0.466
4 Network and
Partnership
3.789 0.004 44.203
5 Reward -0.602 0.655 0.548
6 Perceived
Usefullness
0.410 0.724 1.507
7 Perceived Ease
of Use
1.542 0.469 4.676
Then, the elimination process has finish but there
was suspicioused about the interaction between the
variables each others. So, we do the interaction test.
The following are the findings:
Table 7: Logistic Regression Modeling with Interaction
Test
No Variabel B
P
Value
OR
1 Leadership -3.055 0.194 0.047
2 Innovation
Culture
2.259 0.045 9.573
3 Resource
Training
-.443 0.736 0.642
4 Network and
Partnership
4.022 0.004 55.831
5 Reward -3.383 0.077 0.034
6 Perceived
Usefullness
.449 0.711 1.567
7 Perceived Ease
of Use
1.466 0.566 4.330
8 Leadership by
Rewar
d
5.088 0.048 162.021
The Factors of Innovations Implementation and Information Technology Utilization in the Health Sector to Quality of Services at the DKI
Jakarta Provincial Health Centre during the COVID-19 Pandemic for the Year 2020-2021
163

Multivariate study reveals that the variables that
are substantially associated with health service
quality are leadership, innovation culture, network
and partnership, and appreciation/reward. The most
significant factor affecting the quality of health
service is the leadership. While the controlling
variables are training resources, perceived usefulness,
and perceived ease of use. In this analysis, leadership
interacted with reward, it means the leadership
influence in implementation of innovation to quality
of health services depend on the reward that given,
the OR value for the variables must be count by the
followings:
In the reward varible reward with “not good”
categories (code=0). The formulation for counting the
OR value is:
=
e^-3,055+5,088(0)
= e^-3,055
= 0,05
Then, in the reward varible reward with “good”
categories (code=1). The formulation for counting the
OR value is:
= e^-3,055+5,088(1)
= e^2,033
= 7,64
The study revealed that someone who received a
good appreciation or reward, and good leadership in
their institution had the odds/ opportunity of
delivering a good quality of health services 7,64 times
higher than than those who did not receive a good
appreciation/ reward and leadership after controlling
for the resource training, perceived usefulness, and
perceived ease of use variable. While for someoun
who did not receive a good appreciation/ reward and
but get a good leadership had the odds/ opportunity of
delivering a good quality of health services 0,05 times
higher than than those who did not receive a good
appreciation/ reward and leadership.
Similarly, it can be interpreted in terms of
additional variables that had p value <0,05. The most
dominant variable is related with the quality of health
care is good appreciation/ reward and leadership.
6 DISCUSSION
6.1 Leadership
Statistical tests revealed a relationship between
leadership and health service quality, indicating that
the better the leadership, the higher the quality of
health services. The findings of this study corroborate
previous research conducted by Asyara et al. (2019)
on the impact of knowledge management and service
leadership on the service quality of employees at the
Air Putih Health Center in Samarinda, which
demonstrated that the service leadership variable had
a positive and significant impact on service quality.
Additionally, Melati (2014) reported a significant
relationship between leadership and organizational
performance outcomes at Fatmawati Hospital.
The variables of impactive leadership include
vision, mission, values, and support for innovation.
This is consistent with Muluk’s (2008) statement
about the importance of developing legally binding
innovation policies through political strengthening
and efforts to fulfill the mandate, as well as the vision
and mission of the innovation system. However,
there are still several areas where improvements can
be made, most notably in the management,
supervision, and facilitation of innovation efforts.
According to Kotter (2001), leadership is defined by
motivating, directing, inspiring, and aligning people,
such that leader behavior plays a significant role in
the implementation of innovation due to its
administrative power and visibility inside the
organization. Additionally, Leue (2017) revealed that
developing people’s ambition and drive, as well as
managing teams, are all part of the leadership
responsibility. Thus, it can be concluded that if the
leader is inimpactive at managing, supervising, and
facilitating innovation efforts, this will eventually
result in a decrease in the quality of service or
innovation itself.
Leadership in innovation, especially in the
government sector, is very important in supporting
the innovation process. In Permenkes RI No. 43 of
2019 it was stated that leaders at Health Centre
generally have a term of office of at least 2 (two)
years to lead, mobilize, as well as change their
institutions. resources in implementing innovation.
This is in line with Kaplan’s 2015 research which
states that at the organizational level, management
leadership directly influences the quality
improvement culture and guides resources and
investments for the improvement of a particular
project. Thus, all the efforts made by the leadership
in implementing innovation will certainly impact the
results of the quality of the service.
6.2 Innovation Culture
The study revealed a relationship between innovation
culture and service quality. This supported with
Kaplan’s (2015), which found that a culture that
ICSDH 2021 - International Conference on Social Determinants of Health
164

promotes quality improvement through values,
beliefs, and norms at both the organizational and
microsystem levels have a significant impact at all
levels of the system. However, the findings of this
study are not in line with Anggrawati and Saputra’s
(2018), which concluded that service culture does not
impact on service innovation and has no significant
impact on organizational performance. This could be
because of the innovation culture in DKI Jakarta
institution, every year there was a competition or
forum for improve the quality of health services, such
as quality convention activities or exemplary health
service. Whereas Muluk (2008) asserts that the
capacity for innovation can emerge naturally if it is
accompanied by the development of the
organization’s culture, which can be accomplished
through education, training, and a variety of other
development activities.
6.3 Resource Training
The results of the bivariate analysis stated that there
is relationship between resource training and service
quality. But, in multivariate analysis just as a
controlling variable. This is not under Manurung’s
(2017) research seen from Malcomm Baldridge’s
criteria which states that there is a significant
relationship between the dimensions of focus on
human resources and organizational performance
results that can be used as a key process to achieve
performance excellence. This can be caused by the
lack of optimal resource training because in the
pandemic situation and conditions there are many
changes in the learning process and other habitual
adaptations that can potentially hamper training
activities, moreover from the interview results it is
known that a lot of budget is diverted for handling the
pandemic, so that activities the calling of resource
persons or training from outside has not been carried
out properly. In addition, the frequency distribution
shows quite excellent results in resource training,
especially for questions related to learning activities
and increasing insight, as well as opportunities to
increase self-capacity. However, poor results were
obtained on the questions of career planning and
development, as well as the training and coaching of
special innovation teams. This shows that the
resource training activities have been going well,
although they have no significant impact. This can be
because there are still limited resources based on job
analysis and workloads that are not under the number
of activities or the Health Centre program.
6.4 Communication Channel
Although the bivariate analysis revealed a relationship
between the communication channel and service
quality, the multivariate analysis revealed that the
communication channel was not the related factors to
quality of health services. It is not in line with
Sihabudin’s (2018), which found a significant
association between the type of communication
channel used and the success of innovation
acceptance. The study’s findings indicated that the
communication channel for Health Centre innovation
was favorable, particularly in terms of the availability
of communication services and access to information
and communication media, as well as the affordability
of online media as a communication channel.
However, communication, information, integration,
and socializing related to these developments are still
lacking in the community. The Health Centre provides
innovation communication channels such as print
media, e-flyers, online and offline meetings, and
WhatsApp, among others. This verifies Cao et al
(2011) assertion that impactive implementation of any
new technology can demonstrate its use of innovation,
implying that more impactive and individualized
communication tactics can be developed and deployed
to raise patient awareness of a new service such as e-
health. Thus, when arranging communication
channels, it is vital to consider a variety of factors that
may influence innovation adoption, including their
socioeconomic status.
6.5 Network and Partnership
Analysis revealed that networks and partnerships had
relationship with service quality. This was in lie with
Merkel’s (2018), according to which networks,
individuals, and groups are the primary drivers of
social innovation in the health industry. According to
the study’s findings, the Health Centre innovation
network and partnership were successful. Integration,
collaboration, and cooperation entail a variety of
internal and external parties, as well as the role of
local communities in implementing innovation in
their regions. This is demonstrated by the
community’s need to support various public health
programs in their area, as demonstrated by
community leaders, religious leaders, and local
cadres. Additionally, both public and private
organizations contribute to the Health Centre’s
innovation implementation. Thus, in the future,
health workers must maintain and strengthen
networks and broader partnerships, as well as the way
by which these networks and partnerships are
The Factors of Innovations Implementation and Information Technology Utilization in the Health Sector to Quality of Services at the DKI
Jakarta Provincial Health Centre during the COVID-19 Pandemic for the Year 2020-2021
165

developed, in order to maximize support for
optimally improving the quality of health services.
6.6 Appreciation/ Reward
Statistical tests showed a correlation between awards
and the quality of health services, indicating that the
more prestigious the appreciation, the better the
quality of health services. The findings of this study
confirm Jacobs et,.al (2015) on the impactiveness of
innovation implementation in the health sector, which
concluded that perceptions of the implementation
climate have a direct positive impact on
implementation. The most important predictor is
perceptions of organizational recognition and rewards
via gifts, incentives, or other forms of appreciation.
This is also consistent with the findings of Kristianto
et al. (2018), who found that awards influence
managerial performance at the Tawangrejo Health
Center.
According to the frequency distribution, most
respondents believed that the awards for innovation at
the Health Centre were still insufficient, particularly
in terms of prizes and incentives. However, the
appreciation or award granted is sufficient. This is due
to a variety of variables, including the situation and
conditions during the pandemic, funding transfers, and
policies that prohibit the provision of appreciation or
special incentives for the adoption of innovations,
except for specific national-level events. According to
Notoadmodjo (2009), everyone, regardless of their
status or position, requires appreciation. Therefore,
leaders or agencies must recognize health workers,
particularly innovation activists, in any manner,
whether it is through simple appreciation or through
attention and other forms of support in carrying out
health efforts.
6.7 Complexity and Relative
Advantage
The analysis showed there is no relationship between
complexity and relative advantage to service quality.
This contradicts Adnan’s (2019) research, which
found that innovation contributes positively to
community satisfaction in terms of innovation
attributes, including complexity and relative
advantage. It means that in the future an organisaton
must be have a new way of strategy in order to build
a good innovation with good complexity and more
benefit for people.
6.8 Perceived Usefullness
The results of statistical tests found that there was no
relationship between perceived usefulness and
quality of health services, but just as a controlling
variable. The results of this study is not in line with
Dinata et al’s (2020) on evaluating online registration
with the Technology Acceptance Model at
Wongsonegoro Hospital Semarang which states that
aspects of perceived usefulness or usefulness are
considered to have considerable benefits in increasing
productivity, making work more impactive and faster,
as well as aspects of user behaviour interest tend to be
satisfied using the online registration system.
Technology Acceptance Model (TAM) is a
general guide that has been approved by experts. The
theory states that perceived usefulness is one of the
important factors that influence a person to accept a
technology. As for what is meant by purpose
perception, namely the measure by which an
individual believes that using a particular technology
can cause an increase in their performance (Davis,
1989). Therefore, when implementing innovation,
particularly when implementing a new service, it is
necessary to consider the aspect of user trust so that
they are assured that the technology or innovation
they use is confidential, including the views or
opinions of individuals or groups who also use the
innovation first in the environment, which can affect
the perception.
6.9 Perceived Ease of Use
The results stated that there was no significant
relationship between the ease of use of innovation and
service quality. This is in line with Tasmil (2014)
which states that perceived ease of use has a positive
relationship with the behaviour of using e-Health
Centre applications, but the impact is not significant.
The findings contradict the author’s hypothesis,
which is that there is a significant relationship. It is
important for organization in making an innovation
based on technology in an easy way a feature for
people use.
6.10 Quality of Health Services
The Health Centre’ role as the area’s point person
during the COVID-19 pandemic, including
epidemiological investigations, case management
and monitoring, specimen collection, cross-sectoral
coordination, in-building treatment, healthy visits,
and death surveillance, as well as referrals for SMEs
and UKP (DKI Jakarta Health Office, 2020). The
ICSDH 2021 - International Conference on Social Determinants of Health
166

measurement of the quality of health services at the
DKI Jakarta Provincial Health Center during the
COVID-19 pandemic in terms of structure, process,
and output reveals favorable results. This is consistent
with Haraharap and Utami’s (2021) research, which
found that the public’s assessment of the quality of
health care during the COVID-19 pandemic is largely
favorable, at 65%, and moderate, at 18%. This is also
supported by the Puspita and Mustakim (2020)
research on patient perceptions of health service
implementation during the pandemic, which found
that 52,3% believed technical control was
appropriate, 56,1% believed administrative control
was appropriate, and 52,3% believed personal
protective equipment was appropriate. Additionally,
there is additional supporting data from the 2020
Indonesian Political Indicators survey, which shows
that up to 55% of the community is quite content with
the COVID-19 Cluster’s performance, 8,7% is very
satisfied, and 24% is less satisfied, dissatisfied 1.9%,
and 10.4% do not know/do not respond (Wijaya,
2020). Thus, it can be concluded that there are various
examples of the quality of health services provided
during the pandemic, particularly in urban areas,
although there are still many issues to address.
According to a WHO survey of 155 countries, this
pandemic disrupted efforts to prevent and screen for
non-communicable diseases, including hypertension
in 53% of countries, cardiovascular emergencies in
31% of countries, and diabetes in 49% of countries.
This disruption has the potential to exacerbate public
health problems associated with specific medical
conditions. Additionally, low-income individuals and
those who live in areas with fewer health care
facilities may find it increasingly difficult to get
important health services. Of course, this has a direct
impact on the community’s quality of life (Nurhaliza,
2020). The scoring results indicate that the variable
with the highest value is a service quality in terms of
process, while those with the lowest value are
structure-related, particularly questions about
facilities and infrastructure, human resources,
guidelines, and information systems, and those with
the highest value in terms of output are performance
indicator questions, goals/targets, and a customer
satisfaction.
The interview findings indicate that the output of
high-quality health services influences public health,
although not significantly. Many services innovation-
related performance indicators have been met.
However, the targets or objectives established for
specific health programs have not provided optimal
results. This can be attributed to a variety of variables,
including population density in DKI Jakarta and
significant population migration (homecoming,
leaving town, urbanization), all of which contribute to
the risk of transmission. Provision and use of PPE that
are not yet impactive and efficient, limited Health
Centre buildings that necessitate special strategies for
implementing physical distancing in health services
or innovations, and a variety of other challenges that
require additional coordination and consolidation
with relevant stakeholders.
7 CONCLUSION
a. There is a relationship between the factors of
innovation and information technology used in
the health sector (leadership, innovation culture,
network and partnership, and appreciation/
reward) to the quality of services provided at the
DKI Jakarta Provincial Health Center during the
COVID-19 pandemic in 2020-2021.
b. The implementation of innovation and utilization
of information technology in the health sector on
the quality of services during the COVID-19
pandemic at the DKI Jakarta Provincial Health
Center for the 2020-2021 period has been good
in all variable.
c. The quality of health services during the COVID-
19 pandemic at the DKI Jakarta Provincial
Health Center for the 2020-2021 period is quite
good at 71,8%, especially in the process aspect.
However, it is still lacking in terms of structure
and output.
ACKNOWLEDGEMENTS
We would like to thank all of the respondent and
selected informant of this research. We would also
like to thank dr. Irma S and drg. Regina Anggia for
their help in facilitating the admission filling of e-
questionnaire and in-depth interview about the
innovation implementation and utilization of
information and technology in DKI Jakarta Provincial
Health Centre.
REFERENCES
Adnan, M. 2019. Innovation of Health Services in
Improving the Quality of Health Services at Baitussyifa
Qamarul Huda Bagu Clinic, Centra Lombok:
Sangkareang mataram Journal, 5 (3), pp.46-53.
Asyara , NR, Pongtuluran , Y. and Heksarini , A., 2020.
The..effect..of management knowledge and leadership
The Factors of Innovations Implementation and Information Technology Utilization in the Health Sector to Quality of Services at the DKI
Jakarta Provincial Health Centre during the COVID-19 Pandemic for the Year 2020-2021
167

services to the quality of service of employees..of
health..centers water white town Saarinda .
Mulawarman Journal of Management Science (JIMM),
4 (1).
Cao W, Wan Y, Tu H, Shang F, Liu D, Tan Z, et al. 2011.
A web-based appointment system to reduce waiting for
outpatients: A retrospective study. BMC Health Serv
Res ;11:318.
Creswell, John. 2013. “Steps in Conducting a Scholarly
Mixed Methods Study Abstract for DBER Group
Discussion on 2013 ‐ 11 ‐ 14.” Steps in Conducting a
Scholarly Mixed Methods Study, 1–54.
https://digitalcommons.unl.edu/cgi/viewcontent.cgi?ar
ticle=1047&context=dberspeakers.
Damanpour, Fariborz, and Marguerite Schneider. 2006.
“Phases of the Adoption of Innovation in
Organizations : Effects of Environment , Organization
and Top Managers 1” 17: 215–36.
https://doi.org/10.1111/j.1467-8551.2006.00498.x.
Davis, F.D. (1989), "Perceived usefulness, perceived ease
of use, and user acceptance of information technology,"
MIS Quarterly, Vol. 13 No. 3, pp. 319-340.
DOI:10.2307/249008
Dias, Joana A. 2018. “What Are the Key Enabling Factors
for a Sustainable Innovative Environment in
Healthcare ? By,” no. May.
DKI Jakarta Health Office. 2020. Strategy for Mobilizing
Health Centers in Coping with COVID-19. [on line].
Available at:
https://web.persi.or.id/images/2020/data/material_drwi
dyastuti_seri07.pdf [ Accessed on 3 July 2021].
Donabedian, Avedis. 2003. An Introduction to Quality
Assurance in Health Care. Edited by Rashid Bashsur.
Oxford University Press. Vol. 1. New York: Oxford
University Press.
http://dx.doi.org/10.1016/j.cirp.2016.06.001%0Ahttp:/
/dx.doi.org/10.1016/j.powtec.2016.12.055%0Ahttps://
doi.org/10.1016/j.ijfatigue.2019.02.006%0Ahttps://doi
.org/10.1016/j.matlet.2019.04.024%0Ahttps://doi.org/
10.1016/j.matlet.2019.127252%0Ahttp://dx.doi.o.
Jacobs, Sara R., Bryan J. Weiner, Bryce B. Reeve, David
A. Hofmann, Michael Christian, and Morris
Weinberger. 2015. “Determining the Predictors of
Innovation Implementation in Healthcare: A
Quantitative Analysis of Implementation
Effectiveness.” BMC Health Services Research 15 (1):
1–13. https://doi.org/10.1186/s12913-014-0657-3.
Kaplan, Heather C., Lloyd P. Provost, Craig M. Froehle,
and Peter A. Margolis. 2012. “The Model for
Understanding Success in Quality (MUSIQ): Building
a Theory of Context in Healthcare Quality
Improvement.” BMJ Quality and Safety 21 (1): 13–20.
https://doi.org/10.1136/bmjqs-2011-000010.
Krisdianto , D., Isharijadi , I. and Sulistyowati , NW, 2018,
October. Effect of Total Quality Management (TQM)
and Award Against Performance Managerial At PHC
Tawangrejo City Madiun In FIPA: Scientific Forum
for Accounting Education (Vol. 6, No. 2).
Lundvall, Bengt- Åke. 2016. The Learning Economy and
the Economics of Hope. London: Anthem Press.
Manurung, J M. 2018. Study of Implementation of Quality
with Aproach of Integration Six Sigma and TQM
Through Malcolm Baldridge Assesment in Charitas
Palembang Hospital. Thesis. Depok: Faculty of Public
Health by University of Indonesia.
Melati, Ira. 2014. Analysis of Service Quality at Version
2012 Accredited Fatmawati General Hospital Based on
Malcolm Baldridge Criteria year 2014. Thesis. Depok:
Faculty of Public Health by University of Indonesia.
Merkel, Sebastian. 2020. “Applying the Concept of Social
Innovation to Population-Based Healthcare.” European
Planning Studies 28 (5): 978–90.
https://doi.org/10.1080/09654313.2018.1552664.
Mu, Yu, Bart Bossink, and Tsvi Vinig. 2019. “Service
Innovation Quality in Healthcare: Service
Innovativeness and Organisational Renewal as Driving
Forces.” Total Quality Management and Business
Excellence 30 (11–12): 1219–34.
https://doi.org/10.1080/14783363.2017.1362954.
Muluk, Dr. Mr. Khairul. 2008. Knowledge Management:
The Key to Successful Local Government Innovation.
1st ed. Malang: Bayumedia Publishing.
Notoadmojo, S. 2009. Pengembangan Sumber Daya
Manusia. Jakarta: Rineka Cipta.
Nurhaliza, Nasya G. 2020. Availability of Health Service in
The Pandemic Era [online]. Available at:
https://cimsa.or.id/news/index/ketersediaan-pelayanan-
kesehatan-di-era-pandemi [Diakses pada 3 Juli 2021].
Ostrom, Amy L., A. Parasuraman, David E. Bowen, Lia
Patrício, and Christopher A. Voss. 2015. “Service
Research Priorities in a Rapidly Changing Context.”
Journal of Service Research 18 (2): 127–59.
https://doi.org/10.1177/1094670515576315.
Purwanto, Edi, and Vicky Budiman. 2020. “Applying the
Technology Acceptance Model to Investigate the
Intention to Use E-Health : A Conceptual Framework”
62 (05): 2569–80.
Republic of Indonesia, Ministry of Health. 2019.
Permenkes No.43 of 2019 about Puskesmas. Jakarta.
Republic of Indonesia, Ministry of State Apparatus
Empowerement and Bureaucratic Reformation. 2018.
Permenkes No.3 of 2018 about Public Service
Innovation Competition. Jakarta.
Sihabudin , A., Mutjaba , B., & Dimyati , I. 2018. Adoption
of Innovation Program Family Planning by the acceptor
of the Community of Indigenous Remote Baduy
dikecamatan Leuwidamar Regency of Lebak . Journal
of Extension, 14 (1), 175-188.
https://doi.org/10.25015/penyuluhan.v14i1.15620
Strome, Trevor L. 2013. Healthcare Analytics for Quality
and Performance Improvement. Canada: John Wiley
and Sons.
Tasmil, T., 2014. Asessing The Adoption rate of E-
Puskesmas with Technology Acceptance Model
Perspective. Pekommas, 17(3), p.222367.
WHO. 2020. COVID-19 Significantly Impacts Health
Services for Non Communicable Diseases. [online].
Available at: <https://www.who.int/news-
room/detail/01-06-2020-covid-19-significantly-
ICSDH 2021 - International Conference on Social Determinants of Health
168

impacts-health-services-for-noncommunicable-
diseases.
Widhiarso, W. (2010). Create a Scor Category for The
Measurement result from The Scale. Membuat Kategori
Skor Hasil Pengukuran dari Skala. Faculty of
Physicology. Univercity of Gadjah Mada. Yogyakarta.
Wijaya, Vunny . 2020. Evaluation of the Performance of
the Task Force for the Acceleration of Handling
COVID-19. The Indonesian Institute Center for Public
Policy Research. [on line]. Available at: <
https://www.theindonesianinstitute.com/wp-
content/uploads/2020/06/Policy-Assessment-The-
Indonesian-Institute-2020-Vunny-Wijaya- Evaluation-
Kinerja-Gugus-Tugas-COVID- 19.pdf> [ Accessed on
2 July 2021].
The Factors of Innovations Implementation and Information Technology Utilization in the Health Sector to Quality of Services at the DKI
Jakarta Provincial Health Centre during the COVID-19 Pandemic for the Year 2020-2021
169
