
Body Composition and Sarcopenia Indicator among Elderly in the
Nursing Home
Farapti Farapti
1,2
, Amelliya N. Heriyana
1,
Purwita W. Laksmi
3
, Muhammad Miftahussurur
1
1
Department of Nutrition, Faculty of Public Health, Universitas Airlangga, Surabaya, Indonesia
2
Post Graduate Doctoral Program, Faculty of Medicine, Universitas Airlangga, Surabaya, Indonesia
3
Department of Internal Medicine, Faculty of Medicine, Universitas Indonesia, Jakarta, Indonesia
Keywords: Body Composition, Sarcopenia Indicator, Elderly, Nutritional Status.
Abstract: Sarcopenia is definite as the age-related loss of muscle mass and muscle function with the highest prevalence
was reported in institutionalized older adults. Body composition consisted of many compartments of muscle
mass and types of fat mass. This study aims to analyse the association between body composition (muscle
mass and fat mass) and physical performance as sarcopenia indicator among elderly in the nursing home. We
examined the skeletal muscle mass index (SMI), grip strength (GS) and walking speed (WS) as sarcopenia
indicator. For muscle mass area, we measured whole, arms, legs, and trunk skeletal. We also measured body
fat, visceral fat, and subcutaneous fat as component of fat mass. A total of 54 elderly (75.9 % was female)
participated with mean age was 71 ± 8.2 years. The prevalence rates of sarcopenia were 98% based on three
indicators of sarcopenia. Almost of muscle mass areas except trunk were associated with SMI and GS,
meanwhile all areas of subcutaneous fat were correlated with GS. Among elderly nursing home, the
prevalence of sarcopenia was high. Muscle mass area and subcutaneous fat was correlated with sarcopenia
indicators.
1 INTRODUCTION
Nowadays, the pace of population ageing around the
world is increasing dramatically. Between 2015 and
2050, the proportion of people aged 60 years will
increase from 12% to 22%. It means the number of
older will be expected to total 2 billion by 2050 and
80% of elderly will be living in low and middle
income countries (World Health Organization, 2018).
Based on the central bureau of statistics data, it is
stated that Indonesia's life expectancy rate increased
from 71.20 years in 2018 to 71.34 years in 2019 with
an average life expectancy for men is 69.44 years and
for women is 73.33 years (Central Bureau of
Statistics, 2020a, 2020b). The fruitfulness of the
government to increasing life expectancy certainly be
in line with the increase in the dependency ratio of the
productive age against the unproductive age, where
the unproductive age is assumed with elderly
(Ministry of Health, 2014). The physical and
psychological conditions of the elderly who have
setbacks will cause them to will have dependency on
productive groups (Central Bureau of Statistics,
2017). Like we know that the elderly has many health
problems such as hearing loss, cataracts, back and
neck pain, depression, and dementia (World Health
Organization, 2018). Furthermore, mostly of elderly
often suffer non-communicable disease or non-
communicable disease (Cicih, 2019).
The emergence of various diseases and other
health problems that suffered by the elderly can be
caused by aging factors and comorbidities that the
elderly had previously suffered before entering old
age (Favora-Moreira et al,. 2016; Fatmawati &
Imron, 2017). A lot of health problems that suffered
by elderly due to physiological and pathological
problems can cause a decrease of normal body
function and adversely affect to body composition,
physiological function, and other clinical impacts
(Sttraton et al., 2003; Favora-Moreira et al., 2016).
Physiological functions changes of the body due to
aging can affect to function of vital organs of the
body, such as a decrease in cardiac output in a resting
state, maximum respiratory capacity, kidney filtration
rate, and nerve conduction velocity (JafariNasabian et
al., 2017; Strait & Lakatta, 2012). Changes in body
composition in the elderly that are often encountered
are a decrease in bone mass, decrease in muscle mass
18
Farapti, F., Heriyana, A., Laksmi, P. and Miftahussurur, M.
Body Composition and Sarcopenia Indicator among Elderly in the Nursing Home.
DOI: 10.5220/0010757000003235
In Proceedings of the 3rd International Conference on Social Determinants of Health (ICSDH 2021), pages 18-26
ISBN: 978-989-758-542-5
Copyright
c
2022 by SCITEPRESS – Science and Technology Publications, Lda. All rights reserved

and strength and an increase in body fat (Ilich et al.,
2014; Schlenker & Roth, 2013).
Body composition changes that occur in the
proportion of muscle and body fat both have
contradictory differences. Muscle mass and strength
tend to decrease with age, whereas body fat tends to
increase with age (JafariNasabian et al., 2017).
Muscle mass will decrease about 1-2% after a person
enters to 50 years and muscle strength will decrease
around 12-15% every 10 years after entering the age
of 50 years (Papa et al., 2017; Quittan, 2016). A
longitudinal study that had conducted on Caucasian
men with age 70 years-over showed that fat-free mass
decreased by 0.5-0.8% per year (Dey et al., 2009;
Kemmler et al., 2019). Similar with this, other studies
have shown that a decrease also occurs in the thigh
muscle mass of both men and women aged 70 years
(Cameron et al., 2020). Aging factors can interfere
with homeostasis in skeletal muscles with be caused
an imbalance between anabolic and catabolic
pathways in muscle protein (Cruz-Jentoft et al.,
2019). The imbalance is mediated by the presence of
pro inflammatory cytokines such as TNF-α and IL-6
which have been shown to be abundant in the skeletal
muscles of the elderly (Dhillon & Hasni, 2017). In
this case, skeletal muscles are important and very
influential in muscle strength in the elderly.
It is known that sarcopenia is associated with
decreased function and disability in the elderly which
can have an impact on decreasing quality of life
(Vitriana et al., 2016). On progress, many studies
were carried out to analyze various things related to
sarcopenia. At 2010, the Working Group on Older
People (EWGSOP) included muscle mass, gait speed
and hand grip strength as the main parameters in
diagnosing sarcopenia and then in 2018 EWGSOP
revised it to EWGSOP2 by changing the step strength
criteria as criteria for diagnosing normal sarcopenia
(Cruz-Jentoft et al., 2010, 2019). Until now,
Indonesia does not yet have a decision to diagnose
sarcopenia. However, the Asian Working Group for
Sarcopenia (AWGS) conducted a study related to the
diagnosis of sarcopenia that can be carried out for
Asian populations including Indonesia by using the
EWGSOP approcach. Nevertheless since its
inception, muscle mass is an indicator that constantly
used to diagnose sarcopenia (Cederholm et al., 2011;
Reiss et al., 2019). Eventually, based on the
EWGSOP has assigned muscle mass, gait speed, and
hand grip strength are the main indicators (Cruz-
Jentoft et al., 2019). To diagnosis, skeletal muscle
becomes the main variable in determining the muscle
mass index used in diagnosing sarcopenia (Vitriana et
al., 2016). As we know that skeletal muscles are
responsible for the movement of the body, so
automatically the skeletal muscles will play an
important role in optimizing physical performance
(Tieland et al., 2018). Another side, various studies
show that as getting older there will also be an
increase in body fat mass (Reid & Fielding, 2012).
Since body composition consisted of many
compartments of muscle mass and types of fat mass
and changes with aging have effect on poor physical
performance. Furthermore, it is known that the
highest prevalence of sarcopenia was reported in
institutionalized older adults. It is important to
analyze the association between body composition
(muscle mass and fat mass) and physical performance
as sarcopenia indicator among elderly in the nursing
home (Benzinger et al., 2020).
2 MATERIALS AND METHODS
The research was conducted in October - November
2020, located at UPTD Griya Werdha Surabaya using
a cross sectional research design. Respondents were
selected by purposive sampling from elderly residing
at Griya Wredha. Elderly who fulfill study criteria
were selected as subjects in this study. Researchers
have determined several inclusion criteria for
respondents who are allowed to participate in the
study, including elderly people aged ≥ 60 years, fully
aware, not bed rest, and able to communicate with
them. As for the exclusion criteria, including
respondents who resigned, were sick or bedrest at the
time when the data were collecting, and were not
cooperative in the study. Total samples in the study
were 54 elderly people. This study has an ethical
number: 183 / HRECC.FODM / III / 2020.
Primary and secondary data were collected.
Primary data was conducted to obtain data in the form
of anthropometry and sarcopenia indicators in the
form of skeletal muscle mass index (SMI), hand-grip
strength (HS), and walking speed (WS). Secondary
data of medical record were disease history, length of
stay in the institution, and age. The skeletal muscle
mass index (SMI) was calculated by measuring the
mass of skeletal muscles by bioelectrical impedance
analysis (BIA Karada Scan HBF375). The hand-grip
strength (HS) was measured using a handgrip
dynamometer (Camry EH 101) in kilograms.
Subjects were instructed to hold the dynamometer as
hard as they could while seated in an upright posture
with arms by their sides and elbows flexed 90
degrees. The measurement was performed twice,
each the left and right hand and the maximum value
was taken. In the measurement of walking speed,
Body Composition and Sarcopenia Indicator among Elderly in the Nursing Home
19
subjects are tested on a 3-meter walked, then travel
time is measured and calculated to be the speed of
walking time in meters per second (m/s).
Cut-off point value for diagnosis of sarcopenia on
three parameters, namely muscle mass index (kg/m2)
<7.0 (male) and <5.7 (female); the standard values of
handgrip strength (kg) were <26 (male) and <18
(female); walking speed (m/s) ≤0.8 (Vitriana et al.,
2016). In addition, the way to diagnose sarcopenia are
as follows: (1) Measurement of handgrip strength and
gait speed; (2) If handgrip strength and gait speed are
normal based on cut-off then the respondent don’t
have sarcopenia but if handgrip and/or gait speed are
low then the next measurement to diagnosis have to
done; (3) Measurement of muscle mass, that if the
measurement is normal then respondent don’t have
sarcopenia and vice versa. All measurement is then
carried out an approach according to the cut-off on
the AWGS (Asian Working Group for Sarcopenia)
parameter because Indonesia does not yet have the
most determined diagnosis of sarcopenia. The AWGS
determination has referred to the EWGSOP
(European Working Group on Sarcopenia in Older
People) and has been adapted to the conditions of the
Asian community. Therefore, researchers chose
AWGS in making the diagnosis of sarcopenia in this
study. This study was a cross-sectional observational
analytic study. To analyze correlation of body
composition and sarcopenia indicators in elderly all
statistical analyses were performed using IBM SPSS
Statistics 20.0 version. The distributed variables are
shown as mean ± standard deviation while the
correlation analysis using Pearson Correlation
Coefficient. As for the significance value of the
analysis results if the p-value <0.05.
3 RESULTS AND DISCUSSION
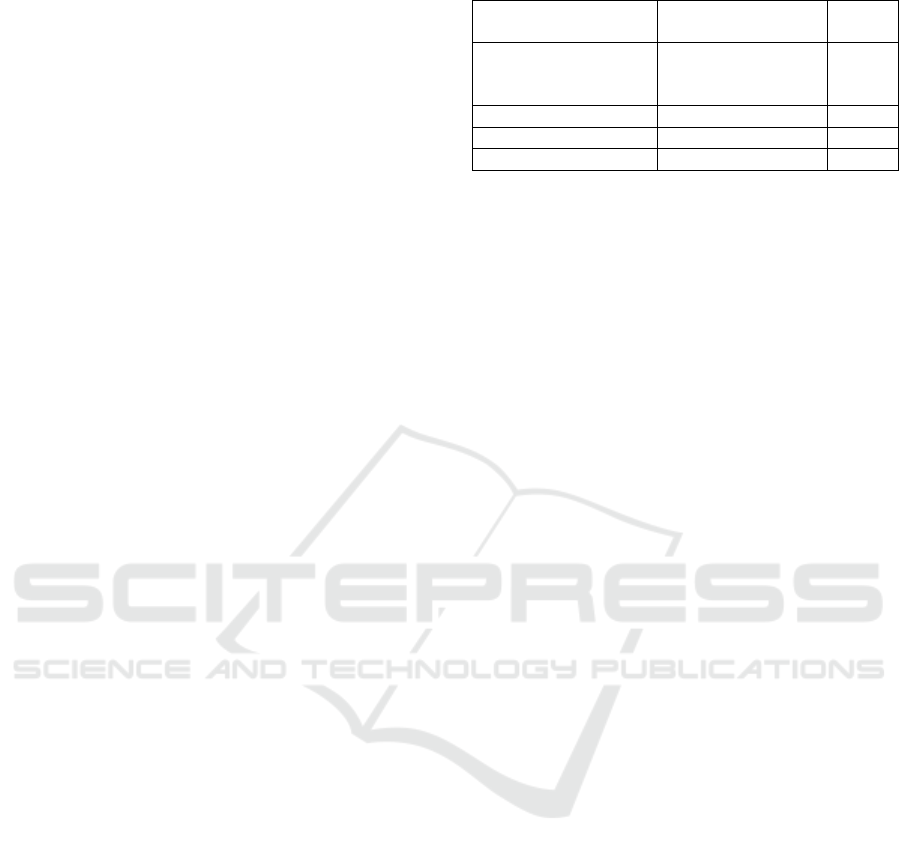
Distribution about characteristics of subject showed
in Table 1. It is known that most of the respondents
are female (75.9%) with average of age about 71 ±
8.2 years old, continuous mean of long stayed in
nursing home 21.6 ± 17.2 month.
This study shows that respondents have a mean of
body weight 51 ± 12.2 kg with a body mass index
(BMI) of 21.6 ± 4.5 kg/m
2
. The percentage of fat mass
and muscle mass in the elderly, respectively, has a
mean of 30.6 ± 7.25 (%) and 23.0 ± 2.8 (%), the
details are summarized in Table 2. Data that were
released states that fat in the elderly can reach 30%
while the Lean Body Mass (LBM) that consisting of
protein, water, and mineral mass is 12%, 53%, and
5%, respectively (Brown et al., 2011).
Table 1: Characteristics of subject.
Variable
Total (n) or
mean ±SD
%
Age (years)
Long stayed (month)
Body weight (kg)
71 ± 8.2
21.6 ± 17.2
51.1 ± 12.2
Gende
r
Male 13 24.1
Female 41 75.9
It is known that the elderly tends to have a higher
body fat mass when compared to their fat-free mass
including muscle mass in the elderly, it is because
when someone getting older, the fat mass tends to
increase while the muscle mass will decrease
(JafariNasabian et al., 2017; Kemmler et al., 2019). In
contrast, fat mass increases gradually around the age
of 20-25 years and peaks at around 60-70 years of age
(Cruz-Jentoft et al., 2019; JafariNasabian et al.,
2017). Muscle loss accompanied by an increase in fat
mass is common in the elderly, known as sarcopenia
obesity syndrome (JafariNasabian et al., 2017;
Kalyani et al., 2014). Physical activity, food intake,
and hormonal changes due to aging can all be
associated with changes in body composition in the
elderly (Brown et al., 2011).
In addition to changes in body composition due to
aging, other effects that can be caused by aging
include the limited physical performance of the
elderly which tends to decline so that they may have
limitations in movement (S. Kim et al., 2017;
Mikkola et al., 2020). Furthermore, various factors
that cause decreased body function in the elderly,
including physical performance are also associated
with sarcopenia (Sims et al., 2013). Sarcopenia is an
age-related change that effects to changes in body fat
and muscle. Muscle loss is even referred to as a
universal phenomenon that commonly occurs due to
increasing age even in healthy people (Amarya et al.,
2015). Association between age and aging factors,
skeletal muscles will also run into atrophy (Tieland et
al., 2018). A study conducted ina quantitative review
showed that the rate of reduction in muscle mass
during life was about 0.37% a year for women, and
0.47% a year for men (Mitchell et al., 2012). Based
on longitudinal research, it was found that the elderly
who are more than 75 years old, on average will lose
muscle mass of about 0.64-0.70% a year for women
and about 0.80-0.98% a year for men (Mitchell et al.,
2012). Skeletal muscles, also known as striated
muscles, are known to be numerous and attached to
the limbs of the body (Ministry of Health, 2017).
Table 3 describe a descriptive analysis of the
measurement results of several indicators of
ICSDH 2021 - International Conference on Social Determinants of Health
20
Table 2: Characteristics of body composition in elderly.
Characteristics
Total (n=54) Male (n=13) Female (n=41)
Mean ± SD Mean ± SD Mean ± SD
Body Mass Index (kg/m
2
)
21.6 ± 12.2 21.8 ± 3.5 21.5 ± 4.8
Body Fat (%)
30.6 ± 7.25 25.4 ± 7.1 32.2 ± 6.59
Visceral Fat (%) 6.6 ± 5.1 9.1 ± 5.3 5.8 ± 4.8
Subcutaneous Fat
Whole (%) 25.0 ± 6.8 18.3 ± 5.3 27.2 ± 6.09
Arms (%) 24.0 ± 8.7 17.6 ± 4.8 26.02 ± 8.6
Legs (%) 38.2 ± 10.8 23.1 ± 5.5 42.9 ± 7.03
Trunk (%) 31.3 ± 9.2 21.9 ± 6.8 34.3 ± 7.75
Muscle Mass
Whole (%) 23.0 ± 2.8 26.2 ± 2.8 21.9 ± 1.9
Arms (%) 18.2 ± 4.85 22.7 ± 7.4 16.7 ± 2.45
Legs (%) 28.3 ± 6.2 36.1 ± 4.9 25.8 ± 4.2
Trunk (%) 33.7 ± 7.5 37.6 ± 10.2 32.5 ± 6.05
sarcopenia which include the mean muscle mass
index (3.9 ± 1.05 kg / m2), handgrip strength (14.5 ±
5.1 kg), and gait speed (0.5 ± 0.19 m/s). Moreover,
based on gender it can be concluded that male
respondents tend to have higher mean results for each
indicator of sarcopenia when compared to female
respondents. It is in line with a study conducted by
measuring muscle mass between male and female
respondents and the results showed that male muscle
mass (31.23 ± 4.19 kg) was higher when compared to
elderly female respondents (21.01 ± 3.20 kg)
(Krzymińska-Siemaszko et al., 2014). Likewise, the
results of research conducted in Indonesia found that
the muscle mass index, physical performance and
muscle strength of men tended to be higher than that
of women (Vitriana et al., 2016). The differences that
occur can be caused by various factors such as age,
body weight, protein intake, menopause, and
hormones (Chen et al., 2016; Lowe et al., 2010;
Skrzek et al., 2012). Men will tend to have higher
muscle mass it can be caused by the hormone
testosterone which can affect muscle building (Gentil
& Bottaro, 2010).
If be observed at each characteristic indicator of
sarcopenia regardless of gender, most of the three
indicators will be categorized as low with a
percentage reached up to 90%. The low category of
respondents' muscle mass index variable reached
96.3%. It is known that the muscle mass index is
associated with height, physical activity, obesity, and
comorbidities (Bosy-Westphal & Müller, 2015;
Serra-Prat et al., 2017). A study that related with
muscle mass index states that only 39.3 ± 4.5% are
categorized as normal and the rest are known to have
moderate and low muscle mass index (Chang et al.,
2017). The indicators of hand grip strength and
walking speed, it is known that it is related to physical
performance. In line with the indicators on the muscle
mass index, indicators on physical performance also
have a very high percentage that reached up to 90%.
Several studies have stated that physical performance
will be related to the muscle mass in the thighs and in
the hand muscles which are represented by hand grip
strength (Altubasi, 2017; Kristiana et al., 2020). The
study also stated that 44.3% of respondents had
moderate physical performance (Kristiana et al.,
2020). Based on the mean value of three indicators of
sarcopenia, it can be concluded that most of the
elderly (> 90%) have values that are below the cut-off
point value for sarcopenia (Vitriana et al., 2016).
According to a systematic review and meta-analysis
study conducted to compare the prevalence of
sarcopenia in the population of community people,
hospitals, and nursing home, it was found that the
elderly who live in nursing home have the highest
prevalence of sarcopenia up to 38%, elderly people
who are hospitalized are 23%, while the elderly who
live in the community are only 10% of the total
respondents of 34.955 people (Papadopoulou et al.,
2020). Another study was stated that the prevalence
of sarcopenia in the elderly living in social
institutions reached 41% (Shen et al., 2019). This
prevalence is lower when compared to the results of
the sarcopenia study conducted by researchers, which
reached a prevalence of 98.1% of the elderly have
sarcopenia. However, in a different study conducted
in Japan, it was found that the prevalence of
sarcopenia in elderly people can reach 7.1-98.0% in
men and 19.8-88.0% in women (H. Kim et al., 2016).
Based on a comparative study that has been
Body Composition and Sarcopenia Indicator among Elderly in the Nursing Home
21
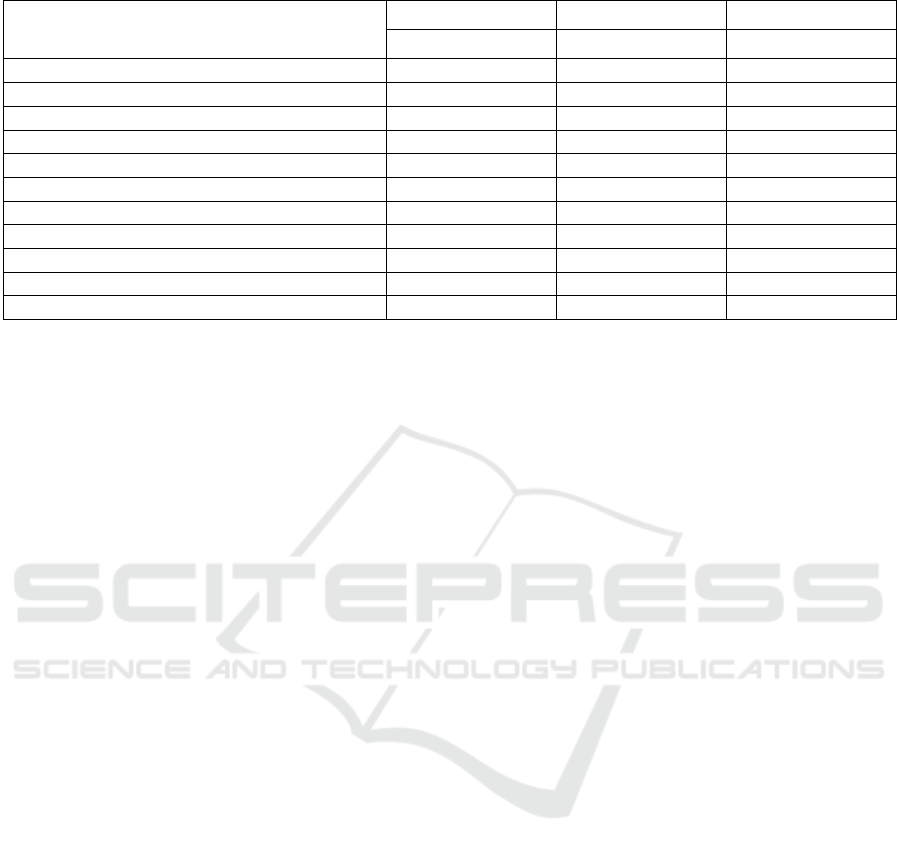
Table 3: Indicators of sarcopenia.
Characteristics
Total (n=54) Male (n=13) Female (n=41)
Mean ± SD Mean ± SD Mean ± SD
Skeletal Muscle Mass Index (kg/m
2
) 3.9 ± 1.05 5.09 ± 1.1 3.6 ± 0.7
Low (%) 96.3 92.3
97.6
Enough (%) 7.3 7.7
2.4
Handgrip Strength (kg) 14.5 ± 5.1 19.6 ± 5.5 12.98 ± 3.8
Low (%) 90.7 92.3 90.2
Enough (%) 9.3 7.7 9.8
Gait Speed (m/s) 0.5 ± 0.19 0.69 ± 0.16 0.45 ± 0.17
Low (%) 90.7 84.6 95.1
Enough (%) 9.3 15.4 4.9
Sarcopenia (person) 53 12 41
Prevalence (%) 98.1 92.3 100
conducted, it shows that the elderly who live with
the family tend to have a higher sense of
independence and are significantly different from the
elderly in the nursing home so that they tend to feel
capable of doing many activities while the elderly in
social institutions tend to feel that they are weak and
always needing other people (Putri et al., 2015).
Furthermore, the elderly often feel boredom while in
the orphanage due to the limited food choices they
can choose so that it can affect the elderly's food
intake and will significantly affect their body weight
(Crogan et al., 2013).
As we known that measurement of the indicators
of sarcopenia and the skeletal muscle of respondents
has been carried out by researchers with the
distribution results described in Table 3. Furthermore,
in Table 4. Researchers processed the data to see the
relationship between both of them, and it was found
that there was a significant relationship between
muscle mass index and the whole skeletal, skeletal
arms, and skeletal legs. In the indicator of handgrip
strength with whole skeletal, and skeletal legs, a
significant relationship was also found. The last, on
gait speed indicator with the whole skeletal, skeletal
arms, and skeletal legs are related to. From the
skeletal trunk data, it is known that there is no
relationship with the muscle mass index, hand grip,
and gait strength.
Muscle mass index calculated by involving the
proportion of total skeletal muscle in the body is
known to be associated with total skeletal muscles,
arm muscles, and leg muscles. It can be due to the
theory that most of the skeletal muscles are attached
to the bones of the limbs such as the limbs (Ministry
of Health, 2017). Skeletal muscle has the main
function to move such as in the hands, fingers, and
feet that there are many skeletal muscles in them
(Kedkar, 2016). In other studies, it was found that the
arm muscle mass index (arms SMI) was significantly
associated with the anthropometric index of muscle
mass (Shimono et al., 2020). Moreover, handgrip was
known to be positively associated with leg muscles (p
= 0.011). In line with the results of this study,
according to Fragala et al. (2016) mention that
handgrip strength is significantly related to the
strength of the leg's existence. In the variable of stride
strength with leg muscles, it is known to have a
positive relationship, which means that the lower of
gait speed, the weaker the leg muscles of the elderly.
In elderly, aging followed by the susceptibility of the
elderly to have health problems such as muscle
disorders will significantly reduce muscle strength in
the legs and ankles (World Health Organization,
2018; Zhao et al., 2018).
In addition, the researchers also included the
variables of body fat (body fat, visceral fat, and
subcutaneous fat) into the correlation analysis. From
the table above, it can be concluded that the variable
body fat which has a significant correlation with the
sarcopenia indicator tends to have a negative
relationship. This is because the main variable in
measuring sarcopenia is related to body muscles
(Cruz-Jentoft et al., 2019; Shimokata et al., 2018). In
elderly, it is known that body muscle tends to be
inversely related with body fat, meaning that the
elderly often sustain an increase in fat mass but a
decrease in muscle mass (Kemmler et al., 2019). The
condition of decreased muscle mass that followed
with increased of body fat in the elderly is known as
sarcopenic obesity (Hong & Choi, 2020). Based on a
cohort study using the National Health and Nutrition
Examination Survey (NHANES), the percentage of
obese sarcopenia in men reaches 12.6% and in
women is 33.5% and in the elderly who are over 80
years old it can increase to 27.5% in men and 48% in
women (Batsis et al., 2017).
ICSDH 2021 - International Conference on Social Determinants of Health
22
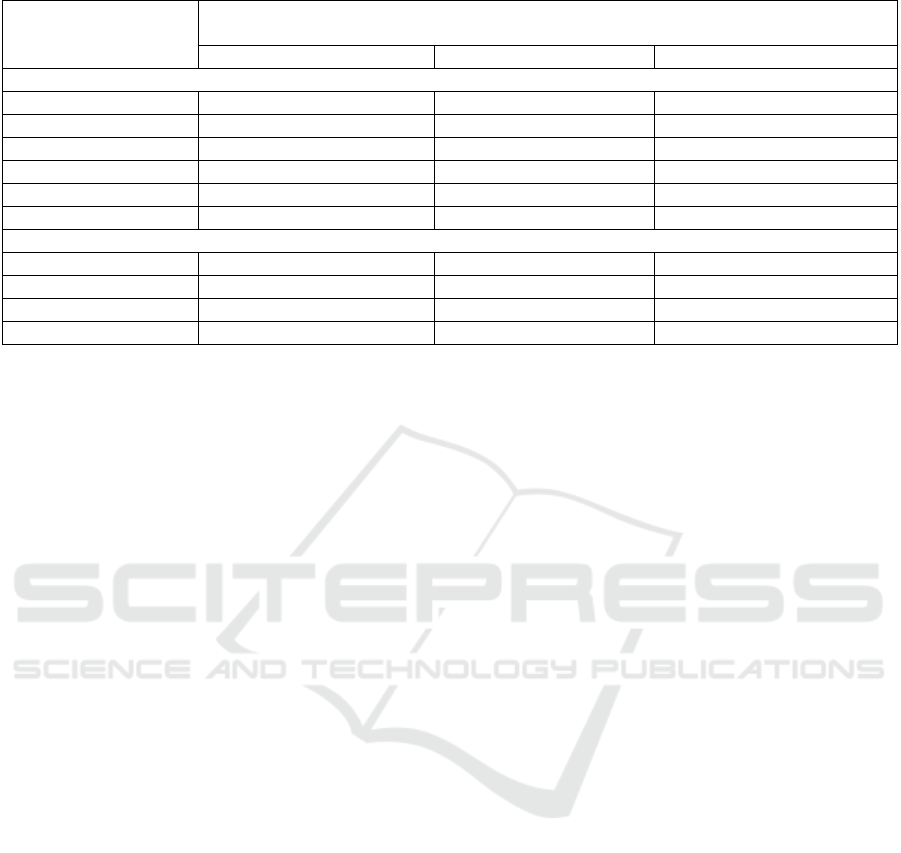
Table 4: Correlation between body composition with indicators of sarcopenia.
Characteristics
Indicators of Sarcopenia
(correlation, significance)
Skeletal Muscle Mass Index Handgrip Strength Gait Speed
Skeletal Muscle
Whole r=0.62 (p=0.000)* r=0.301 (p=0.027)* r=0.348 (p=0.010)*
Arms r=0.68 (p=0.000)* r=0.246 (p=0.073) r=0.336 (p=0.013)*
Legs r=0.58 (p=0.000)* r=0.342 (p=0.011)* r=0.405 (p=0.002)*
Trunk r=0.06 (p=0.668) r=0.196 (p=0.436) r=0.108 (p=0.436)
Body Fat r=-0.09 (p=0.516) r=-0.169 (p=0221) r=-0.252 (p=0.066)
Visceral Fat r=0.604 (p=0.000)* r=0.181 (p=0.191) r=0.147 (p=0.290)
Subcutaneous Fat
Whole r=-0.339 (p=0.012)* r=-0.265 (p=0,053) r=-0.308 (p=0.023)*
Arms r=-0.181 (p=0.191) r=-0.261 (p=0,056) r=-0.274 (p=0.045)*
Legs r=-0.510 (p=0.000)* r=-0.357 (p=0.008)* r=-0,395 (p=0.003)*
Trunk r=-406 (p=0.002)* r=-0.220 (p=0.109) r=-0.303 (p=0.026)*
A recent meta-analysis study showed that fat mass
can weaken the relationship of muscle mass and
function mobility in elderly adults (Schaap et al.,
2013). Furthermore, another research also states that
fat mass is known to be negatively related with
muscle performance in adults and the elderly, in this
case is using a jump strength test (Moore et al., 2020).
It can be caused by adipose tissue that can cause
muscle shortening that is not optimal and weaken the
calcium signal which can affect future muscle
formation (Rahemi et al., 2015; Tallis et al., 2018).
High of fat mass is also known to reduce the
activation of agonist muscles on the other hand, high
adipose will also increase the activity of body muscle
loss which can have an impact on reducing muscle
fiber formation (Moore et al., 2020). Adipose is also
associated with a higher infiltration of Adipose Tissue
of Skeletal Muscles (ATSM) which is associated with
decreased strength capacity and strength formation by
muscles leading to deterioration of muscle quality
(Moore et al., 2020; Tuttle et al., 2012). Even though,
there are many other factors that might affect it such
as age, weight, height, physical activity, etc.
The lack of this study is that it does not study
detailed information on the factors that cause
sarcopenia each individual. Although living in an
elderly nursing home with the same physical activity
and diet, data on physical activity and food intake per
individual may show different results. Other factors
such as stress levels, hormonal changes, other
comorbidities in the elderly may be the cause of
sarcopenia which still needs further investigation.
While the strengths of this study are to explore
sarcopenia data based on three indicators, namely
muscle mass index, hand grip strength, and walking
speed and also analyzes body composition in the form
of body fat (body fat, visceral fat, and subcutaneous
fat).
4 CONCLUSIONS
In summary, muscle mass area and subcutaneous fat
was correlated with sarcopenia indicators. The
important finding is the prevalence of sarcopenia was
high among elderly in the nursing home. Further
research is needed to investigate factors associated
with sarcopenia in the population. The most
important thing is implementing preventive strategies
and effective treatment to get better physical
performance and optimal health impact.
ACKNOWLEDGEMENTS
The authors would like to express our sincere
appreciation to the participants of this study. The
authors also wish to thank to all authors for involving
in data collection, data analysis until manuscript
preparation.
REFERENCES
Altubasi, I., 2017. Physical performance of elderly adults in
association with thigh tissue composition: a cross-
sectional study. J. Phys. Ther. Sci, 29, 2194–2198.
Amarya, S., Singh, K., & Sabharwal, M., 2015. Changes
during aging and their association with malnutrition.
Journal of Clinical Gerontology and Geriatrics, 6(3),
78–84.
Body Composition and Sarcopenia Indicator among Elderly in the Nursing Home
23

Batsis, J. A., Mackenzie, T. A., Emeny, R. T., Lopez-
Jimenez, F., & Bartels, S. J., 2017. Low Lean Mass
With and Without Obesity, and Mortality: Results From
the 1999-2004 National Health and Nutrition
Examination Survey. The Journals of Gerontology.
Series A, Biological Sciences and Medical Sciences,
72(10), 1445–1451.
Benzinger, P., Bauer, J. M., Schwenk, M., Grund, S., &
Goisser, S., 2020. Treatment of sarcopenia in nursing
home residents: A scoping review protocol. BMJ Open,
10(8).
Bosy-Westphal, A., & Müller, M. J., 2015. Identification of
skeletal muscle mass depletion across age and BMI
groups in health and disease--there is need for a unified
definition. International Journal of Obesity (2005),
39(3), 379–386.
Brown, J. E., Isaacs, J. S., Krinke, U. B., Lechtenberg, E.,
& Murtaugh, M. A., 2011. Nutrition Through The Life
Cycle Fourth Edition (4th ed.). Wadsworth Cengage
Learning.
Cameron, J., McPhee, J. S., Jones, D. A., & Degens, H.,
2020. Five-year longitudinal changes in thigh muscle
mass of septuagenarian men and women assessed with
DXA and MRI. Aging Clinical and Experimental
Research, 32(4), 617–624.
Cederholm, T. E., Bauer, J. M., Boirie, Y., Schneider, S.
M., Sieber, C. C., & Rolland, Y., 2011. Toward a
definition of sarcopenia. Clinics in Geriatric Medicine,
27(3), 341–353.
Central Bureau of Statistics, 2017. Profil Penduduk Lanjut
Usia Provinsi Jawa Timur 2017. Central Bureau of
Statistics of Republik Indonesia.
Central Bureau of Statistics, 2020a. Indikator Strategis-
Badan Pusat Statistik. Central Bureau of Statistics of
Republic Indonesia.
Central Bureau of Statistics, 2020b. Umur Harapan Hidup
Saat Lahir (UHH) Menurut Provinsi, 2010-2019.
Central Bureau of Statistics of Republic Indonesia.
Chang, J. S., Kim, T. H., Kim, H., Choi, E. H., Kim, N., &
Kong, I. D., 2017. Qualitative muscle mass index as a
predictor of skeletal muscle function deficit in Asian
older adults. Geriatrics & Gerontology International,
17(1), 99–107.
Chen, L.-K., Lee, W.-J., Peng, L.-N., Liu, L.-K., Arai, H.,
& Akishita, M., 2016. Recent Advances in Sarcopenia
Research in Asia: 2016 Update From the Asian
Working Group for Sarcopenia. Journal of the
American Medical Directors Association, 17(8),
767.e1-7.
Cicih, L. H. M., 2019. Info demografi. National Population
and Family Planning Agency.
Crogan, N. L., Dupler, A. E., Short, R., & Heaton, G., 2013.
Food choice can improve nursing home resident meal
service satisfaction and nutritional status. Journal of
Gerontological Nursing, 39(5), 38–45.
Cruz-Jentoft, A. J., Baeyens, J. P., Bauer, J. M., Boirie, Y.,
Cederholm, T., Landi, F., Martin, F. C., Michel, J.-P.,
Rolland, Y., Schneider, S. M., Topinková, E.,
Vandewoude, M., & Zamboni, M., 2010. Sarcopenia:
European consensus on definition and diagnosis:
Report of the European Working Group on Sarcopenia
in Older People. Age and Ageing, 39(4), 412–423.
Cruz-Jentoft, A. J., Bahat, G., Bauer, J., Boirie, Y., Bruyère,
O., Cederholm, T., Cooper, C., Landi, F., Rolland, Y.,
Sayer, A. A., Schneider, S. M., Sieber, C. C.,
Topinkova, E., Vandewoude, M., Visser, M., &
Zamboni, M., 2019. Sarcopenia: revised European
consensus on definition and diagnosis. Age and Ageing,
48(1), 16–31.
Dey, D. K., Bosaeus, I., Lissner, L., & Steen, B., 2009.
Changes in body composition and its relation to muscle
strength in 75-year-old men and women: a 5-year
prospective follow-up study of the NORA cohort in
Göteborg, Sweden. Nutrition (Burbank, Los Angeles
County, Calif.), 25(6), 613–619.
Dhillon, R. J. S., & Hasni, S., 2017. Pathogenesis and
Management of Sarcopenia. Clinics in Geriatric
Medicine, 33(1), 17–26.
Fatmawati, V dan Imron, M., 2017. Perilaku koping pada
lansia yang mengalami penurunan gerak dan fungsi.
Intuisi : Jurnal Psikologi Ilmiah, 9(1).
Favora-Moreira, NC., Krausch-Hofmann, S., Matthys, C.,
vereecken, C., et al., 2016. Risk Factors for
Malnutrition in Older Adults: A Systematic Review of
the Literature Based on Longitudinal Data. Adv. Nutr,
7(3), 507–522.
Fragala, M. S., Alley, D. E., Shardell, M. D., Harris, T. B.,
McLean, R. R., Kiel, D. P., Cawthon, P. M., Dam, T.-
T. L., Ferrucci, L., Guralnik, J. M., Kritchevsky, S. B.,
Vassileva, M. T., Gudnason, V., Eiriksdottir, G.,
Koster, A., Newman, A., Siggeirsdottir, K., Satterfield,
S., Studenski, S. A., & Kenny, A. M., 2016.
Comparison of Handgrip and Leg Extension Strength in
Predicting Slow Gait Speed in Older Adults. Journal
of the American Geriatrics Society, 64(1), 144–150.
Gentil, P., & Bottaro, M., 2010. Influence of supervision
ratio on muscle adaptations to resistance training in
nontrained subjects. Journal of Strength and
Conditioning Research, 24(3), 639–643.
Hong, S.-H., & Choi, K. M., 2020. Sarcopenic Obesity,
Insulin Resistance, and Their Implications in
Cardiovascular and Metabolic Consequences.
International Journal of Molecular Sciences, 21(2).
Ilich, J. Z., Kelly, O. J., Inglis, J. E., Panton, L. B., Duque,
G., & Ormsbee, M. J., 2014. Interrelationship among
muscle, fat, and bone: connecting the dots on cellular,
hormonal, and whole body levels. Ageing Research
Reviews, 15, 51–60.
JafariNasabian, P., Inglis, J. E., Reilly, W., Kelly, O. J., &
Ilich, J. Z., 2017. Aging human body: changes in bone,
muscle and body fat with consequent changes in
nutrient intake. The Journal of Endocrinology, 234(1),
R37–R51.
Kalyani, R. R., Corriere, M., & Ferrucci, L., 2014. Age-
related and disease-related muscle loss: the effect of
diabetes, obesity, and other diseases. The Lancet.
Diabetes & Endocrinology, 2(10), 819–829.
Kedkar, C. dan K. G., 2016. Skeletal Muscle. The
Encyclopedia of Food and Health, 4, 795–801.
ICSDH 2021 - International Conference on Social Determinants of Health
24

Kemmler, W., von Stengel, S., & Schoene, D., 2019.
Longitudinal Changes in Muscle Mass and Function in
Older Men at Increased Risk for Sarcopenia - The
FrOST-Study. The Journal of Frailty & Aging, 8(2),
57–61.
Kim, H., Hirano, H., Edahiro, A., Ohara, Y., Watanabe, Y.,
Kojima, N., Kim, M., Hosoi, E., Yoshida, Y., Yoshida,
H., & Shinkai, S., 2016. Sarcopenia: Prevalence and
associated factors based on different suggested
definitions in community-dwelling older adults.
Geriatrics & Gerontology International, 16 Suppl 1,
110–122.
Kim, S., Leng, X. I., & Kritchevsky, S. B., 2017. Body
Composition and Physical Function in Older Adults
with Various Comorbidities. Innovation in Aging, 1(1).
Kristiana, T., Widajanti, N., & Satyawati, R., 2020.
Association between Muscle Mass and Muscle Strength
with Physical Performance in Elderly in Surabaya.
Surabaya Physical Medicine and Rehabilitation
Journal, 2(1), 24.
Krzymińska-Siemaszko, R., Czepulis, N., Suwalska, A.,
Dworak, L. B., Fryzowicz, A., Madej-Dziechciarow,
B., & Wieczorowska-Tobis, K., 2014. The significance
of body mass index in calculating the cut-off points for
low muscle mass in the elderly: methodological issues.
BioMed Research International, 2014, 450396.
Lowe, D. A., Baltgalvis, K. A., & Greising, S. M., 2010.
Mechanisms behind estrogen’s beneficial effect on
muscle strength in females. Exercise and Sport
Sciences Reviews, 38(2), 61–67.
Mikkola, T. M., Kautiainen, H., von Bonsdorff, M. B.,
Salonen, M. K., Wasenius, N., Kajantie, E., & Eriksson,
J. G., 2020. Body composition and changes in health-
related quality of life in older age: a 10-year follow-up
of the Helsinki Birth Cohort Study. Quality of Life
Research : An International Journal of Quality of Life
Aspects of Treatment, Care and Rehabilitation, 29(8),
2039–2050.
Ministry of Health, 2014. Infodatin: Situasi dan Analisis
Lanjut Usia. Ministry of Health Republic Indonesia.
Ministry of Health, 2017. Histologi dan Anatomi Fisiologi
Manusia. Ministry of Health Republic Indonesia.
Mitchell, W. K., Williams, J., Atherton, P., Larvin, M.,
Lund, J., & Narici, M., 2012. Sarcopenia, dynapenia,
and the impact of advancing age on human skeletal
muscle size and strength; a quantitative review.
Frontiers in Physiology, 3, 260.
Moore, B. A., Bemben, D. A., Lein, D. H., Bemben, M. G.,
& Singh, H., 2020. Fat Mass Is Negatively Associated
with Muscle Strength and Jump Test Performance. The
Journal of Frailty & Aging, 9
(4), 214–218.
Papa, E. V, Dong, X., & Hassan, M., 2017. Skeletal Muscle
Function Deficits in the Elderly: Current Perspectives
on Resistance Training. Journal of Nature and Science,
3(1).
Papadopoulou, S. K., Tsintavis, P., Potsaki, P., &
Papandreou, D., 2020. Differences in the Prevalence of
Sarcopenia in Community-Dwelling, Nursing Home
and Hospitalized Individuals. A Systematic Review
and Meta-Analysis. The Journal of Nutrition, Health &
Aging, 24(1), 83–90.
Putri, S. T., Fitriana, L. A., & Ningrum, A., 2015. Studi
Komparatif : Kualitas Hidup Lansia Yang Tinggal
Bersama Keluarga Dan Panti. Jurnal Pendidikan
Keperawatan Indonesia, 1(1), 1.
Quittan, M., 2016. Aspects of physical medicine and
rehabilitation in the treatment of deconditioned patients
in the acute care setting: the role of skeletal muscle.
Wien Med Wochenschr, 166, 28–38.
Rahemi, H., Nigam, N., & Wakeling, J. M., 2015. The
effect of intramuscular fat on skeletal muscle
mechanics: implications for the elderly and obese.
Journal of the Royal Society, Interface, 12(109),
20150365.
Reid, K. F., & Fielding, R. A., 2012. Skeletal muscle
power: a critical determinant of physical functioning in
older adults. Exercise and Sport Sciences Reviews,
40(1), 4–12.
Reiss, J., Iglseder, B., Alzner, R., Mayr-Pirker, B., Pirich,
C., Kässmann, H., Kreutzer, M., Dovjak, P., & Reiter,
R., 2019. Consequences of applying the new
EWGSOP2 guideline instead of the former EWGSOP
guideline for sarcopenia case finding in older patients.
Age and Ageing, 48(5), 719–724.
Schaap, L. A., Koster, A., & Visser, M., 2013. Adiposity,
muscle mass, and muscle strength in relation to
functional decline in older persons. Epidemiologic
Reviews, 35, 51–65.
Schlenker, E., & Roth, S. L., 2013. Williams’ Essentials of
Nutrition and Diet Therapy 10th edition. Mosby, Inc.
Serra-Prat, M., Papiol, M., Vico, J., Palomera, E.,
Bartolomé, M., & Burdoy, E., 2017. Factors Associated
with Poor Muscle Mass and Strength in A Community-
Dwelling Elderly Population: A Cross-Sectional Study.
Journal of Gerontology & Geriatric Research, 06(02).
Shen, Y., Chen, J., Chen, X., Hou, L., Lin, X., & Yang, M.,
2019. Prevalence and Associated Factors of Sarcopenia
in Nursing Home Residents: A Systematic Review and
Meta-analysis. Journal of the American Medical
Directors Association, 20(1), 5–13.
Shimokata, H., Shimada, H., Satake, S., Endo, N.,
Shibasaki, K., Ogawa, S., & Arai, H., 2018. Chapter 2
Epidemiology of sarcopenia. Geriatrics & Gerontology
International, 18 Suppl 1, 13–22.
Shimono, Y., Enomoto, H., Kishino, K., Moriwaki, E.-I.,
Nishikawa, H., Nishimura, T., Iwata, Y., Iijima, H., &
Nishiguchi, S., 2020. Arm Skeletal Muscle Mass Is
Associated With the Prognosis of Patients With
Cirrhosis. In Vivo (Athens, Greece), 34(3), 1165–1171.
Sims, S. T., Kubo, J., Desai, M., Bea, J., Beasley, J. M.,
Manson, J. E., Allison, M., Seguin, R. A., Chen, Z.,
Michael, Y. L., Sullivan, S. D., Beresford, S., &
Stefanick, M. L., 2013. Changes in physical activity and
body composition in postmenopausal women over time.
Medicine and Science in Sports and Exercise, 45(8),
1486–1492.
Skrzek, A., Ignasiak, Z., Kozieł, S., Sławińska, T., &
Rożek, K., 2012. Differences in muscle strength depend
Body Composition and Sarcopenia Indicator among Elderly in the Nursing Home
25

on age, gender and muscle functions. Isokinetics and
Exercise Science, 20, 229–235.
Strait, J. B., & Lakatta, E. G., 2012. Aging-associated
cardiovascular changes and their relationship to heart
failure. Heart Failure Clinics, 8(1), 143–164.
Sttraton, R. J., Green, C. J., & Elia, M., 2003. Disease-
Related Malnutrition: An EvidenceBased Approach to
Treatment. CABI Pub.
Tallis, J., James, R. S., & Seebacher, F., 2018. The effects
of obesity on skeletal muscle contractile function. The
Journal of Experimental Biology, 221(Pt 13).
Tieland, M., Trouwborst, I., & Clark, B. C., 2018. Skeletal
muscle performance and ageing. Journal of Cachexia,
Sarcopenia and Muscle, 9(1), 3–19.
Tuttle, L. J., Sinacore, D. R., & Mueller, M. J., 2012.
Intermuscular adipose tissue is muscle specific and
associated with poor functional performance. Journal
of Aging Research, 2012, 172957.
Vitriana, V., Defi, I. R., Irawan, G. N., & Setiabudiawan,
B., 2016. Prevalensi Sarkopenia pada Lansia di
Komunitas (Community Dwelling) berdasarkan Dua
Nilai Cut-off Parameter Diagnosis. Majalah
Kedokteran Bandung, 48(3), 164–170.
World Health Organization, 2018. Ageing and health.
https://www.who.int/news-room/fact-
sheets/detail/ageing-and-health
Zhao, X., Tsujimoto, T., Kim, B., Katayama, Y., & Tanaka,
K., 2018. Association of Foot Structure with the
Strength of Muscles that Move the Ankle and Physical
Performance. The Journal of Foot and Ankle Surgery :
Official Publication of the American College of Foot
and Ankle Surgeons, 57(6), 1143–1147.
ICSDH 2021 - International Conference on Social Determinants of Health
26
