
Driver’s Emotions Detection with Automotive Systems in Connected
and Autonomous Vehicles (CAVs)
B. Meza-García and N. Rodríguez-Ibáñez
Nextium by IDNEO Technologies S.A.U, Mollet del Vallès, Barcelona, Spain
Keywords: Emotional State, Facial Analysis, Emotions, Galvanic Skin Response (GSR), Photo Plethysmography (PPG),
Driver Monitoring System (DMS).
Abstract: The aim of this work is to evaluate selected systems in order to assess the emotional state of drivers based on
facial analysis and vital signs acquired from camera, galvanic skin response (GSR) and photo
plethysmography (PPG). Facial analysis and biomedical variables like galvanic skin response, which is related
to sympatho-vagal nervous system balance, provides direct information of the driver physiological state,
instead of indirect indicia of the participant's behavior. Facial and GSR data used in this study were recorded
by doing tests with subjects in different scenarios in order to evaluate selected commercial systems and their
limitations in controlled and real driving conditions. Results demonstrate that the emotional state of the driver
can be assessed by facial analysis in combination with GSR relative data.
1 INTRODUCTION
With the deployment of CAVs, there are many issues
to be analyzed in order to integrate them into our daily
lives. Almost all the aspects that are being tried to
improve are related to "technology feasibility" but,
realizing that are humans who interact with the
technology involved in CAVs, it is of special interest
to promote their acceptance and to see in which
emotional and cognitive state people are during the
processes of interaction with the vehicle.
On one side, user acceptance is highly related to
the level of safety the user feels when interacting with
a CAV (Kaur, 2018) but, at the same time, being
comfortable and not experiencing certain emotional
states, such as stress, leads to an increase in driving
safety (Cai, 2007) (Jones, 2005). This is why the
human factor is so important in the deployment and
advancement of CAVs, as the only way for them to
have a positive impact is also to consider user
requirements when creating the passenger experience
(Eyben, 2010). To improve the passenger experience
and ensure passenger safety during autonomous
driving, it is essential to be able to anticipate the
interactions that the passenger will have with the
vehicle, and this would not be possible without
knowing what emotions the passenger is presenting at
the time of the interaction.
It is known in literature that emotions are complex
and are a combination of physical and cognitive
factors. The physical aspect is also referred to as
bodily or primary emotions, while the cognitive
aspect is referred to as mental emotions (Holzapfel,
2002).
In reference to bodily factors, one of the most
common methods to evaluate the subject is by facial
analysis. There are currently many systems on the
market that promise to monitor the driver to
determine what state she/he is in, as well as the
driver's emotions (Nass, 2005). Most of these systems
are based on blinking or PERCLOS (percentage of
eye closure) (Sahayadhas, 2012), although the current
ones analyse new variables of the face and have even
introduced some based on the subject's movements.
The advantage of these systems is their low
invasiveness (Mittal, 2016) since the analysis is
usually performed using cameras. The main
drawback is that high reliability rates decrease
considerably when the systems are used in real
environments often due to lighting conditions or
vibrations (Sayette, 2001; Cohn, 2007; Vural, 2007).
Regarding the cognitive factors of the emotional
state, many studies reveal that some indicators, such
as arousal, engagement and valence, can be estimated
by physiological methods (GSR, others)
(blog.affectiva.com).
Arousal is a medical term used to describe a
general physiological and psychological activation of
the organism, which varies in a continuous that goes
from deep sleep to intense excitation (Gould, 1992).
258
Meza-García, B. and Rodríguez-Ibáñez, N.
Driver’s Emotions Detection with Automotive Systems in Connected and Autonomous Vehicles (CAVs).
DOI: 10.5220/0010741100003060
In Proceedings of the 5th International Conference on Computer-Human Interaction Research and Applications (CHIRA 2021), pages 258-265
ISBN: 978-989-758-538-8; ISSN: 2184-3244
Copyright
c
2021 by SCITEPRESS – Science and Technology Publications, Lda. All rights reserved
Valence (blog.affectiva.com) is a measure of the
positive or negative nature of the recorded person’s
experience. Engagement is defined as a measure of
facial muscle activation that illustrates the subject’s
expressiveness (blog.affectiva.com) (Teixeira, 2010).
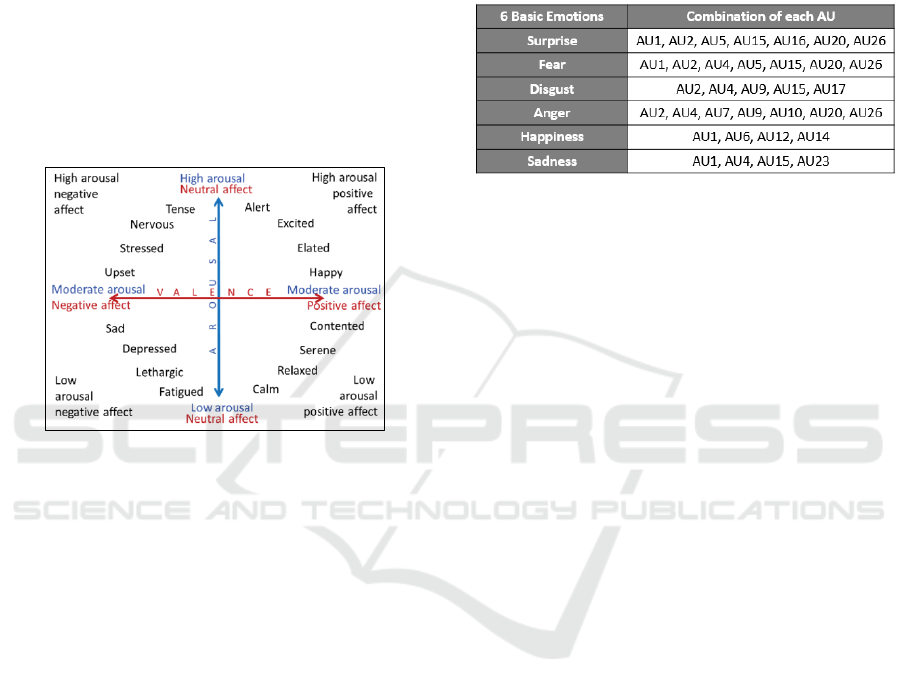
As you can see in Figure 1, Psychologists usually
consider emotions at a valence/ arousal plane
(Bradley, 1992) but is still an ongoing discussion
about this approach (Kołodziej, 2015). In practice, it
is very difficult to distinguish between some mental
states, for example sleepy and tired or calm and
relaxed. A relevant point is that emotions and their
associated physiological responses are very difficult
to fake (blog.affectiva.com), as they are produced
unconsciously.
Figure 1: The valence/arousal plane (Bradley, 1992).
The purpose of the research exposed in this article
is to detect the emotions presented by users through
facial analysis and GSR in static conditions, allowing
to benchmark commercial systems available for the
automotive sector and, subsequently, to validate if
they are able to provide an accurate detection of the
user's emotions while driving.
It is expected that the combination of facial and
physiological analysis will make an improvement of
the results, giving more robustness to the assessment
of the driver state.
2 MATERIALS AND METHODS
2.1 Facial Analysis
The Facial Action Coding System (FACS) is the most
comprehensive and widely used taxonomy for
characterizing facial behavior (Ekman, 1978) (Brave,
2003). FACS is an extremely useful tool as it enables
objective, quantitative analysis and has proven useful
in the behavioral sciences for discovering facial
movements typical of cognitive and affective states.
The FACS system describes facial expressions in
46 Action Units (AUs), which correspond to
individual facial muscle movements and, by
combining them, we can obtain the six basic emotions
(Ekman, 1978), as can be seen in Table 1.
Table 1: Six basic emotions, decomposition in AUs
(Ekman, 1978).
Regarding one of the tested commercial systems,
iMotions, it uses Affectiva SW for facial analysis, as
explained bellow:
As a first step, face detection is done by the Viola-
Jones method (McDuff, 2016) (Viola, 2001). Thirty-
four facial landmarks are detected using a supervised
descent based land mark detector, similar to that
presented by Xiong and De la Torre (Xiong, 2013),
applied to the cropped face region. As you can see in
Figure 2, a defined image region of interest (ROI) is
segmented using the facial landmarks. The ROI
includes the eyes, eyebrows, nose and mouth. The
ROI is normalized using rotation and scaling to 96x96
pixels. In order to capture textural changes of the face
histograms of oriented gradients (HOG) features are
extracted from the image ROI. The HOG features are
extracted from 32 x 32 pixel blocks (cell-size 8 x 8
pixels) with a stride of 16 pixels. A histogram with 6
bins is used for each block. This results in a feature
vector of length 2,400 (25*16*6).
After all these steps, support vector machine
(SVM) classifiers are used to detect the presence of
each facial action (Senechal, 2015). For each facial
action a baseline appearance is estimated using a
rolling 30-second window in order to account for
differences in neutral appearance. The facial action
classifiers return a confidence score from 0 to 100.
The software provides scores for 18 facial actions
(McDuff, 2016).
One of the major limits of facial analysis systems
are the robustness in the presence of occlusions or
artefacts. A typical case with detection problems is
when the user wears glasses. We can see in the Figure
2 that Affectiva SW is able to make a good detection
in that case, as it is able to still detect all the fiducial
points.
Regarding the limitations related to psychological
detection, facial systems can not measure the
Driver’s Emotions Detection with Automotive Systems in Connected and Autonomous Vehicles (CAVs)
259

associated arousal, which leads to an incomplete
estimation of the level of activation of the organism.
Another relevant point is that there are differences
regarding emotion expression between cultures and
the related facial expressions (Dailey, 2002).
Figure 2: Facial landmarks.
2.2 GSR and PPG
One of the most sensitive measures for emotional
arousal is Galvanic Skin Response (GSR), also
referred to as Electrodermal Activity (EDA) or Skin
Conductance (SC). GSR originates from the
autonomic activation of sweat glands in the skin
(Bach, 2009). The sweating on hands and feet is
triggered by emotional stimulation: Whenever we are
emotionally aroused, the GSR data shows distinctive
patterns that can be visually appreciated and that can
be quantified statistically (measurable electrodermal
activity).
Skin conductivity is solely modulated by
autonomic sympathetic activity that drives bodily
processes, cognitive and emotional states as well as
cognition on an entirely subconscious level. We
simply cannot consciously control the level of skin
conductivity. Exactly this circumstance renders GSR
the perfect marker for emotional arousal as it offers
undiluted insights into physiological and
psychological processes of a person.
GSR responses will be observed due to almost
any stimulus in a person's environment, so multiple
stimuli in quick succession will be superimposed in
the GSR signal so that individual spikes may not be
distinguishable without applying signal processing
methods to separate them.
In the tests, the main function of the GSR+ Unit
is to measure the GSR, between two reusable
electrodes attached to two fingers of one hand.
There are variations in the "baseline" skin
conductance value due to factors like temperature
(which causes the body to sweat more or less for
thermoregulation), dryness of the skin (dry skin is a
bad conductor) and other physiological factors which
differ from person to person.
The signal measured by the Shimmer Optical
Pulse Sensor is a photoplethysmogram (PPG).
Photoplethysmography (PPG) is an optical technique
that is used to detect blood volume changes in the
microvascular bed of tissue, used to make
measurements at the skin surface. In order to convert
the PPG signal to an estimate of heart rate (HR), the
individual pulses must be identified from the PPG
signal and the time between successive pulses
measured. There are many algorithms for conversion
of PPG to HR available in the published literature;
some examples can be found in (Bach, 2009) (Fu,
2008) (Shin, 2009). The ear-lobe is the recommended
location from which to measure PPG because motion
artifact tends to be minimal, reducing noise and
variability in the skin-sensor interface and because
there is no muscle activity causing interference with
the blood flow in the ear-lobe. The sensor should be
attached to the lower part of the soft tissue of the ear-
lobe.
2.3 Subjects
A group of 25 volunteers (50% men and 50% women)
with ages between 18 and 60, took part in the study.
The experiments were performed in three sessions
each in different days. Participants did not have
diseases related to lack of mobility or facial
expression and, in any case, they did not ingest highly
exciting substances or that could cause changes in
facial expression (antihistamines, alcohol, etc.)
The subjects were monitored through cameras and
biometric sensors. All signals were synchronized by
iMotions system.
2.4 Systems and Registered Values
The experiments were conducted in the facilities of
IDNEO Technologies with controlled conditions,
different for each test. All experimental sessions were
performed with the same environment for each kind
of test and a stable temperature around 23ºC-25ºC and
ambient light conditions.
Registered values were facial gestures parameters
(video and csv data) as well as GSR and PPG relative
information.
The galvanic skin response data was collected
with a Shimmer3 GSR+ device (Shimmer Sensing,
Dublin, Ireland).
Regarding Affectiva, facial expressions were
coded using the AFFDEX SDK 4.0 (Affectiva Inc.,
Waltham, USA) that is integrated in the iMotions
system.
SUaaVE 2021 - Special Session on Research Trends to Enhance the Acceptance of Automated Vehicles
260

2.5 Procedure
The test was designed with the objective of
benchmarking the facial analysis systems selected
from those available on the market. In addition, the
GSR and PPG signal was used to provide complete
information so that, by combining them, it was
possible to determine the emotions presented by the
user.
2.5.1 Test Definition: Emotions Detection
On this paper we will analyze the results after
processing database of designed static test.
The specific objective of static trials is to test the
iMotions system, which works with Affectiva SW,
mainly the features related to emotion detection. To
reach that, facial analysis combined with GSR and
PPG signals were acquired.
• Test protocol
Subjects were asked to watch a video for 10
minutes, specially designed to evoke emotions. As
can be seen in figure 3, this video was varied in
content, so that the subject could express different
emotions during the visualization. While the test were
performed, data was collected using the mentioned
systems.
Figure 3: Images of the different snippets of the video and
emotions that evokes.
3 RESULTS
3.1 Galvanic Skin Response (GSR)
Analysis
3.1.1 GSR Temporal Evolution
We can see in Figure 4 the evolution of the GSR for
two subjects for each sample, which corresponds to
time, since the sampling frequency was 1
sample/second. The upper graph shows the GSR
responses for two subjects who react differently to
external stimuli, i.e., they are two subjects with very
different emotional profiles. To show the signals, the
raw data of the most emotional subject has been
divided by 10 in order to have a comparative
visualization between them both, due to the great
difference in the intensity of the response of their
respective emotions to the stimuli.
Figure 4: GSR representation of two different emotional
profiles. In the top graph, subject with high emotional
profile and in the bottom graph, subject with low emotional
profile. X axis= samples.
As can be seen in Figure 4, the person in the upper
graph, regardless of the emotion that is showing
(which we will see in the next section) presents an
intense and relatively constant GSR including several
spikes that can be misunderstood as bad quality
signal, which leads us to conclude that this subject has
a highly emotional profile. The presence of spikes
shows that reactions are quite immediate to different
types of stimuli.
In the case of the graph below, the analyzed
subject presents a relatively constant galvanic
response with isolated spikes, showing a low intensity
response, which leads us to conclude that the subject
has a low emotional profile. The isolated presence of
spikes means that reactions are, in this case, less
immediate to different types of stimuli.
3.1.2 GSR Comparison for Different
Emotional Profiles
Figure 5: GSR activity comparison for different emotional
profiles. In blue, starting time of input. In orange, GSR of a
low emotional profile subject. In grey, GSR of a high
emotional profile subject.
Driver’s Emotions Detection with Automotive Systems in Connected and Autonomous Vehicles (CAVs)
261
We can see in Figure 5 the comparative response of
the two selected subjects. We can see how their
galvanic responses are associated with external
stimuli (video that evokes emotions) and how, in turn,
all GSR signal of the subject who shows more
emotionality has higher values than the subject
considered as less emotional. It is also observed that
the emotional subject presents a process of
understanding until the video reaches the point of
maximum evocation of emotion, which corresponds
to the peak in the GSR signal. The graphic also shows
the evocked emotions in the video, corresponding to
each peak in the GSR signal. Analyzing the results we
can see GSR is a signal of fast response to the
stimulus, but of slow recovery. That means that the
process of return to the basal state is slow, with which,
the tendency is that this signal increases throughout
the test, and does not return to the basal state of the
subject, because there is a constant chaining of
events. The analysis indicate that GSR signal has high
hysteresis cycle.
3.2 Emotional Evolution based on GSR
and Facial Analysis
In this section, we will analyze the GSR signal as well
as the emotions. In the next graphs, it can be seen that
the GSR is directly related to emotional arousal,
which means how much intensity an emotion evokes
on a particular subject (e.g. emotional intensity per
clip). However, people can be aroused if they are
joyful as well and angry. That leads to the assumption
that arousal by itself is not enough to describe the
emotional state of a subject. Adding the facial
expressions to the analysis, we can calculate the
valence, to deduce if their face is showing more
positive or negative emotions.
Figure 6: High emotional profile results (GSR + facial
analysis).
In the complete representations, we will observe
what was positive and very arousing (e.g. joyful,
comedic) in comparison to what was positive
generally but not really emotionally arousing (e.g.
calming, pleasant) or what was negative and arousing
(e.g. anger-inducing, disgusting), etc.
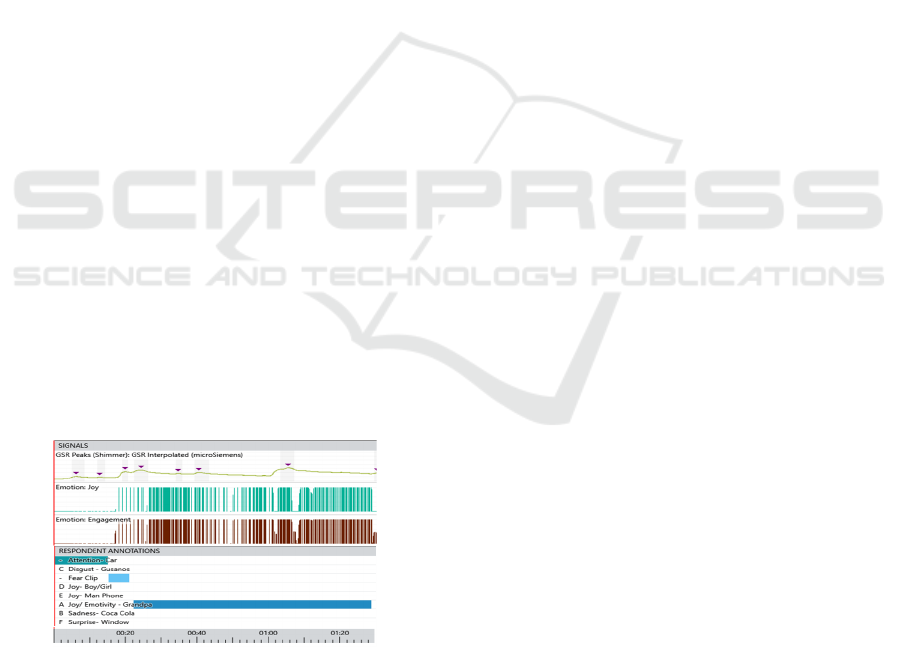
3.2.1 Subject with High Emotional Profile
Results
In figure 6 and 7 we are essentially analyzing two
different variables: emotional arousal with the GSR,
and overt expressions of emotions with Affectiva.
In all the test, this subject was engaged and with
a positive attitude.
In the sad part of the video, this subject didn’t
present any facial expression but valence was
negative, that can be traduced as the subject felt
negative emotions toward this part of the video.
In the disgusting part of the video, this subject also
presented this emotion due to the uncomfortability and
unbelievability towards the video. This was also
observed in other subjects of the trial.
The disgust and surprise during the disgust video
also makes sense. However, some of the facial
expressions that make up surprise are similar to those
with joy, so that may be where the confusion comes
in (each emotions is calculated separately, so
correlating emotions in some cases can be obtained).
The GSR graph is coherent with facial analysis at
this point, as the disgust and the window scenes
should induce more of one emotional response, that
can continue over the duration of the clip.
The window scene particularly might not produce
a facial expression because, although some parts
might be surprising, it's a long enough clip for the
reaction to be manteined.
This subject, despite being highly emotional, did
not show any emotion to the sadness clip, as no
changes in galvanic skin response or facial expression
are appreciated for this part of the trial. In general,
results are coherent with the visual analysis of the
video record of the face.
3.2.2 Subject with Low Emotional Profile
Results
This subject's level of engagement has been very low
in general for the whole trial, as well as the expression
of Joy. During the whole trial, results show disgust
emotion present for this subject, but with low
intensity. Therefore, the valence is around zero in
most of the trial, except for the part in which the
subject has shown more emotionality, specifically Joy
for the part of the video of the joke, in which valence
has been positive and it matches with a high
engagement presented. Another relevant part of the
trial was the window part, where the subject presented
higher peaks in GSR, showing negative valence and
SUaaVE 2021 - Special Session on Research Trends to Enhance the Acceptance of Automated Vehicles
262
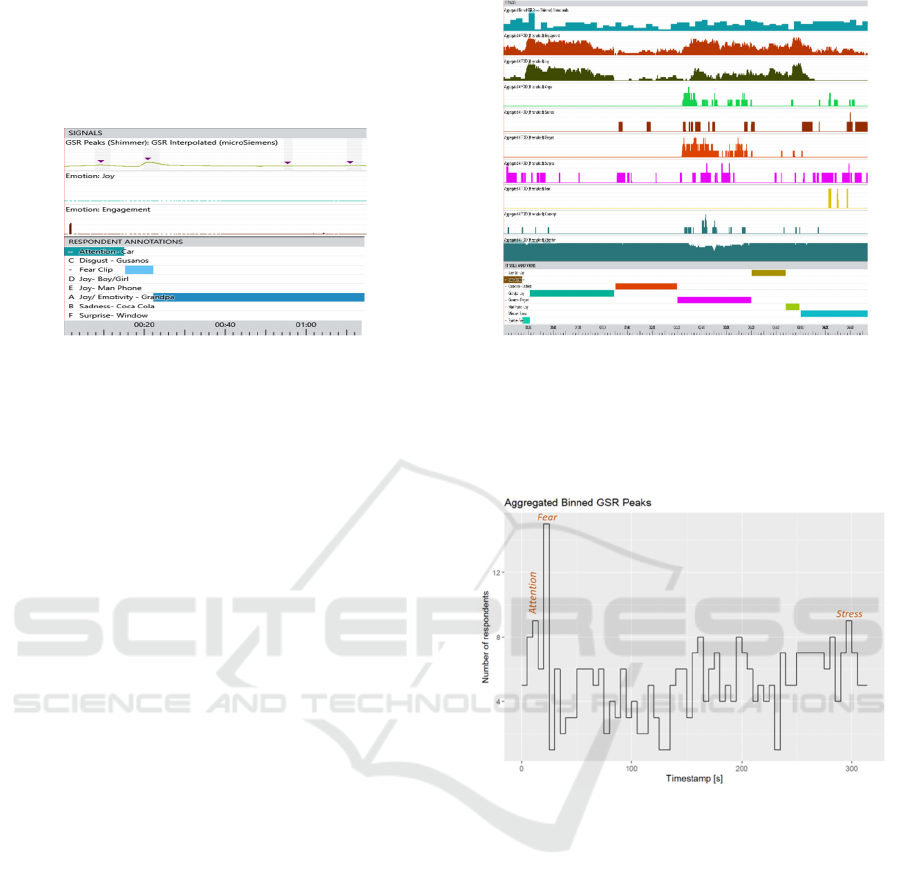
certain other emotions, such as sadness. In summary,
the most impactful videos for this subject were the
Joy/joke video and the window video. Results are
coherent with the visual analysis of the video record
of the face.
Figure 7: Low emotional profile results (GSR + facial
analysis).
3.2.3 General Results
Throughout the test, as we can see in Figure 8,
presence of peaks in the GSR are observed and a high
level of engagement. As it can be seen in the test
results, the defined tests were able to evoke emotions
in users, causing changes in the galvanic response and
their facial expressions. All subjects have been
attentive during the test, except for two exceptions:
the part where the zombie appears and the disgusting
part of the video, where people had to look away
because of the scare/disgust caused, leading the
attention indicator to drop. In general, we see that the
videos have provoked positive emotions to the users,
like Joy, with the exception of the disgust and the
window clip. Disgust emotion is clearly seen in the
disgust video and, but also in the laughter clip there
has been presence of disgust due to its scatological
content. As for fear, it is interesting, since we can see
it associated with the fear provoked by a situation of
real danger, which can be related to stress, and not to
a punctual or unreal scaring scene. This point is very
valuable for estimating the user's emotional state in
situations that could occur in a real vehicle.
Regarding the surprise factor, although it is a very
particular indicator for each person, surprise is related
to positive valence for videos that evoke emotions
such as joy or similar, while surprise with negative
valence is related to disgust or similar (Remington,
2000).
In the case of anger, we see that it has been
crossed with the expressions of disgust of the users
due to the video of the worms. As for sadness, we see
that it occurs in the video labeled sadness, but we also
see it in the video of disgust and the video in the
window, since the facial expressions could be similar.
Figure 8: General results (GSR + facial analysis).
3.3 Objective Quantification of the
Impact on the GSR Related to the
External Stimulus
Figure 9: General results. GSR Peaks.
Figure 9 shows the discrete GSR peaks counted
for all the users’ data. As it can be seen in the general
results graph, there is no part of the trial without
presence of GSR spikes. The discrete graph that
relates the number of subjects that presented peaks in
each second of the video shows that the video has
been a good tool to evoke emotions to evaluate them
a posteriori. The fact that the number of subjects
reacting over time is not stable is an indicator that
each person reacts differently to external stimuli.
Moreover, analyzing in which parts of the test more
than half of the subjects have presented peaks in their
galvanic responses leads us to conclude which parts
of the video have been more impressive at a general
level, and which parts have been less.
The average of peaks per minute of the GSR data
has been calculated comparing the relative emotional
activation across each scene. The interpretation is that
Driver’s Emotions Detection with Automotive Systems in Connected and Autonomous Vehicles (CAVs)
263
the higher the number of peaks per minute, the higher
was the emotional activation per scene, regardless of
whether this activation is negative or positive in terms
of valence.
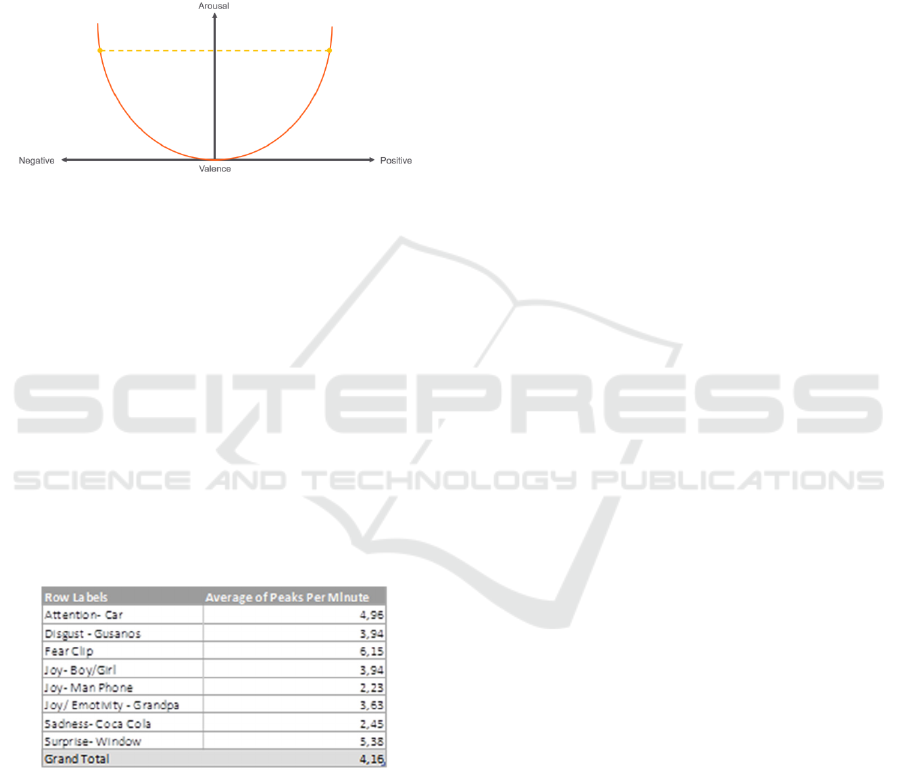
GSR can be understood as a general measure of
emotional activity, whilst the facial expression is a
measure of valence (positive or negative), so the
combination of both can be explained as a circumplex
figure, as can be seen in Figure 10.
Figure 10: Circumplex Arousal/Valence.
Peaks per minute that we can see in the GSR
signal give us information about the frequency of the
significant emotional responses in that time period,
which can be correlated with the magnitude of the
emotion that the subject has felt. We see that the
higher the amplitude of the GSR peak, the longer the
recovery time to the basal state, so when we calculate
the number of peaks that exceed the threshold set in
the analysis, this number will be higher. Since this
experiment has been designed for the detection of
strong emotions, the threshold has been set at half of
the possible maximum emotionality that a person can
reach, therefore, our threshold, in this case, is th=50.
Table 2: Average of peaks per minute – GSR.
As can be seen in Table 2, the ranking of the three
emotions that have had the highest GSR are: fear,
stress and, in last place, attention. The most
interesting in this analysis is to see how the attention
video, from which we expected a basal galvanic
response, was one of those that obtained higher
number of peaks. After analyzing the data in detail,
we have deduced that this effect is due to the fact that
this video is the first of the trial, which can be
considered as a white coat effect (Pickering, 2002),
similar to the one we obtain when we monitor a
patient in a medical environment and is due to the
nerves/expectation that the subject suffers due to the
uncertainty of the moment. In fourth position is the
video related to disgust, whose visual impact we
consider to be the highest, but due to the fact that most
of the subjects looked away, the GSR was not as
intense as expected.
4 CONCLUSIONS
Results demonstrate the viability of emotions
detection by using a combination of facial analysis
and GSR methods, with a subsequent increase of
robustness in the detection.
Obtained results also show an increase of the
galvanic skin response when a new emotion is being
evoke by meanings of visual stimuli.
The combination of Affectiva and Shimmer
devices can estimate the emotional state of the driver,
detecting facial parameters as well as deciding which
of the basic emotions is the user presenting in real
time. In addition, it allows to extract PPG giving
relevant information related to HR.
The evaluated systems are a good option to give
an adequate estimation of the emotional state of the
driver and that could lead to an improvement of the
passenger experience in the car and an increase of the
acceptance of CAVs.
Short-term further work will be the analysis of
new dynamic conditions tests to know the limitations
of the systems and to analyse them in real conditions.
Mid-term further work will be to analyse data
obtained by PPG in order to extract the HR of each
subject that is supposed to give an added value when
estimating the emotions. Moreover, a comparison
between women and men reactions to baby-related
stimuli will be made. Finally, as a future work, it
would be useful a combination of both systems to take
decisions in moments when one of the systems have
problems in the detection or decision-taking.
ACKNOWLEDGEMENTS
This work and procedures have been funded by the
European Union’s Horizon 2020 Research and
Innovation Programme in the project SUaaVE
(Supporting acceptance of automated Vehicle) under
Grant Agreement No 814999.
SUaaVE 2021 - Special Session on Research Trends to Enhance the Acceptance of Automated Vehicles
264

REFERENCES
Kaur, K., Rampersad, G. (2018) Trust in driverless cars:
Investigating key factors influencing the adoption of
driverless cars, Journal of Engineering and Technology
Management, Volume 48, Pages 87-96, ISSN 0923-
4748
Cai, H., Lin, Y., Mourant, R. (2007). Study on driver
emotion in driver-vehicle-environment systems using
multiple networked driving simulators. DSC North
America – Iowa City – September North America –
Iowa City – September.
Jones, C., Jonsson, I. (2005). Automatic recognition of
affective cues in the speech of car drivers to allow
appropriate responses. 10.1145/1108368.1108397.
Eyben, F., Wöllmer, M., Poitschke, T., Schuller, B.,
Blaschke, C., Faerber, B., Nguyen-Thien, N. (2010).
Emotion on the Road—Necessity, Acceptance, and
Feasibility of Affective Computing in the Car. Adv.
Human-Computer Interaction. 2010.
10.1155/2010/263593.
Holzapfel, H., Denecke, M., Fuegen, C., Waibel, A. (2002)
Integrating Emotional Cues into a Framework for
Dialogue Management. Fourth IEEE International
Conference on Multimodal Interfaces (ICMI'02)
October 14 – 16.
Nass, C., Jonsson, I. M., Harris, H., Reaves, B., Endo, J.,
Brave, S., Takayama, L. (2005, April). Improving
automotive safety by pairing driver emotion and car
voice emotion. In CHI'05 Extended Abstracts on
Human Factors in Computing Systems (pp. 1973-
1976). ACM.
Sahayadhas, A., Sundaraj, K., Murugappan, M. (2012).
Detecting driver drowsiness based on sensors: a review.
Sensors, 12(12), 16937-16953.
Mittal, A., Kumar, K., Dhamija, S., Kaur, M. (2016,
March). Head movement-based driver drowsiness
detection: A review of state-of-art techniques. In
Engineering and Technology (ICETECH), 2016 IEEE
International Conference on (pp. 903-908). IEEE.
Sayette, M.A., Cohn, J. W. J. (2001) A psychometric
evaluation of the facial action coding system for
assessing spontaneous expression.
Cohn, JF., Reed, (2007). Impact of depression on response
to comedy: a dynamic facial coding analysis.
Vural, E., Cetin, M., A. E. G. L. M. B. J. M. (2007). Drowsy
Driver Detection through Facial Movement Analysis.
10.1007/978-3-540-75773-32.
blog.affectiva.com
Gould, D., Krane, V. (1992). «The arousal-athletic
performance relationship: current status and future
directions.». En Horn, T.: 'Advances in sport
psychology, ed. Champaign: Human Kinetics'. pp. 119-
141.
Teixeira, T., Wedel, M., Pieters, R. (2010). Emotion-
induced engagement in internet video ads. Journal of
Marketing Research.
Bradley, M., Greenwald, M. K., Petry, M. C., Lang, P. J.
(1992). “Remembering pictures: pleasure and arousal in
memory,” Journal of Experimental Psychology:
Learning, Memory, and Cognition, vol. 18, no. 2, 1992,
pp. 379-390.
Kołodziej, M., Majkowski, A., Rak, R. (2015). Recognition
of visually induced emotions based on
electroencephalography.
Ekman, P., Friesen, W. (1978). "Facial Action Coding
System: A technique for the measurement of facial
movements." Consulting Psychologist.
Brave, S., Nass, C. (2003). "Emotion in human– computer
interaction." Human-Computer Interaction: 53.
McDuff, D., Mahmoud, A., Mavadati, M., Amr, M., Turcot,
J., Kaliouby. R. (2016). Affdex sdk: A cross-platform
real-time multi-face expression recognition toolkit. In
Proceedings of the 2016 CHI Conference Extended
Abstracts on Human Factors in Computing Systems,
pages 3723–3726. ACM, 2016.
Viola, P., Jones. M. (2001). Rapid object detection using a
boosted cascade of simple features. In Computer Vision
and Pattern Recognition, 2001. Proceedings of the
IEEE Computer Society Conference on, volume 1,
pages I–511. IEEE.
Xiong, X., De la Torre, F. (2013). Supervised descent
method and its applications to face alignment. In
Computer Vision and Pattern Recognition (CVPR),
2013 IEEE Conference on, pages 532–539. IEEE.
Senechal, T., McDuff, D., Kaliouby, R. (2015). Facial
action unit detection using active learning and an
efficient non-linear kernel approximation. In
Proceedings of the IEEE International Conference on
Computer Vision Workshops, pages 10–18.
Dailey, M., Lyons, M., Kamachi, M., Ishi, H., Gyoba, J.,
Cottrell, G. (2002). Cultural Differences in Facial
Expression Classification. Proc. Cognitive
Neuroscience Society, 9th Annual Meeting, San
Francisco CA. 153.
Bach, D. R., Flandin, G., Friston, K. J., Dolan, R. J. (2009).
Time-series analysis for rapid eventrelated skin
conductance responses. Journal of Neuroscience
Methods, 184, 22
Fu, T.-H., Liu, S.-H., Tang, K.-T. (2008). Heart Rate
Extraction from Plotopletyhsmogram Waverform
Using Wavelet Multi-resoultion Analysis. Journal of
Medical and Biological Engineering, 28(4), 229 - 232.
Shin, H. S., Lee, C., Lee, M. (2009). Adaptive treshold
method for the peak detection of
photoplethysmographic waveform. Computers in
Biology and Medicine, 39, 1145 – 1152
Remington, N. A.; Fabrigar, L. R.; Visser, P. S. (2000).
"Re-examining the circumplex model of affect".
Journal of Personality and Social Psychology. 79 (2):
286–300. doi:10.1037/0022-3514.79.2.286. PMID
10948981.
Pickering, T.G., Gerin, W., Schwartz, A.R. (2002). What is
the white-coat effect and how should it be measured?
Blood Press Monit. 2002 Dec;7(6):293-300. doi:
10.1097/00126097-200212000-00001. PMID:
12488648
Driver’s Emotions Detection with Automotive Systems in Connected and Autonomous Vehicles (CAVs)
265
