
Parametric Adaptation of Data the Software and Hardware System of
Electrical Consumption Management
Oleg Kivchun
1 a
, Viktor Gnatyuk
2 b
and Dmitry Morozov
3
1
Department of Telecommunications of the Institute Physical and Mathematical Sciences and Information Technologies,
Baltic Federal University I. Kant, 14, ul. Nevsky, Kaliningrad, Russian Federation
2
Department of Electrical Equipment of Vessels and Electric Power Industry, Kaliningrad State Technical University, 1,
Sovetskiy Prospect, Kaliningrad, Russian Federation
3
General Director of Hermes LLC, 3, Shillera St., Kaliningrad, Russian Federation
Keywords: Parametric adaptation of data, Software and hardware system, Rank analysis, Electrical consumption
management, Verification, Automated workplace, Forecasting.
Abstract: The article considers the software implementation of parametric adaptation of data on the electrical
consumption of objects based on rank analysis, which allows creating scientific and methodological
prerequisites for ensuring reliable data storage, cleaning, formatting, verification, smoothing and primary
statistical processing, and determining the reference data layer with the greatest predictive abilities on the
basis of integral indicators. The procedure of parametric data adaptation is implemented in the subsystem of
the software and hardware system of electrical consumption management of the regional electrotechnical
system in the form of an automated workplace.
1 INTRODUCTION
At the moment, significant changes are taking place
in the world community in the field of information
technology development. The main directions of
their implementation are business structures, state
institutions, research enterprises, etc. In the writings
of many scientists, it is stated that a new
technological order, with the use of new information
technologies, has taken place. Software and
hardware solutions based on artificial intelligence,
expert decision support systems, and Internet of
Things technologies are already able to replace a
person in certain areas. Investments in such projects
have become very popular and will continue.
0
In Russia, a large number of investment projects
are being implemented in the electric energy sector.
They are aimed at the development and
implementation of situational centers and software
and hardware system (SHS) for managing energy
resources and electric grid modes. Any electric
energy company has a large number of information
a0
https://orcid.org/0000-0002-7054-202X
b
https://orcid.org/0000-0001-5558-9439
and analytical systems and another system that
process huge amounts of data. In addition, the data is
stored in various formats and databases, access to
which is not always allowed. In this regard, there is
a difficult task associated with their high-quality
processing, cleaning and verification.
2 MANUSCRIPT PREPARATION
A team of authors of the Kaliningrad Scientific School
under the leadership of Professor V. I. Gnatyuk
(Gnatyuk, V.I., Kivchun, O.R., Lutsenko, D.V., 2020)
has developed (SHS) electrical consumption
management of the regional electrical complex (Fig.
1).
The interface and automated workstations (AW)
SHS are written in C# in the Visual Studio software
environment. SHS includes subsystems for
parametric adaptation, forecasting and normalization
of data on electrical consumption. The article will
consider in detail the subsystem of parametric
adaptation of data. Its basis is an algorithm for
cleaning, checking and verifying data on electrical
Kivchun, O., Gnatyuk, V. and Morozov, D.
Parametric Adaptation of Data the Software and Hardware System of Electrical Consumption Management.
In Proceedings of the II International Scientific and Practical Conference "Information Technologies and Intelligent Decision Making Systems" (ITIDMS-II 2021), pages 9-12
ISBN: 978-989-758-541-8
Copyright
c
2022 by SCITEPRESS – Science and Technology Publications, Lda. All rights reserved
9
consumption, which is programmatically executed in
the form of AW (Fig. 2).
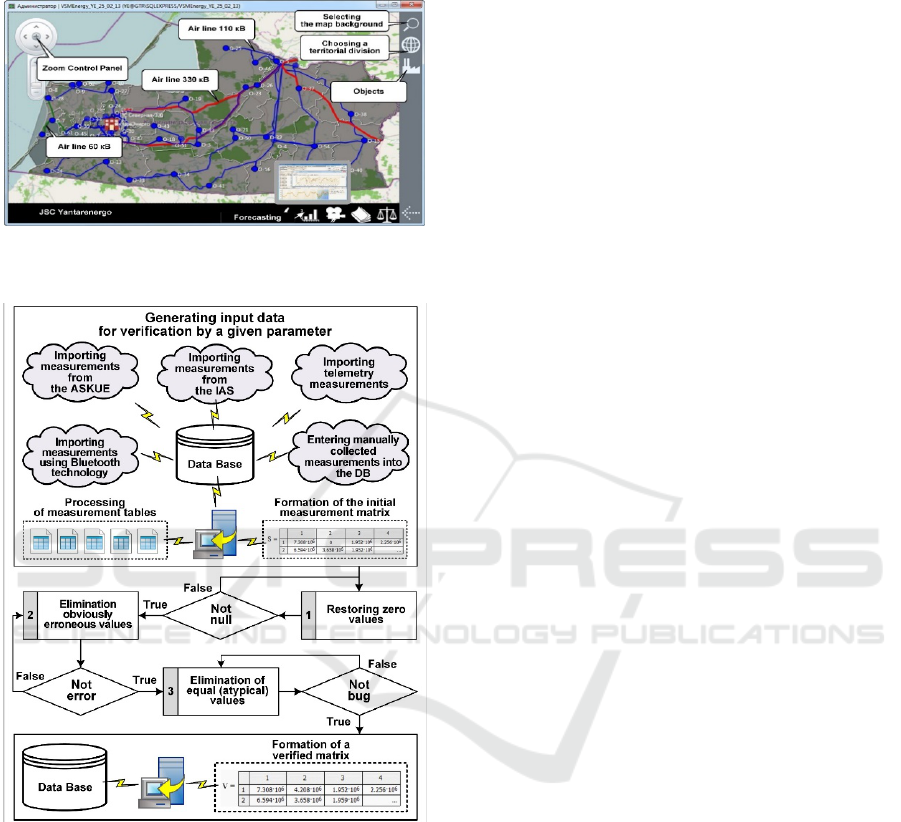
Figure 1: The main stage of the hardware and software
complex.
Figure 2: Algorithm for cleaning, checking and verifying
data on electrical consumption.
At the first stage of the algorithm, a matrix of
initial – "raw" data on electric power consumption is
formed. It includes data imported from automated
systems for monitoring and accounting of electrical,
information and analytical systems, telemetry
systems and collected manually.
3 RESULTS AND DISCUSSION
Data processing was carried out on the basis of the
methodology of rank analysis [4]. Therefore, the
"raw" data is presented in the form of a rank
parametric distribution, the values in which are
ranked from a larger value to a smaller one. Then
this distribution is approximated (Gnatyuk, V.I.,
Polevoy, S.A., Kivchun, O.R., Lutsenko, D.V.,
2019).
Analytically, the raw data is represented by the
following expression:
nn
kk1 kk1
f:W R Approx
[{W } {R } ] W f (x),
(1)
where
n
1
k
k
}W{
–
set of electrical consumption
values;
n
1
k
k
}R{
– set of topological ranks;
W(x) – approximation function of the
rank
p
arametric distribution;
x
–
rank topological measure.
At the second stage of the algorithm, the data on
electrical consumption is verified. This procedure
includes the search and elimination of zero, equal
and obviously erroneous data. The recovery of null
data is carried out using spline interpolation and the
method of numerical extrapolation. The spline
interpolation procedure is the process of determining
the functional dependence that best describes the
empirical data. This problem is solved in the model
by using quadratic or cubic splines. After the
implementation of these procedures, a matrix of
verified values is formed, which is imported into the
electrical consumption database.
It should be recalled that the database according
to (1) already contains "raw" and approximation
data. Therefore, at the next stage, an algorithm for
parametric data adaptation is implemented, which
allows you to select the highest quality values for
further processing. Figure 3 shows the algorithm of
this procedure.
At the first stage of the algorithm, data is
imported for verification, which includes three
matrices of data on electrical consumption for five
years: "raw", approximation and verified data. The
practical implementation of this procedure was
carried out on the basis of data on the electrical
consumption of large consumers of the Kaliningrad
region from 2015 to 2020. The year 2020 was
reserved as the verification vector, and the data from
2015 to 2019 were used for calculations (Gnatyuk,
V.I., Kivchun, O.R., Lutsenko, D.V., 2020).
Based on the data contained in the three matrices,
the forecast for 2020 was carried out. A
technocenological method with a fixed first point was
used for forecasting (Kivchun, O.R., 2021). After
ITIDMS-II 2021 - II International Scientific and Practical Conference "Information Technologies and Intelligent Decision Making Systems"
10
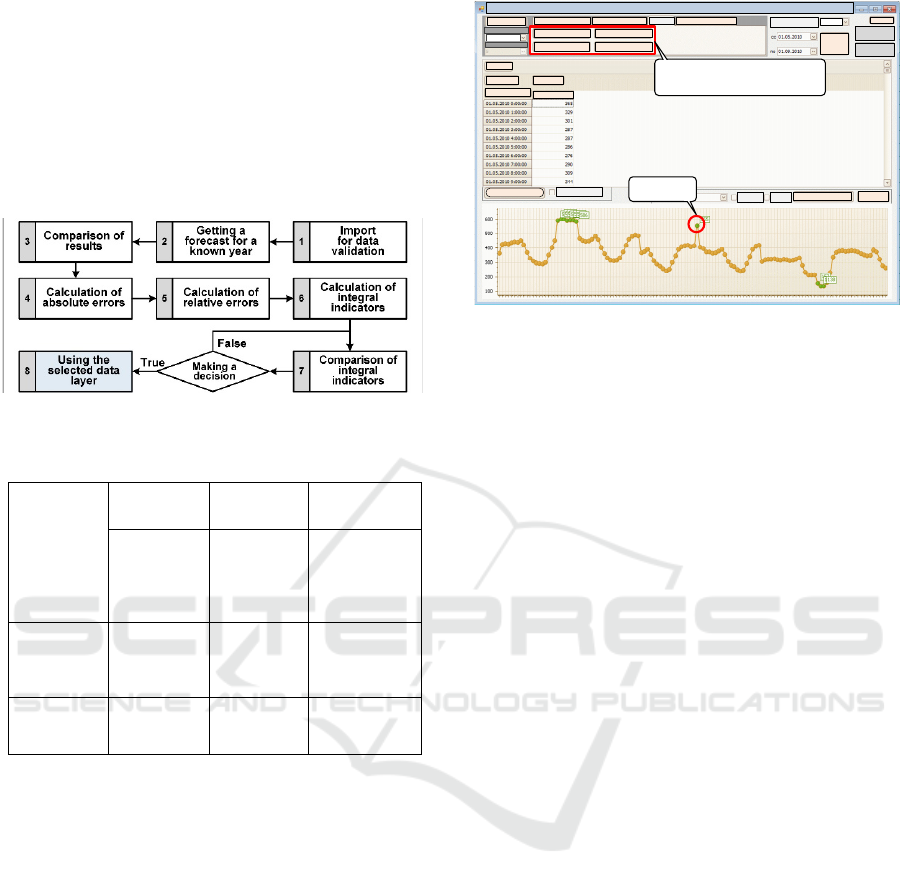
receiving the results, the obtained forecast values are
compared with the verification vector – with data on
electrical consumption for 2020. To do this, the
absolute and relative forecast errors are calculated. At
the next stage, based on the analysis of integral
indicators of forecast errors, a decision is made on the
choice of a data layer for electrical consumption.
Table 1 shows the results of calculating forecast
errors.
Figure 3: Data layer selection algorithm.
Table 1: Results of calculation of forecast errors.
Error name
“Raw” data
Verified
data
Appro-
ximation data
Forecasting
by
the method
with a fixed
first poin
t
Forecasting
by the
method
with a fixed
first poin
t
Forecasting
by the
method with
a fixed first
poin
t
Maximum
absolute
error, kWh
10
8
2.7 2.4 3.9
Average
relative
error, %
2.4 0.6 2.3
Based on this table, we can conclude that the
most qualitative layer is verified data on electrical
consumption. This means that in order to obtain
correct results of monitoring and rationing data on
the electrical consumption of large consumers in the
Kaliningrad region, a matrix of verified values
fro2015 to 2020 should be used.
Programmatically, this procedure is implemented
in the form of a AW software and hardware system
(Fig. 4).
Outlier
Panel for selecting methods
of detecting anomalous data
Powerconsumptionmonitoring
Substations
Short‐termforecast Longtermforecast
Anoma lies
Additionalmethods
Yantarenergo
Forecasthorizon
Objectformethod
Method1
Method2
Method1test
Method2test
Timeinterval
Help
Refresh
Save
configuration
Load
configuration
Hour
Overflow
Object
Timeseries
Yantaren ergo
Consumption
Opentable
Showtotal
LegendValues
Openchart
Weather
Figure 4: Automated workplace for parametric adaptation
of electrical consumption data.
4 CONCLUSIONS
It is a window containing panels for selecting time
parameters, resource parameters and a graphical
display area for the results of the procedure.
Moreover, the graphs can be displayed on a large
screen, more specifically detailed – display the
legend, save it in a convenient format and print it
out.
Thus, the presented software implementation
procedure of the parametric adaptation of data is a
necessary addition to the SHS energy consumption
management of the regional electrical system and
allows cleaning, checking, verifying electrical
consumption data, as well as selecting the highest
quality data layer for further calculations.
REFERENCES
Gnatyuk, V.I., Kivchun, O.R., Lutsenko, D.V. 2020.
Digital platform for management of the regional
electric grid consumption. International Conference
on Germany and Russia: Ecosystems Without Borders,
EcoSystConfKlgtu 2020.
Gnatyuk, V.I., Polevoy, S.A., Kivchun, O.R., Lutsenko,
D.V. 2019. Applying the potentiating procedure for
optimal management of electrical consumption of
technocenose. IOP Conference Series: Materials
Science and Engineering International Conference on
Advanced Technologies in the Fuel and Energy
Complex, 2019.
Kivchun, O.R. 2021. Forecasting electric consumption of
technocenosis objects on the basis of values from
transformed vector rank distribution. Journal of
Physics: Conference Series, 2021.
Parametric Adaptation of Data the Software and Hardware System of Electrical Consumption Management
11

Ermakova, A. 2021. Engineering development of the
territory - As a factor of investment attractiveness of
the region. E3S Web of Conferences. 244. 10015.
Zhichkin, K.A., Starikov, P.V., Zhichkina, L.N., Mamaev,
O.A., Artemova, E.I., Levochkina, N.A. 2020. The
applied software role in the training of economic
specialties students. Journal of Physics: Conference
Series, 1691, 012111.
Flaksman, A.S., Mozgovoy, A.I., Lopatkin, D.S., Dikikh,
V.A., Shamsov, I.S., Romanova, J.A., Morkovkin,
D.E., Bovtrikova, E.V. 2021. Prospects for the
development of alternative energy sources in the world
energy. IOP Conference Series: Earth and
Environmental Science. 723. 052040.
Zimnukhova, D.I., Zubkova, G.A., Morkovkin, D.E.,
Stroev, P.V., Gibadullin, A.A. 2019. Management and
development of digital technologies in the electric
power industry of Russia. Journal of Physics:
Conference Series. 1399. 033097.
Zhichkin, K.A., Nosov, V.V., Zhichkina, L.N.,
Ramazanov, I.A., Kotyazhov, A.V., Abdulragimov,
I.A. 2021. The food security concept as the state
support basis for agriculture. Agronomy Research,
19(2), pages 629–637.
Ermakova, A., Oznobihina, L., Avilova, T. 2020 Analysis
of the current state and features of natural resource
potential management. E3S Web of Conferences. 157.
3005.
Kolokolov, Yu., Monovskaya, A. 2016. Guess-work and
reasonings on centennial evolution of surface air
temperature in Russia. Part IV: Towards economic
estimations of climate-related damages from the
bifurcation analysis viewpoint. Int. J. of Bifurcation
and Chaos. 26. 1630033.
Zhichkin, K., Nosov, V., Zhichkina, L., Panchenko, V.,
Zueva, E., Vorob'eva, D. 2020. Modelling of state
support for biodiesel production. E3S Web of
Conferences, 203, 05022.
ITIDMS-II 2021 - II International Scientific and Practical Conference "Information Technologies and Intelligent Decision Making Systems"
12
