
Energy Efficiency Study of Audio-video Content Consumption
on Selected Android Mobile Terminals
Przemyslaw Falkowski-Gilski
a
and Maciej Pankowski
Faculty of Electronics, Telecommunications and Informatics, Gdansk University of Technology,
Narutowicza 11/12, Gdansk, Poland
Keywords: Android OS, Battery Consumption, Energy Efficiency, Mobile Devices.
Abstract: Mobile devices are widely used by billions of users worldwide. Thanks to their main advantage, which is
portability, they should be fully operational as long as possible, without the need to recharge or connect them
to external power sources. This paper describes a study, carried out on four different mobile devices,
with different hardware and software parameters, running the Android operating system. The research
campaign involved several scenarios, including consumption of audio-visual content by different means of
wireless communication (cellular and Wi-Fi), designed to best reflect the common daily use of a modern
smartphone. Those scenarios were based on a user experience survey conducted at the beginning of the study.
Obtained results illustrate user preferences as well as resource consumption of multimedia on different devices
with varying distribution of the Android OS.
1 INTRODUCTION
Nowadays, almost everyone has at least one mobile
device. The smartphone is basically a modern multi
tool. It is utilized for a wide number of applications,
e.g. communication and exchange of information
between individuals, entertainment purposes, such as
taking photos, recording videos, as well as listening
to music and consuming multimedia content
(Falkowski-Gilski and Uhl, 2020).
Mobile devices accompany us every day: at work,
at school, at home, and on the move. Everyone can
take advantage of the huge possibilities that this
pocket computer can offer (Falkowski-Gilski, 2020).
Manufacturers compete with one another in order to
create the next hit, with cutting edge integrated
technology. Yet, differences between individual
models may be either very large or negligible. Often
two separate devices have almost identical technical
specifications. Nevertheless, they differ not only in
brand, appearance, but also price. Of course, different
users have different preferences. They may vary in a
slightly different taste, needs and the way they use
their smartphones. Consequently, functionalities can
determine the choice of a user device.
a
https://orcid.org/0000-0001-8920-6969
The aim of this work was to test a number of
mobile devices, in terms of their energy efficiency.
We investigate the usage of resources, such as:
CPU (Central Processing Unit) and battery lifetime.
Tests, carried out during this experiment, will reflect
the typical everyday usage of a smartphone, based on
a user expectations survey.
2 USER SURVEY
The survey was carried out online using an interactive
spreadsheet application. The questionnaire consisted
of 3 questions, including both closed and open-ended
ones. Provided answers could be chosen from a
predefined list, as well as typed in by users
themselves. They were organized as follows:
1) How many mobile devices do you use every
day? (type in integer).
2) What do you usually take into account when
choosing your smartphone? (select up to 2
answers).
3) What do you most often use your
smartphone for? (select up to two answers).
Falkowski-Gilski, P. and Pankowski, M.
Energy Efficiency Study of Audio-video Content Consumption on Selected Android Mobile Terminals.
DOI: 10.5220/0010726500003058
In Proceedings of the 17th International Conference on Web Information Systems and Technologies (WEBIST 2021), pages 647-657
ISBN: 978-989-758-536-4; ISSN: 2184-3252
Copyright
c
2021 by SCITEPRESS – Science and Technology Publications, Lda. All rights reserved
647
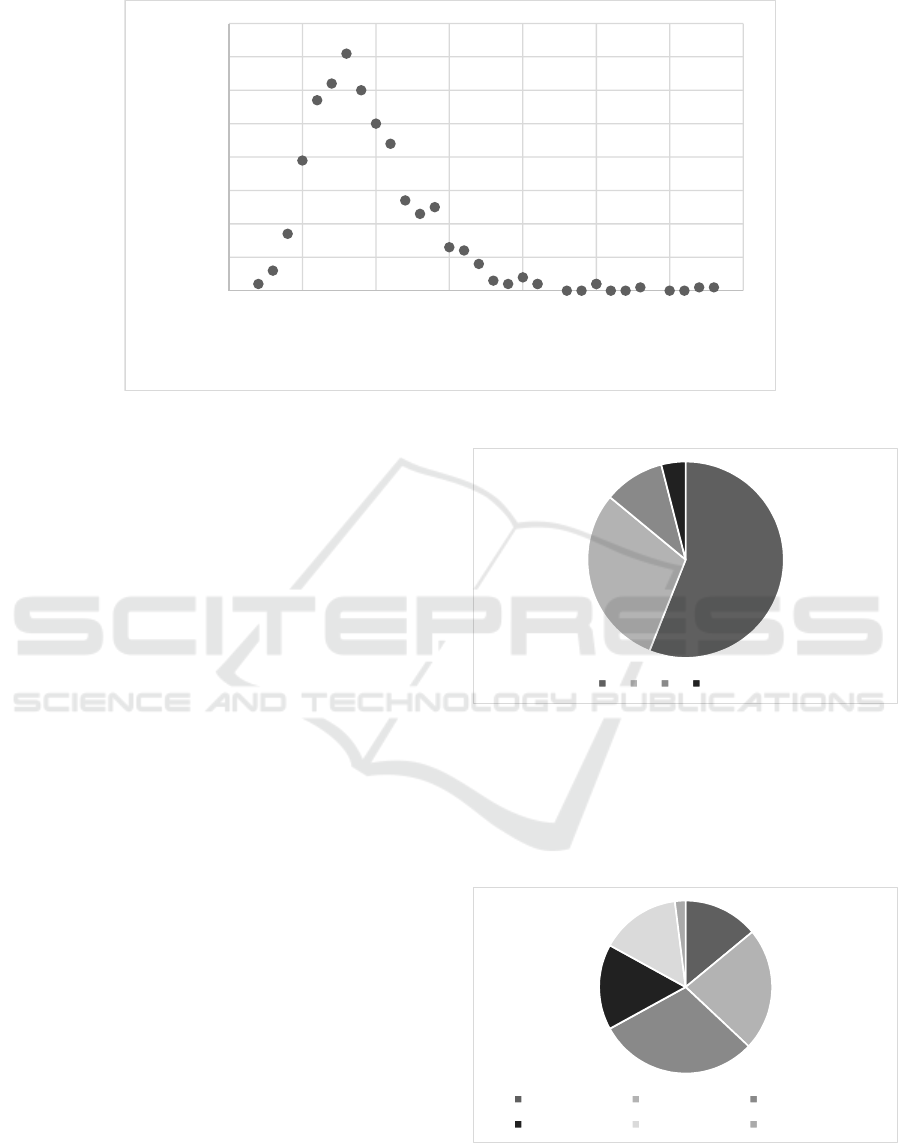
Figure 1: Age distribution of individuals participating in the survey.
The first question checked how “computerized”
or “mobile” was each individual. Nowadays, a typical
user has more than 1 mobile device. It is also
interesting to learn how many users use a greater
number of mobile terminals on a daily basis.
The second question allowed us to notice what
features are most desirable among users. Thanks to
this we could note their preferences. What makes a
successful mobile device and what producers should
pay special attention to.
The third question helped to determine which
tasks smartphones are often used for. This part
enabled us to design appropriate scenarios that could
reflect realistic, everyday usage.
The fourth question pointed out which aspects and
user expectations have not yet been met or fulfilled,
as well as what characteristics of the device
deteriorate over time.
The survey was posted on a social group called
“Telefonawka” on Facebook, which associates over
eighteen thousand people. It brings together users of
mobile terminals, including different software and
operating systems, IoT (Internet of Things)
accessories, as well as manufacturers and other
interested third parties. As a result, more than five
hundred people replied. The age distribution of
participants is shown in Figure 1.
The age of active participants ranges from 13 to
43 years of age. Most of the users participating in the
survey are between 15 and 21 years old. Results of
the survey, describing provided answers to each of the
3 questions, are shown in Figures 2-4, respectively.
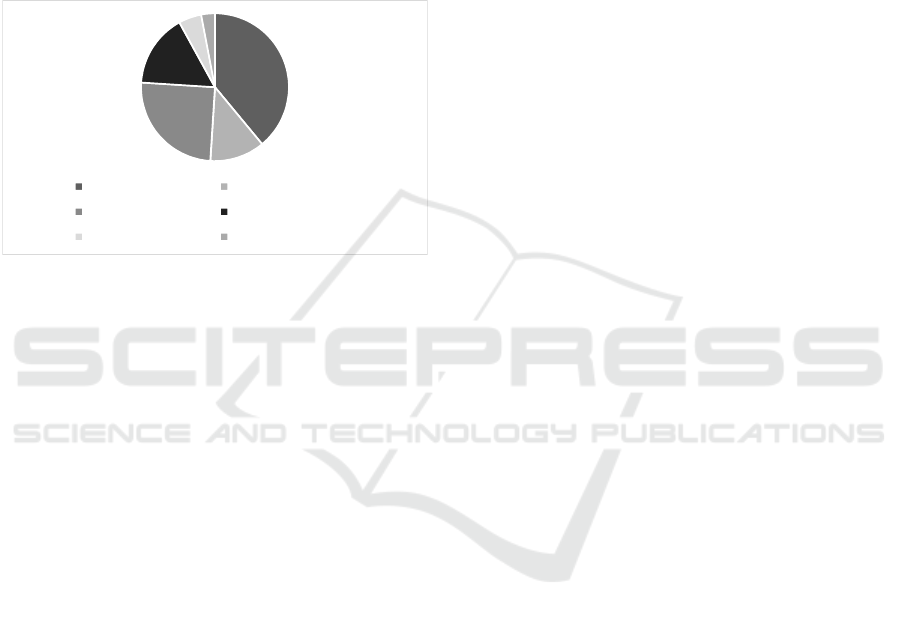
Figure 2: Number of mobile devices used everyday.
In the surveyed group, over a half of individuals
use just one mobile device on a daily basis. Two
devices are systematically used by approx. one third
of them, whereas 14% of them use 3 and more devices
every day.
Figure 3: Factors taken into account when choosing a
mobile device.
0
10
20
30
40
50
60
70
80
10 15 20 25 30 35 40 45
No. of individuals
Age [years old]
56%
30%
10%
4%
1 2 3 4 and more
14%
23%
30%
16%
15%
2%
Appearance Price Efficiency
Battery life Camera quality Other
QQSS 2021 - Special Session on Quality of Service and Quality of Experience in Systems and Services
648
For most people (30%), efficiency (performance)
is the most important factor. The second place is
price, as many of them take into account the price-
quality radio when choosing a smartphone, etc.
Battery life came in third place, as it allows to enjoy
the aforementioned performance. Whereas, the
quality of photos and videos and the appearance of a
device (dimensions, screen size, weight, etc.) were
slightly less important. Other parameters included,
among others, the operating system, support for
updates, as well as waterproof and dustproof features.
Figure 4: Main activities with a mobile device.
When it comes to the main activities, the most
frequently chosen answer were social media.
It should be noted that this survey itself was realized
with the aid of a social media platform. The second
and third place was playback of multimedia (audio
and mixed audio-video). Whereas activities related
with voice calls and text messaging came next.
Surprisingly, only a small percentage of responders
declared their interest in games. Undeniably, console
or computer games are still more popular.
Other activities included the ability to take pictures,
record movies and navigation purposes. A related
study, carried out in Portugal, may be found in
(Horta et al., 2016).
3 ENERGY EFFICIENCY
There are many mobile device available on the
market and the number of smartphones launched each
year continues to grow. From a user’s perspective,
it is highly desirable to own a device that is both
powerful and resource efficient (Ferroni et al., 2014).
As our survey shown, battery lifetime is one of those
parameters particularly important to a wide group of
recipients.
The battery capacity itself is limited, due to the
size and weight of a portable device (Abdelmotalib
and Wu, 2012). Today’s smartphones have a lot of
different functions and applications. In order to
understand which factors can affect the energy
efficiency of a mobile device, one must determine
which parts of the operating system or daily routine
consume the largest amount of energy under different
circumstances.
A regular cell phone that does not use smart
applications can operate for several days on a single
charge. With modern smartphones, handling multiple
applications in the background, the device needs to be
charger every one or two days (Segata, Bloessl,
Sommer and Dressler, 2014). It is worth mentioning
that smartphones consume more energy compared to
regular cell phones even if their smart applications are
rarely used. While the smartphone’s battery capacity
has increased, battery lifetime proved to be shorter
compared to regular cell phones (Kim, Yun, Lee and
Choi, 2012).
Additionally, graphical capabilities of
smartphones in the last few years have grown
significantly. The progress was possible thanks to the
development of GPU (Graphical Processing Unit)
chipsets. More powerful GPUs increase battery
consumption. Today, smartphones have large, high
resolutions screens that enable to process and present
more demanding graphic data.
Of course other factors can affect battery lifetime,
such as: build-in sensors, enabled wireless modules,
services (applications) running in the background,
brightness of the screen, and of course type of
operating cellular standard or data transfer
technology (Perrucci, Fitzek and Widmer, 2011;
König, Memon and David, 2013; Schlichting and
Sawin, 2017).
4 TESTED MOBILE DEVICES
There are many mobile device available on the
market and the number of smartphones launched each
year continues to grow. From a user’s perspective,
it is highly desirable to own a device that is both
powerful and resource efficient. As the survey shown,
battery lifetime is one of parameter particularly
important to a wide group of recipients. The technical
specification of 4 tested mobile devices is described
in Table 1.
These smartphones come from various different
manufacturers, they differ in both hardware and
software parameters. The oldest of them (Smartphone
3) comes from 2012, and was a flagship model at that
time. Smartphone 4, from 2016, is an unusual model,
not intended for the European market. Smartphone 2
was manufactured in 2017, it is a mid-range phone,
39%
12%
25%
16%
5%
3%
Social media Watching videos
Listening to music Voice/text message
Games Other
Energy Efficiency Study of Audio-video Content Consumption on Selected Android Mobile Terminals
649
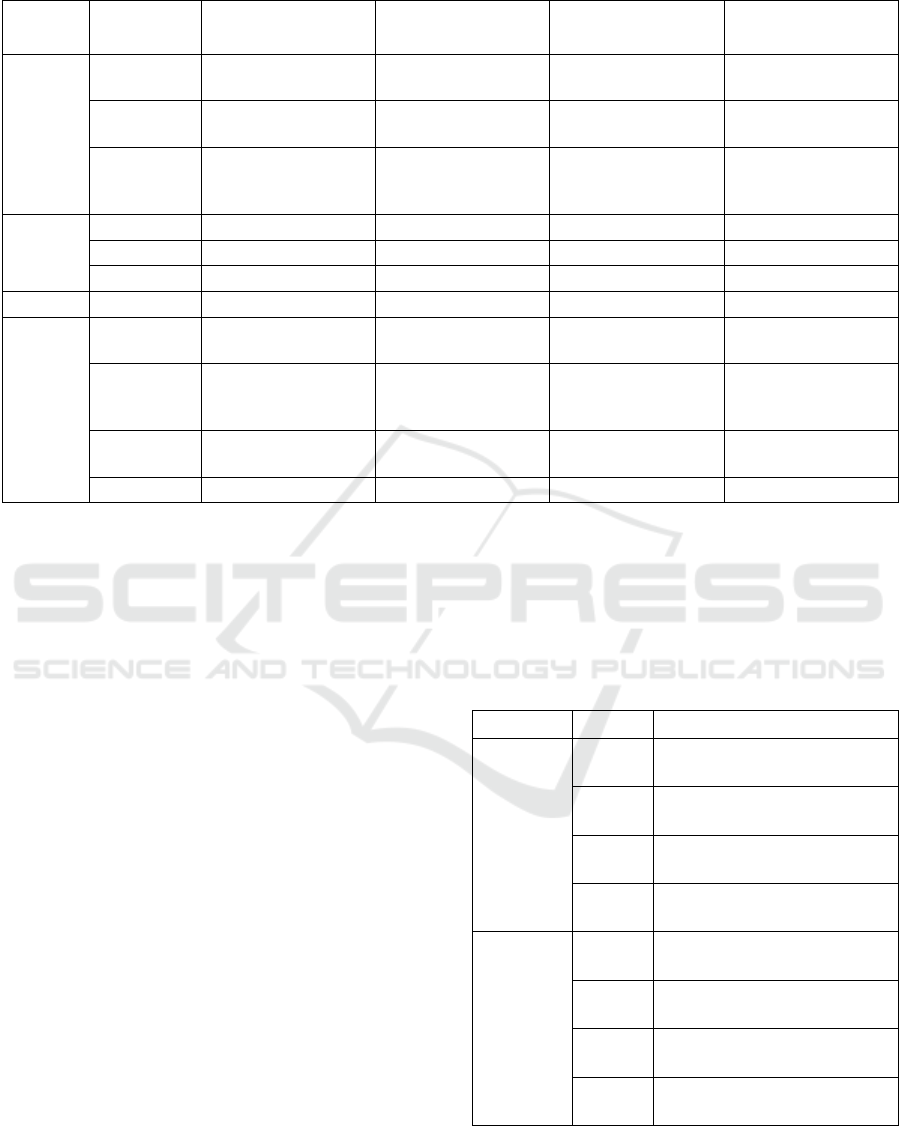
Table 1: Technical specification of tested mobile devices.
Smartphone 1
(Alcatel 3)
Smartphone 2
(Xiaomi Redmi 4X)
Smartphone 3
(Samsung Galaxy S3)
Smartphone 4
(Freetel Musashi)
Network
2G
GSM: 850 900
1800 1900
GSM: 850 900
1800 1900
GSM: 850 900
1800 1900
GSM: 850 900
1800 1900
3G
UMTS: 850 900
1900 2100
UMTS: 850 900
1900 2100
UMTS: 850 900
1900 2100
UMTS: 800 900
2100
4G
LTE: 800 900
1800 2100 2600
LTE: 850 1800
1900 2100 2300
2500 2600
-
LTE: 800 900
1800 2100
Screen
Type IPS TFT IPS LCD Super AMOLED TFT
Dimensions 5.5’’ 5.5’’ 4.8’’ 4.0’’
Resolution 740 x 1440 1080 x 1920 720 x 1280 480 x 800
Battery Capacity 3000 mAh 4100 mAh 2100 mAh 2000 mAh
Platform
Operating
system
Android 8.0 Android 4.4 Android 4.0 Android 5.1
CPU
MediaTek 6739
1.28 GHz
4 Cores
MediaTek 6797
2.30 GHz
10 Cores
Exynos 4412
1.40 GHz
4 Cores
MediaTek 6735M
1.0 GHz
4 Cores
GPU
PowerVR GE8100
570 MHz
Adreno 506
650 MHz
Mali-400
440 MHz
Mali T-720
650 MHz
RAM 2 GB 4 GB 1 GB 1 GB
very popular among consumers. Whereas,
Smartphone 1 was produced in 2018, as a low-price
model, with dual-SIM capabilities.
The initial setup as well as testing procedure is
described in Table 2. The utilized benchmark
application was Trepn Power Profiler from
Qualcomm (Qualcomm, 2021), a power and
performance profiling application, designed to
identify applications that are CPU-intensive, data
consuming, or simply drain the battery. This
application can be run on any Android-powered
device with version 4.0 or higher. The app has two
modes of operation: preset and advanced mode.
The predefined preset mode enables to monitor:
1) CPU speed – displays the speed of CPU
cores on the screen.
2) Mobile data – detect which applications are
using cellular/Wi-Fi data.
3) Performance – a plot of CPU and GPU load.
4) CPU usage – generates the percentage of
usage.
5) CPU load – a plot of CPU cores load.
6) Network activity – including the status
related to the operating networks.
The advanced mode allows to select a set of
parameters that one is interested in. Of course the
availability of respective data depends on the
manufacturer of the chipset, which sometimes may
not be available. For the purpose of this study,
we have selected 2 parameters, namely: battery power
[mW], CPU load [%]. Those factors were monitored
during the use of both cellular and Wi-Fi data
transfer, as well as lowest and highest brightness
settings.
Table 2: Initial setup and testing procedure.
Stage Step Description
Initial
setup
Step 1
Device is fully charged and
powered on
Step 2
Screen brightness is set to
lowest/highest level
Step 3
Cellular/Wi-Fi data
transmission is enabled
Step 4
Testing, custom and evaluated
application are launched
Testing
procedure
Step 1
Launching all applications and
configurations
Step 2
Audio/Video playback over a
period of 3 minutes
Step 3
Ending all actions, saving
results to .csv file
Step 4 End of procedure
The execution of each step, as described, was
automated by our custom-build software, which was
later used to gather and handle obtained data.
QQSS 2021 - Special Session on Quality of Service and Quality of Experience in Systems and Services
650
5 RESULTS
Since watching videos and listening to audio proved
to be one of the most common activities with a
smartphone, we have performed a study concerning:
battery usage and CPU load. Our scenarios included
two types of data transmission (cellular and Wi-Fi),
as well as different screen brightness level (minimum
and maximum). Results of this study are shown in
Figures 5-16. Those related with consumption of
video content, particularly YouTube application,
are shown in Figures 5-12, whereas those focused on
audio content, namely Spotify application, are shown
in Figures 13-16, respectively.
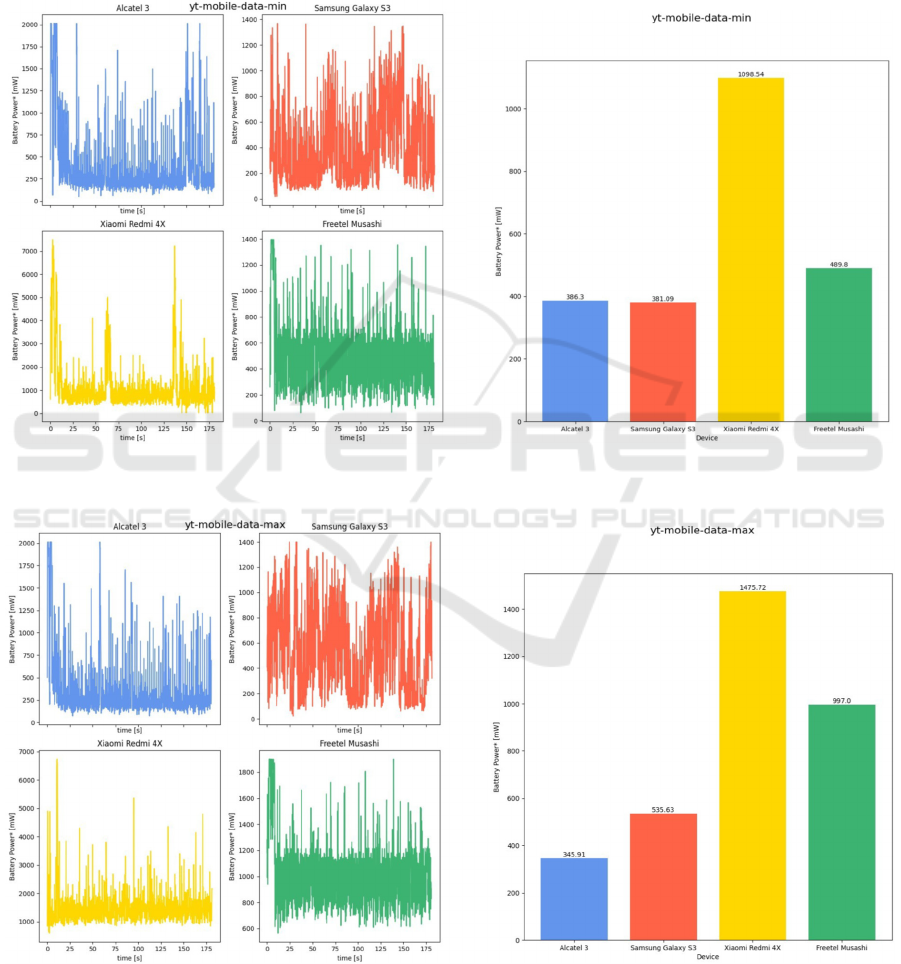
Figure 5: Battery power consumption while watching YouTube videos with cellular data at lowest brightness level:
instantaneous value (left), averaged value (right).
Figure 6: Battery power consumption while watching YouTube videos with cellular data at highest brightness level:
instantaneous value (left), averaged value (right).
Energy Efficiency Study of Audio-video Content Consumption on Selected Android Mobile Terminals
651
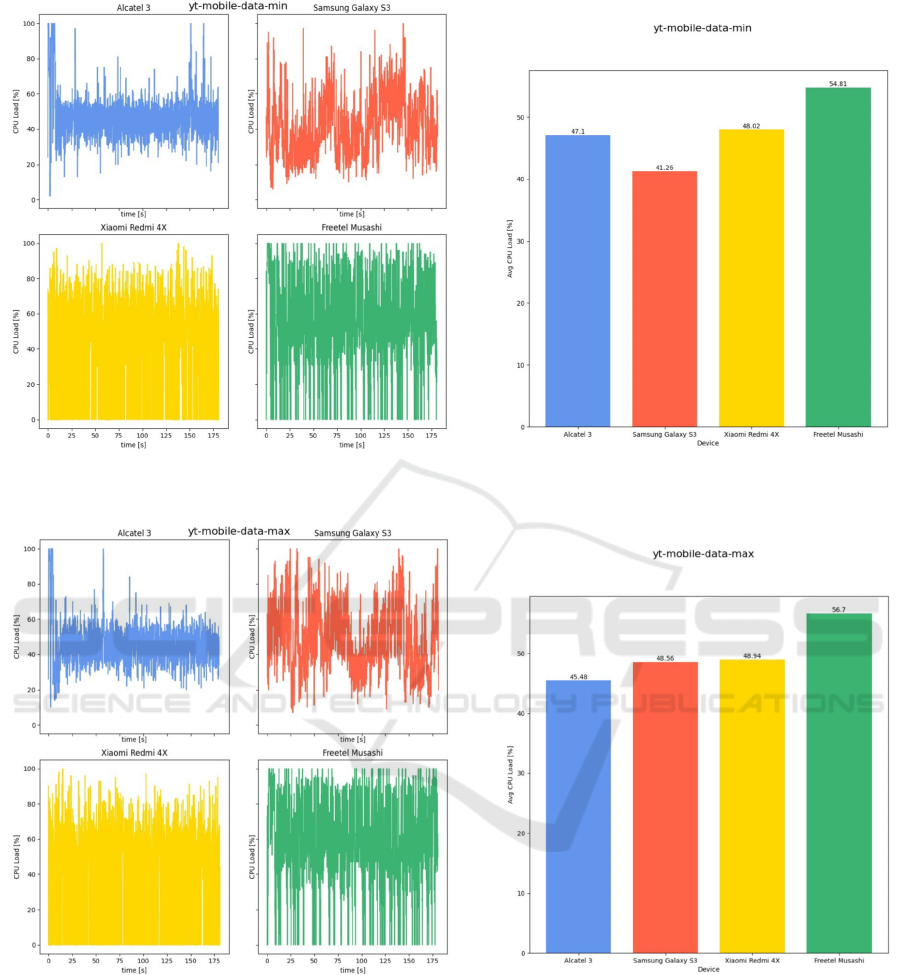
Figure 7: CPU load while watching YouTube videos with cellular data at lowest brightness level: instantaneous value (left),
averaged value (right).
Figure 8: CPU load while watching YouTube videos with cellular data at highest brightness level: instantaneous value (left),
averaged value (right).
When watching movies using the mobile Internet,
the brightness of the screen is of great importance,
especially among the older models. Alcatel 3
(Smartphone 1) obtained similar power consumption
in both variants at approx. 350-380 mW, whereas
other devices recorded a higher difference of approx.
150 mW (Samsung Galaxy S3), 400 mw (Xiaomi
Redmi X4) and 500 mW (Freetel Musashi).
What is interesting, CPU load did not vary
depending on the brightness level of the screen.
QQSS 2021 - Special Session on Quality of Service and Quality of Experience in Systems and Services
652
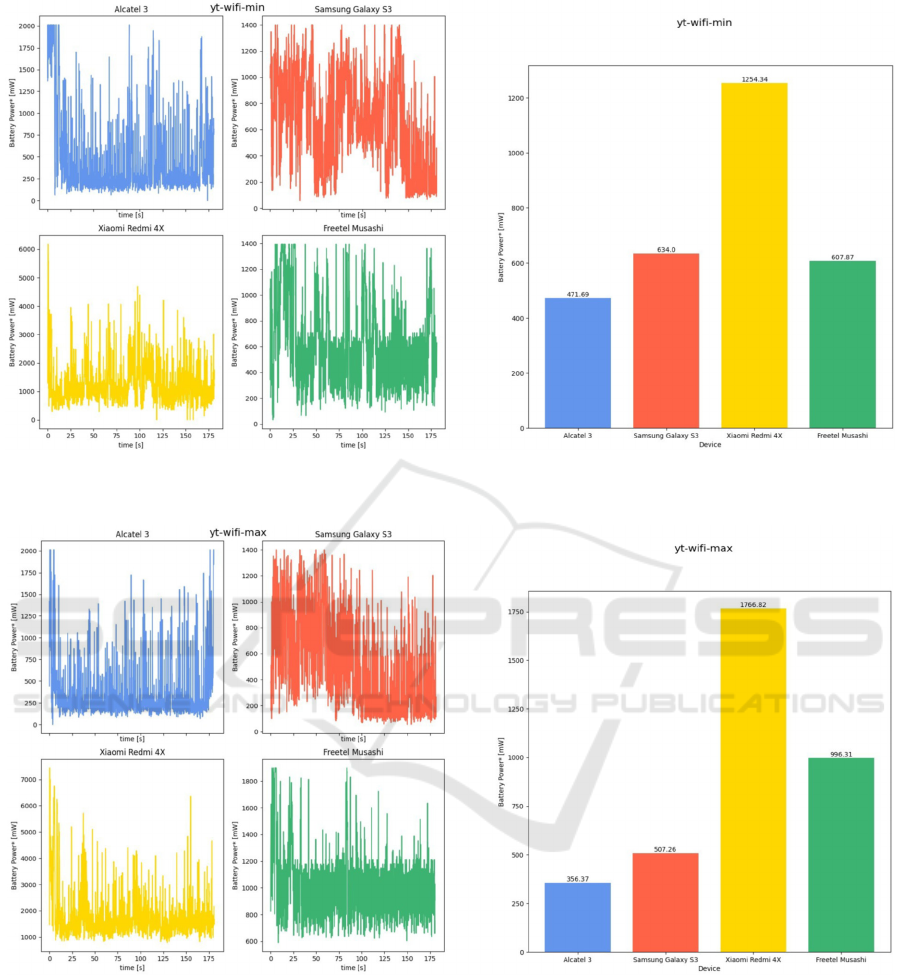
Figure 9: Battery power consumption while watching YouTube videos with Wi-Fi data at lowest brightness level:
instantaneous value (left), averaged value (right).
Figure 10: Battery power consumption while watching YouTube videos with Wi-Fi data at highest brightness level:
instantaneous value (left), averaged value (right).
Comparing obtained results it can be seen that in
the case of Redmi Note 4X and Freetel Musashi with
brighter screen, power consumption increased
drastically (by 500 mW and 400 mW, respectively),
as did when using mobile Internet. Alcatel 3 and
Samsung Galaxy S3, on the other hand, achieved
better results with a higher screen brightness
(reduction of consumption by 120 and 130 mW).
Energy Efficiency Study of Audio-video Content Consumption on Selected Android Mobile Terminals
653
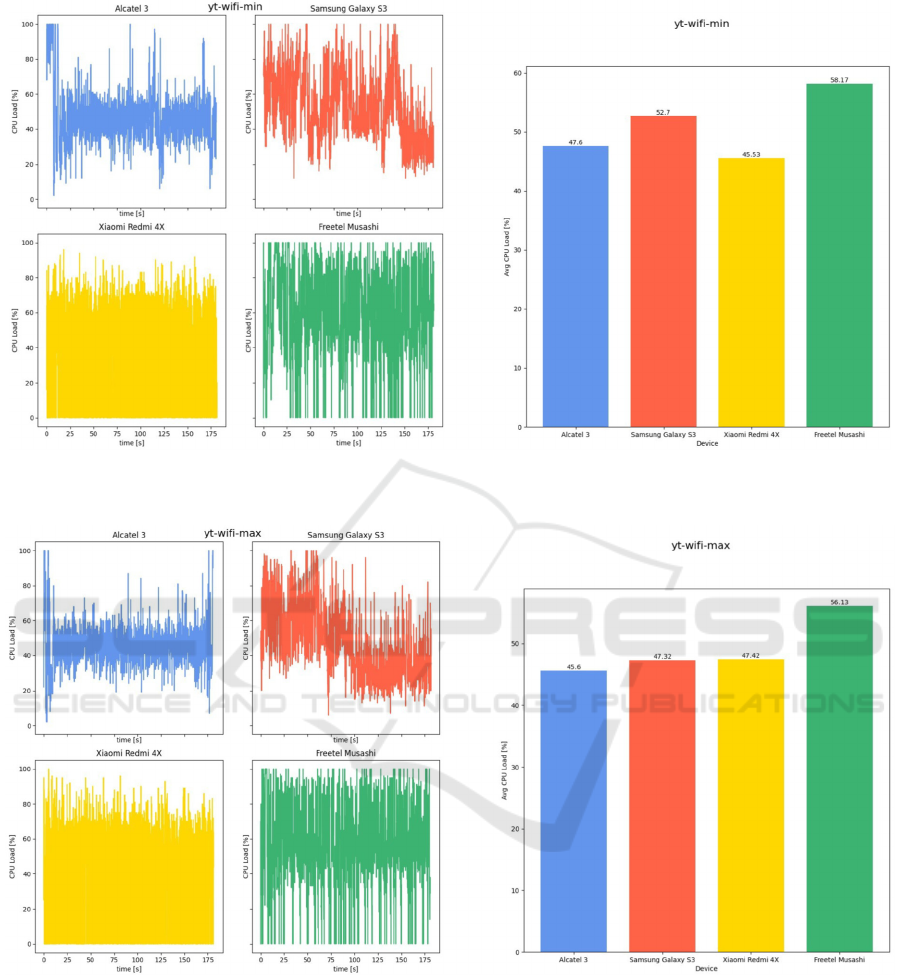
Figure 11: CPU load while watching YouTube videos with Wi-Fi data at lowest brightness level: instantaneous value (left),
averaged value (right).
Figure 12: CPU load while watching YouTube videos with Wi-Fi data at highest brightness level: instantaneous value (left),
averaged value (right).
As shown, the brightness of the screen does not
affect CPU usage. The load is at a similar level as in
the analogous test when using mobile Internet.
During this scenario, on the two latest phones
(Alcatel 3 and Xiaomi Redmi X4), one can notice that
the use of mobile data required much more battery
power (470 mW compared to 355 mW in case of
Wi-Fi). The difference between cellular and Wi-Fi
data transmission in case of Samsung Galaxy S3 and
Freetel Musashi was lower, yet it favored the Wi-Fi
connection as well (27 compared to 124 mW).
QQSS 2021 - Special Session on Quality of Service and Quality of Experience in Systems and Services
654
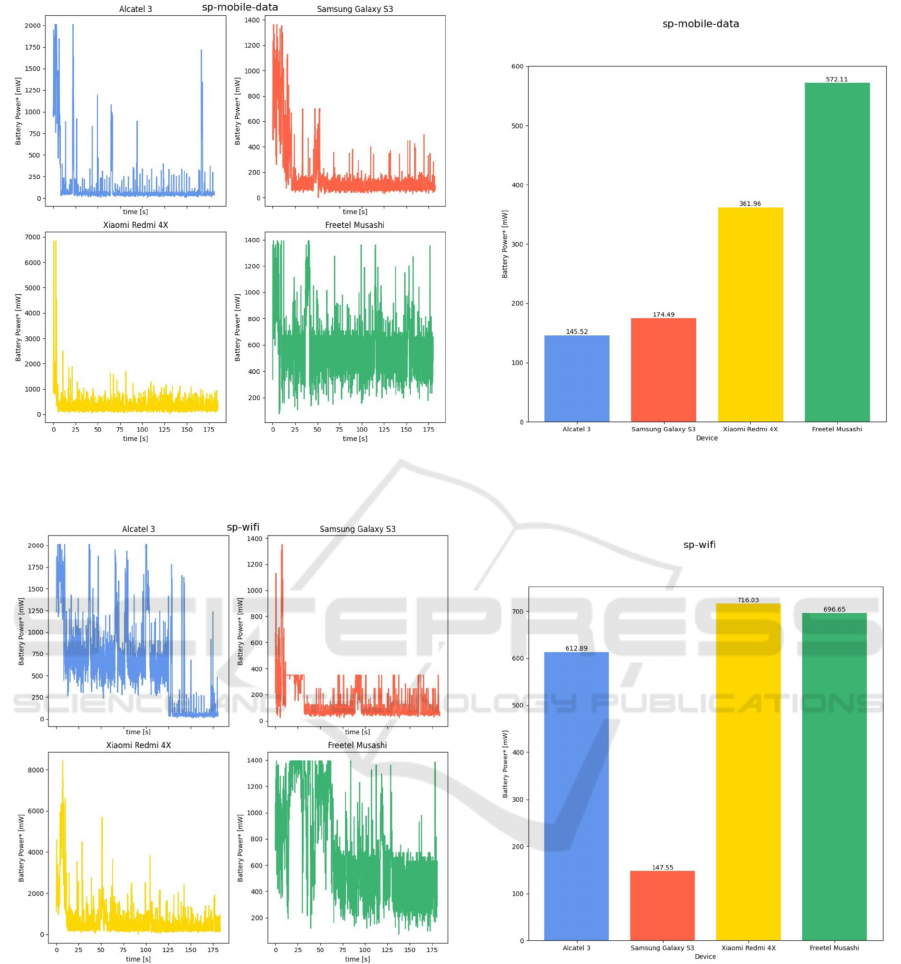
Figure 13: Battery power consumption while listening Spotify audio with cellular data: instantaneous value (left), averaged
value (right).
Figure 14: Battery power consumption while listening Spotify audio with Wi-Fi data: instantaneous value (left), averaged
value (right).
The measured CPU loads partially coincide with
the battery consumption for individual devices
(Freetel Musashi and Samsung Galaxy S3). During
the transfer via Wi-Fi they are characterized by higher
load values compared to cellular data transmission.
Automatically, this translates into higher battery
usage.
6 SUMMARY
In the carried out study, the tested devices were
subjected to typical user scenarios, in which their
energy efficiency has been put to the test. It has
shown that the degree to which the screen brightness
is selected, the choice of data transfer technology
affects the use of the battery and its rate of discharge.
Energy Efficiency Study of Audio-video Content Consumption on Selected Android Mobile Terminals
655
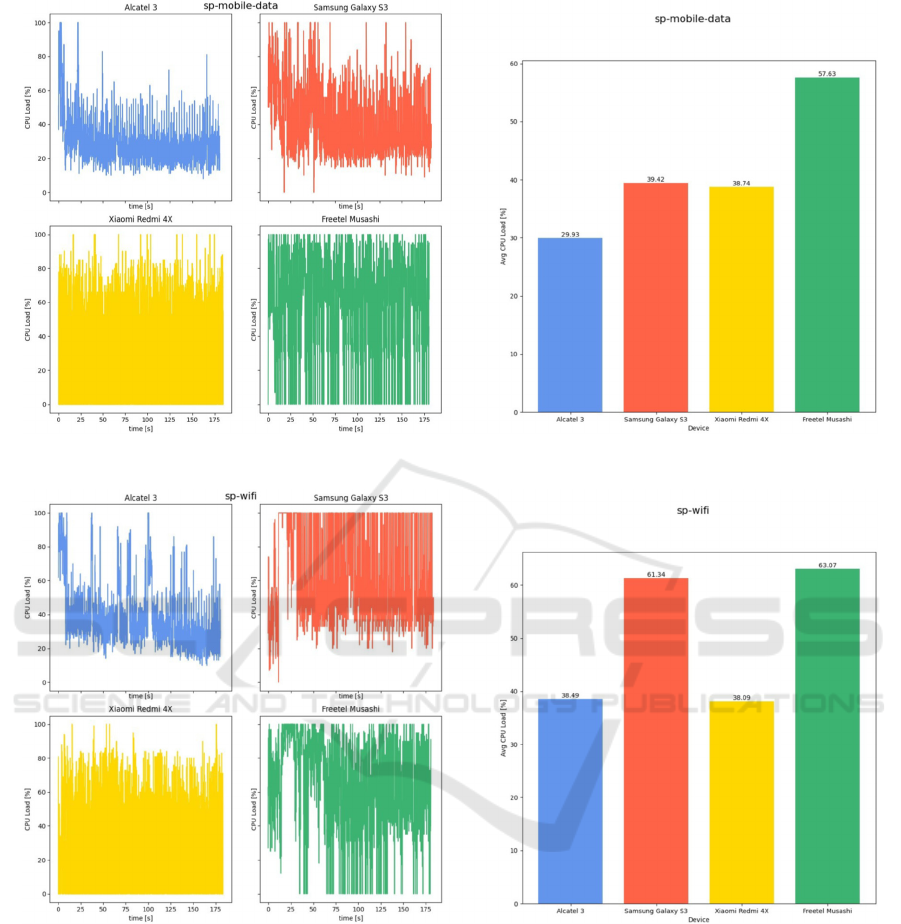
Figure 15: CPU load while listening Spotify audio with cellular data: instantaneous value (left), averaged value (right).
Figure 16: CPU load while listening Spotify audio with Wi-Fi data: instantaneous value (left), averaged value (right).
Current mobile communication includes
transferring and handling huge amounts of data
containing high-quality sound and image, which must
be processed and properly displayed on the device.
Hence, newer phones offer higher hardware
investments.
As shown, generally speaking mobile data
transmission (cellular connection) required much
more battery resources than Wi-Fi data transmission.
As expected, video playback proved to be more
demanding than just single audio. Whereas, screen
brightness should be also taken into account when
designing energy effective solutions. Additionally,
results clearly show that newer devices, both
considering hardware (build-in components) and
software (distribution of the operating system),
have a noticeable advantage over older devices.
However, this does not mean that there is really a
necessity to change one’s mobile device every year
(The Climate Group, 2008).
Still, the topic of energy efficiency and battery
consumption of mobile devices and related systems
and services remains open. Future studies may and
should include a broader range of user activities as
QQSS 2021 - Special Session on Quality of Service and Quality of Experience in Systems and Services
656

well as hardware and software platforms, including a
single or multiple operating systems and user devices,
not to mention network optimization methods and
algorithms. It would be also interesting to evaluate
various playback accessories, including loudspeakers
and headphones, both wired and wireless. A source of
inspiration may be found in (Coughlin and IEEE
Consumer Electronics Society Future Directions
Committee, 2014).
REFERENCES
Abdelmotalib, A., Wu, Z. (2012). Power consumption in
smartphones (hardware behaviourism). International
Journal of Computer Science Issues, 9(3), 161.
Coughlin, T., IEEE Consumer Electronics Society Future
Directions Committee. (2014). A Moore’s Law for
mobile energy: Improving upon conventional batteries
and energy sources for mobile devices. IEEE Consumer
Electronics Magazine, 4(1), 74-82.
Falkowski-Gilski, P. (2020). On the consumption of
multimedia content using mobile devices: A year to
year user case study. Archives of Acoustics, 45(2),
321-328.
Falkowski-Gilski, P., Uhl, T. (2020). Current trends in
consumption of multimedia content using online
streaming platforms: A user-centric survey. Computer
Science Review, 37, 100268.
Ferroni, M., Cazzola, A., Trovò, F., Sciuto, D.,
Santambrogio, M. D. (2014). On power and energy
consumption modeling for smart mobile devices.
In EUC’14, 12th IEEE International Conference on
Embedded and Ubiquitous Computing, 273-280.
Horta, A., Fonseca, S., Truninger, M., Nobre, N.,
Correia, A. (2016). Mobile phones, batteries and power
consumption: An analysis of social practices in
Portugal. Energy Research & Social Science, 13, 15-23.
Kim, M. W., Yun, D. G., Lee, J. M., Choi, S. G. (2012).
Battery life time extension method using selective data
reception on smartphone. In ICOIN’12, International
Conference on Information Network, 468-471.
König, I., Memon, A. Q., David, K. (2013). Energy
consumption of the sensors of smartphones. In
ISWCS’13, 10th International Symposium on Wireless
Communication Systems, 1-5.
Perrucci, G. P., Fitzek, F. H., Widmer, J. (2011). Survey on
energy consumption entities on the smartphone
platform. In VTC’11, 73rd IEEE Vehicular Technology
Conference, 1-6.
Qualcomm. (2021). Trepn Power Profiler.
https://developer.qualcomm.com/forums/software/trep
n-power-profiler [accessed: 15.07.2021].
Schlichting, M., Sawin, J. (2017). Modeling the effects of
independent components on mobile device charging
times. In FiCloud’17, 5th IEEE International
Conference on Future Internet of Things and Cloud,
142-147.
Segata, M., Bloessl, B., Sommer, C., Dressler, F. (2014).
Towards energy efficient smart phone applications:
Energy models for offloading tasks into the cloud.
In ICC’14, IEEE International Conference on
Communications, 2394-2399.
The Climate Group. (2008). Smart 2020 – Enabling the
Low Carbon Economy in the Information Age.
Energy Efficiency Study of Audio-video Content Consumption on Selected Android Mobile Terminals
657
