
Usability Assessment of a Smart Cognitive Assistant for Automated
Driving
Antonella Toffetti
1
, Elena Balocco
1
, Laura Borgarello
1
, Giovanni Turi
1
, Daniela Bertolino
1
and Benjamin Chateau
2a
1
C.R.F. S.C.p.A, Strada Torino 50, 10043 Orbassano, Italy
2
CATIE, 1 avenue Dr Albert Schweitzer, 33400 Talence, France
daniela.bertolino@crf.it, b.chateau@catie.fr
Keywords: Automated Vehicle, Human Machine Interface, Human Machine Interaction, Usability Testing,
Human-centred Design, Acceptance.
Abstract: The Automated Vehicles (AV) are becoming increasingly important in the industrial and mobility domains.
The Human Machine Interface and Interaction are two of the main aspects in the AV design, and as such, the
consideration of the user is critical to the design process. The European Project SUaaVE (SUpporting
acceptance of automated Vehicle) acknowledges that human-centric design is necessary to help AV in
becoming accepted and trusted by road users (drivers, passengers, pedestrians) when it is introduced into the
market.
In the first phase of the project, partners, collaborating on the HMI design, performed different tests.
C.R.F. S.C.p.A. performed a user test, which had different objectives. In this paper, the objective of the
usability evaluation of the SUaaVE first cognitive HMI prototype is described. The test was performed by
showing users a video of automated driving in an AV using the first iteration of the HMI. The findings were
then used during the subsequent redesign phase to improve upon the HMI, according to the Human-Centred
Design process.
This study allowed identifying advantages and limits of the methodology and of the HMI prototype and to
identify and share redesign suggestions (for the following phase of the project) with partners.
1 INTRODUCTION
The deployment of automated vehicles is going to
become a reality in the near future and this
technological innovation will bring a lot of
advantages, for example in terms of higher road
safety, better mobility, enhanced inclusiveness, and
CO
2
reduction.
Consumer preference for riding in self-driving
cars is set to double by 2024 (Capgemini, 2019), yet
the idea of being in a self-driven vehicle has not being
completely accepted. The different theories on
acceptance (Tétard & Collan, 2009; Venkatesh &
Bala, 2008; Venkatesh, 2012) show several salient
dimensions which could be considered to improve the
users' attitudes towards AV usage (e.g., hedonistic
aspects, social impact, usefulness, usability).
In order to avoid the creation of gaps between
technological feasibility and possible societal
a
https://orcid.org/0000-0003-2570-4381
concerns (e.g., acceptance, trust), and losing or
diminishing the positive impact of this innovation, it
is of paramount importance to include road users into
the AV design process.
The European Project SUaaVE (SUpporting
acceptance of automated Vehicle) acknowledges the
risk of such a gap and aims to lean on a Human -
Centred Design approach, where the user is at the
centre of the process and actively contributes to the
new archetype of automation in SUaaVE: ALFRED
(Automation Level Four+ Reliable Empathic Driver).
ALFRED aims to understand the user’s state, and
from this information, if needed, to manage corrective
in-vehicle actions for enhancing the automated
driving road user experience.
In the SUaaVE project, following important
dimensions of the acceptance models, three axes of
research (Kyriakidis et al., 2019) were considered to
240
Toffetti, A., Balocco, E., Borgarello, L., Turi, G., Bertolino, D. and Chateau, B.
Usability Assessment of a Smart Cognitive Assistant for Automated Driving.
DOI: 10.5220/0010725900003060
In Proceedings of the 5th International Conference on Computer-Human Interaction Research and Applications (CHIRA 2021), pages 240-248
ISBN: 978-989-758-538-8; ISSN: 2184-3244
Copyright
c
2021 by SCITEPRESS – Science and Technology Publications, Lda. All rights reserved

design the Cognitive, Emotional, and Adaptive
interfaces:
1) The cognitive needs of users, which is the
information users must receive to increase
their knowledge of the situation and to manage
it appropriately. For example, taking into
account the users' degree of involvement in the
driving task (e.g., active road monitoring, non-
driving related tasks, drowsiness etc.), and
their situational awareness (Kyriakidis et al.,
2019).
2) The emotional response of users, possible
thanks to the development of an empathic
module for monitoring users’ emotional and
behavioural reactions, able to guide driving
decision and comfort choices.
3) The optimisation of users’ comfort, which is a
dimension of well-being, and an important
aspect of the acceptance. The SUaaVE
comfort management will ensure a pleasant
use of the automated vehicle.
In order to test hypotheses formulated on
ALFRED models, a variety of tests are performed by
partners of the project, to evaluate the HMI solutions
being designed.
This paper concentrates on the first of the three
axes of research, mentioned above and, in particular,
on the usability evaluation of the first interface
prototype of a smart cognitive assistant. The aim was
to understand what refinements could be made to
iteratively improve the interface from a user point of
view, in the following steps of the project.
In this project, innovative features are developed
and tested. These tests must be conducted in different
countries to control regional disparities. In the early
stages of the design, it is difficult to reproduce a
prototype in the various regions of all the partners for
testing, especially in a health crisis situation. We
therefore chose to explore the possibility of testing its
usability from a video. This article describes this
initiative and concludes on its benefits and
limitations.
2 METHOD
2.1 Participants
Participants were recruited among C.R.F. S.C.p.A.
(CRF) employees (not externally as originally
planned) due to COVID 19 restrictions.
A request was sent through CRF Intranet to CRF
employees with the kind request to attend this test.
Recruitment criteria were as follows: all participants
must have a driver licence, must not work in related
technical departments (e.g., Advanced Driver
Assistance System, Automated Driving) and must not
be involved in the SUaaVE project.
The main aim of this first loop test was the in-
depth usability evaluation (Rubin, 1994)
of the first
version of the SUaaVE cognitive interface prototype,
and so a sample size of twelve participants (N=12;
75% male, 25% female) was chosen. They had an
average age of 46.42 years (SD=9.91, range 29-61
years). Thirty-three percent of the participants had a
high school diploma, while 67% of them had a
university degree.
Participants drove an average of 16000 kilometres
per year (km/y) (SD = 8034, range 5000-30000 km/y)
on mixed types of roads.
Forty-two percent of participants owned small
segment cars, 33% mid-size cars, 16% large-size cars,
and 8% small sport utility vehicles.
From the socio-demographic questionnaire
emerged also that:
• the frequency of use of a navigation app on a
smartphone was rarely (42%), often (33%) or
sometimes (25%);
• Half of the sample did not use Advanced Driving
Assistance Systems, while 33% use them often,
and the remaining 17% reported they only
sometimes use them.
2.2 Apparatus
The original plan was to use the first version of the
Virtual Human Centred Design platform (V-HCD)
designed by ESI. This first version is a simplified
software that includes an ego-car immersed in a
dynamic virtual road environment connected to a
driving simulator (ego-car cabin), to allow
participants to experience the automated driving,
through the interaction with the ego-car cabin, piloted
by the V-HCD ego-car model.
Due to the pandemic emergency, this type of
apparatus could not be used due to unexpected
constraints, like long periods of remote working,
which made necessary to find a workaround in case
remote tests should have been executed. For this
reason, it was determined that it would be reasonable
to use a video if remote tests were required.
Ultimately, the first loop test was able to take place in
person, notwithstanding the COVID 19 emergency
period. The test was performed in the CRF Usability
Laboratory, using a mixed (real & virtual) apparatus,
Usability Assessment of a Smart Cognitive Assistant for Automated Driving
241
made of a physical vehicle mock up, and a screen,
which was used to display a video, simulating
automated driving scenarios, shown to the
participants. The participants were not requested to
drive while watching the video.
The static vehicle mock-up was built reproducing
a vehicle interior with steering wheel, pedals and an
automotive seat. An 85” curved TV screen was
selected as the most appropriate dimension, and type,
to be used and collocated at 1m from the mock-up.
All apparatus parts were mounted in order to reach
a realistic participant posture, taking into account
comfort as well as visibility needs.
The large screen displayed the videos of the
automated driving scene (corresponding to project
use cases) including a driving simulator (SCANeR
studio 1.9) and the SUaaVE first cognitive interface
(HMI) on a tablet (Fig.1). The videos were made and
kindly shared by CATIE and Bordeaux IBNP,
partners of the project.
The complete apparatus was optimized to reach as
much as possible a realistic visual interaction during
the test among the participant seated in the mock-up,
the physical components of the mock-up and the
frontal screen. This required optimization of the
screen distance from the mock-up as well as the
physical ergonomics adjustments of the mock-up
itself.
Once the apparatus was in its optimal
configuration, an iterative optimization activity was
done with CATIE colleagues, in order to reach the
best visibility of the automated driving scenes and of
the SUaaVE first cognitive interface (HMI) both
displayed on the frontal screen video.
2.3 Scenario
Different situations were presented in the videos,
prepared to show simulated manual (driver-in-
control) and automated driving sessions.
In the videos, the vehicle usually started the
journey in an urban scenario.
Many changes in the driving mode (manual /
automated) and viceversa (automated / manual) were
visualised, with specific feedback to the driver to show
the participant multiple handover, and takeover events.
In urban scenarios, typical uses cases were
shown: crossroads, pedestrians on the sidewalk,
traffic in which other vehicles performed driving
manoeuvres, traffic lights, and roundabouts.
The displayed scenario then followed a rural road
to reach a highway. In this condition, the traffic
situation changed, together with traffic signs, vehicle
speed and other vehicles overtaking.
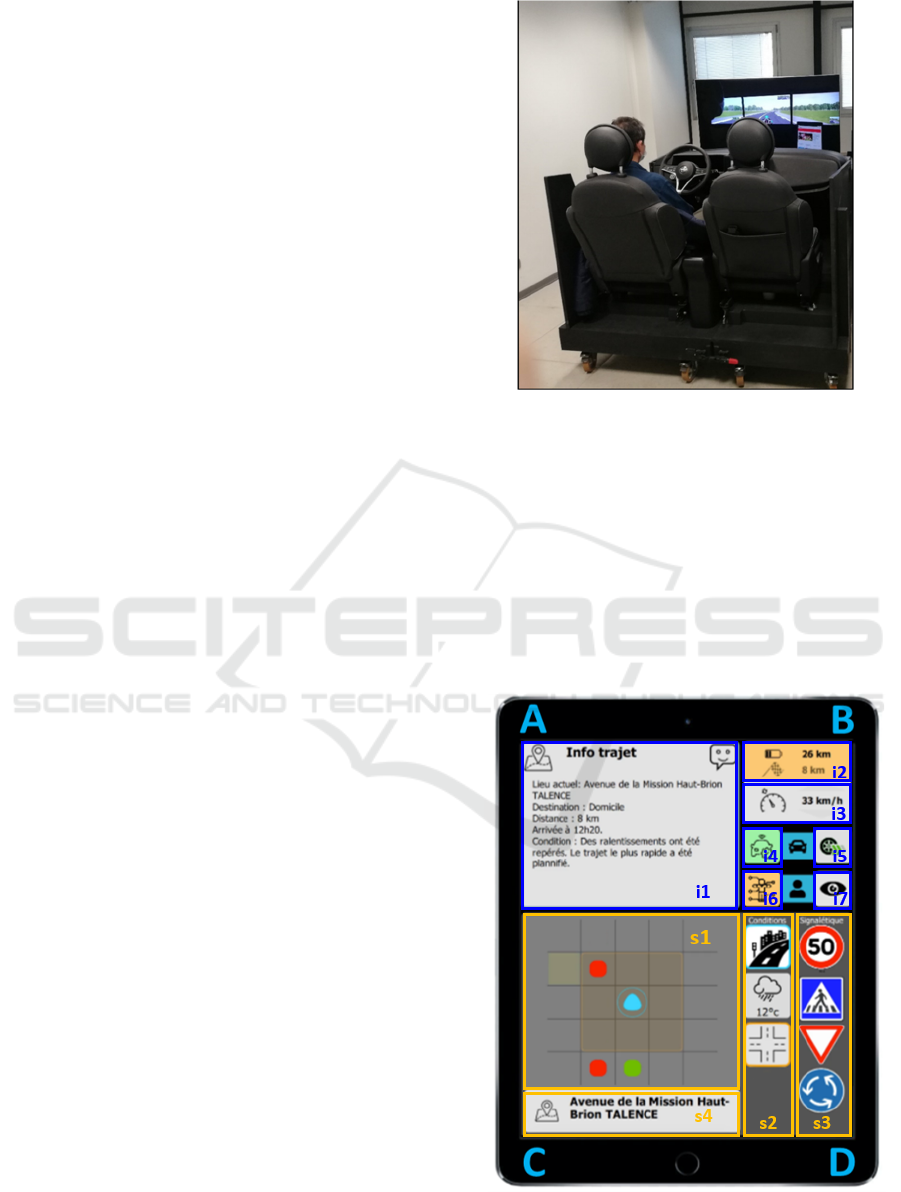
Figure 1: User test apparatus.
In the last part of the videos, the ego-vehicle came
back to the town in an urban scenario and ended by
parking the vehicle.
2.4 Stimuli
The first SUaaVE HMI prototype, displayed in the
central part of the dashboard (Fig. 2), can be divided
into four different areas (A, B, C and D) with different
information.
Figure 2: SUaaVE first cognitive Human Machine Interface
prototype.
SUaaVE 2021 - Special Session on Research Trends to Enhance the Acceptance of Automated Vehicles
242
Area A is a sort of travel diary, containing
contextual information on the trip.
Area B shows some basic information like
autonomy and distance to arrival (i2), speed (i3);
moreover, this area contains feedback about the
technical status of the automated vehicle (i4), the
vehicle dynamic e.g., slow, normal, fast (i5), the
user’s status detection capability (i6) and the driver
activity (i7).
Area C shows a schematic "radar" area (s1) with
the presence of road users (both vehicles and
pedestrians) around the ego-vehicle. Moreover, it
shows the vehicle position (s4).
Area D contains information about road
conditions (s2) and road signs (s3).
The interface received information from
simulator about the driving situation, which was
transposed graphically in order to inform the user
continuously about the driving data processed by the
vehicle.
On this first version of the interface, some
functions were not functional and therefore their
display stayed static (zones i1, i4, i5, i6, i7, s4
presented in Figure 2).
In front of the driver, beyond the traditional
cluster information, additional feedback was
displayed to show the automated driving modes:
• a pop-up message to explain that the automated
driving mode was available or, when in the
scenario the takeover request was necessary, to
explain the reason for this request (e.g., GPS
interruption, road works);
• a blue coloured band (on each side of the
instrument cluster) while the automated driving
mode was active, which disappeared once the
vehicle was again on manual mode.
This feedback was consistent whether or not the first
SUaaVE HMI prototype was displayed on the tablet,
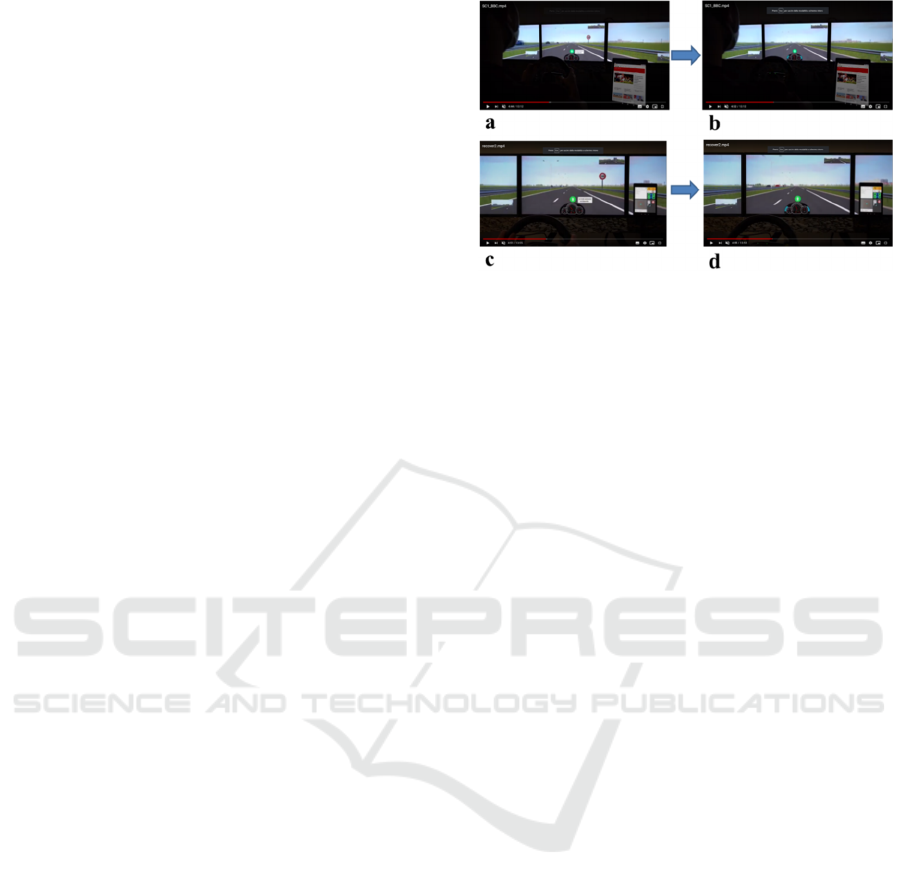
included in the video shown to participants (Fig. 3).
2.5 Test Conditions and Experimental
Design
This study had two test conditions, one in which the
HMI was not displayed on the tablet (Figure 3: a.-b.)
and the other in which the participants experienced
the HMI prototype (Figure 3: c.-d.).
The test had a within-subject design, in which all
participants experienced, through the videos, all
scenarios in both test conditions.
Figure 3: a. Video without HMI / AD availability mode - b.
Video without HMI / AD active mode - c. Video with HMI
AD availability mode - d. Video with HMI / AD active
mode.
2.6 Procedure
Participants were welcomed by an experimenter and
hosted at the CRF Usability Laboratory, thanked for
taking part in the study, and the anti COVID 19
protocol measures to be followed by everyone
involved in the test were explained.
Participants were introduced to the test protocol
through written instructions and were informed about
privacy aspects according to the EU General Data
Protection Regulation, followed in the CRF
procedure.
Prior to testing sessions, participants completed a
socio-demographic and driving habits questionnaire.
The participants sat in the physical vehicle mock-
up and observed the videos on the automated driving
without and with (in this order) the first HMI
prototype developed in SUaaVE.
After the scenarios were completed, without any
explanation from the experimenter, participants were
asked to give their explanation of the HMI from their
point of view. In a second step, the interviewer
explained the HMI using printed images of the
interface.
Participants were then administered a
questionnaire to evaluate the HMI. They were asked
to rate their experience, and provide comments.
Last question was about their preference toward
the automated vehicle experience with or without the
HMI.
At the very end, participants were thanked for
having attended the test session.
The test had a duration of one hour and a half.
2.7 Subjective Measures
Different type of data were collected during the test.
Usability Assessment of a Smart Cognitive Assistant for Automated Driving
243
First, data to describe the participants’ sample
were collected through a socio-demographic and
driving habits questionnaire.
While viewing the videos, participants were asked
to follow the Thinking Aloud method (Lewis, 1982),
expressing their thoughts about what they were
experiencing and their comments were collected.
To analyse and quantify the different usability
aspects (e.g., comprehensibility, legibility/
readability, preferences) of the different HMI areas
and the information they displayed, CRF developed
an ad-hoc evaluation grid, agreed with partners, to
collect quantitative data through a 7-point scale (very
negative, negative, little negative, neither negative
nor positive, little positive, positive, very positive).
Moreover, qualitative data was collected through
comments that participants associated to their scores.
These comments, together with the verbatim
collected through the Thinking Aloud method, gave a
deep insight to their scores.
Then, in order to have a global score of the HMI
usability, participants were asked to rate their
experience on nine usability dimensions using a 7-
point semantic differential scale between polar
adjectives (e.g., simple - complex, useful - useless,
stressful - relaxing).
3 RESULTS
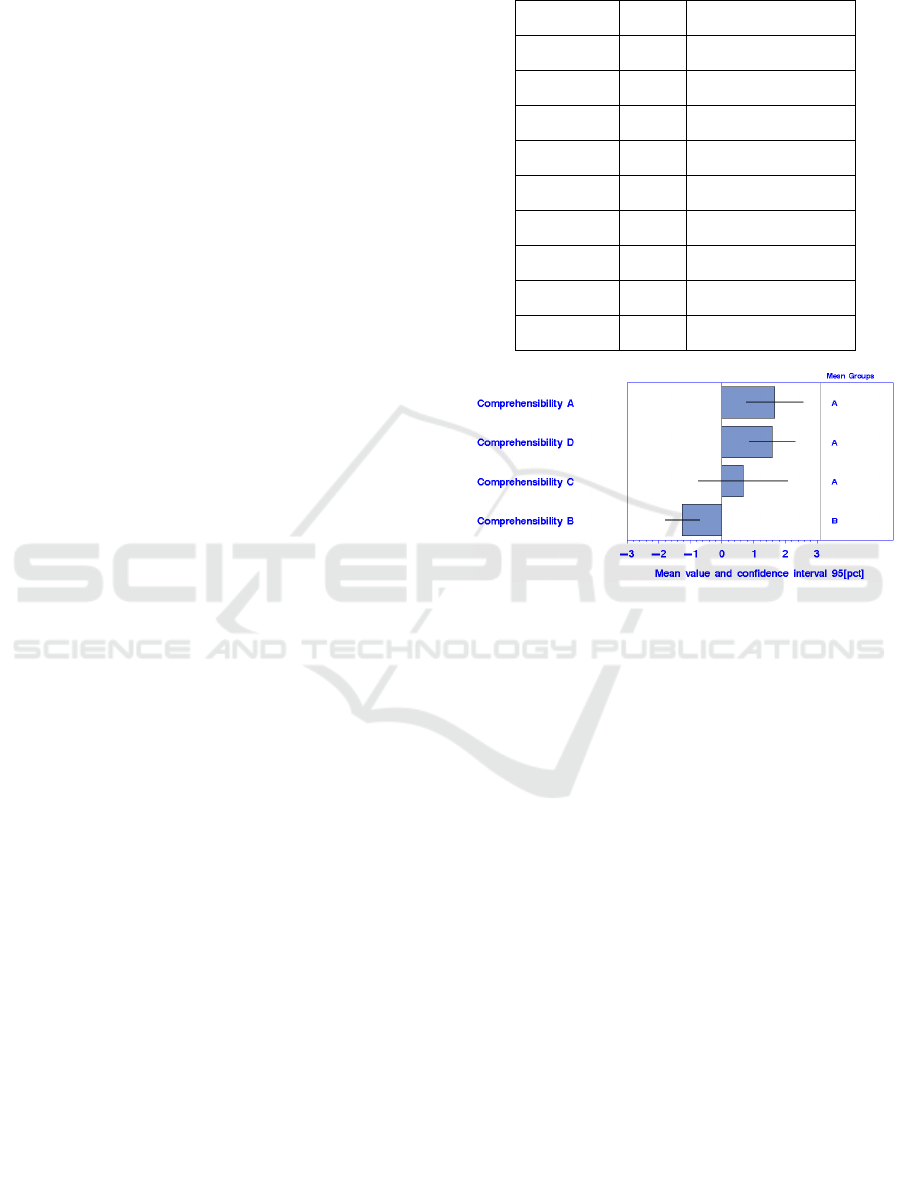
3.1 HMI Comprehensibility
Average evaluation and confidence interval (with T
distribution) were calculated for each HMI area. Then
a monovariate ANOVA and a Duncan multi
comparison test (using SAS
TM
) were applied to
identify possible statistically significant differences
among aspects and areas.
Participants’ comprehension evaluation of each
area of the HMI (A, B, C, D in Figure 3) is shown in
Figure 4 graph (F(3, 44) = 9.66, p < .001).
3.2 HMI Legibility
Applying the same analysis as for the
comprehensibility, results on participants’ legibility
evaluation of the HMI prototype A, B, C, D areas are
shown in Figure 5 graph (F(3, 44) = 14.80, p < .001).
3.3 HMI Usability Evaluation
Participants’ global usability evaluation of the HMI is
reported in Table 1:
Table 1: Global usability evaluation mean and standard
deviation.
Adjectives Mean Standard deviation
Useful 1.25 1.71
Necessary 1.17 1.64
Pleasant 0.42 1.44
Relaxing 0.25 1.48
Friendly 0.08 1.16
Effective 0.00 1.48
Safe -0.33 1.37
Easy -0.67 0.98
Simple -0.83 1.27
Figure 4: Participants’ evaluations comprehensibility of
HMI prototype areas.
Applying a monovariate ANOVA using SAS
TM
,
not all adjectives are equivalent (F(8, 99) = 3.18, p
= .003).
With a Duncan, multiple comparison test, with
95% of confidence level, the significance of the
different adjectives is shown in the Figure 6: the same
letter is attributed to not statistically significantly
different adjectives.
For example, no difference there is between
Useful and Pleasant (F(1, 22) = 1.66, p = .02) while
significant different there is between Useful and Safe
(F(1, 22) = 5.90, p = .002).
3.4 Preference on Automated Vehicle
with or without the HMI
A χ2 test was applied on the collected subjective data
on automated driving preference with or without the
HMI.
After this first loop test, there is no statistical
difference between participants preferring automated
vehicle experience they had with or without the HMI
prototype (χ2 (1, N = 12) =0.33, p = .56).
SUaaVE 2021 - Special Session on Research Trends to Enhance the Acceptance of Automated Vehicles
244
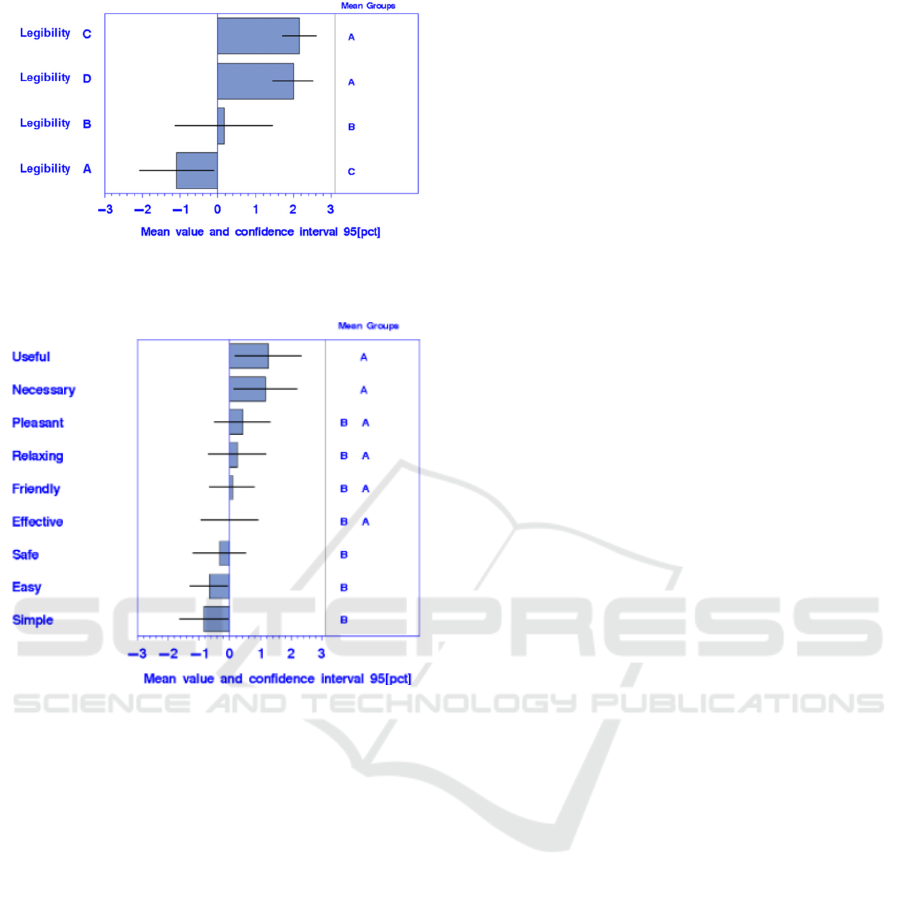
Figure 5: Participants’ evaluation of legibility of HMI
prototype areas.
Figure 6: Global usability evaluation results.
4 DISCUSSION OF THE RESULTS
In the first three paragraphs, there is an explanation
of the results, which considers both the participants’
subjective scores and comments, followed by a
summary of suggested ways to improve the interface.
4.1 HMI Comprehensibility
Area A (i1): it was considered comprehendible but
there were too many words, to be processed quickly;
it would be better to show travel information in a
more graphical way.
Area B: the upper sections (i2, i3) were
considered comprehendible, but not useful enough to
be displayed on the HMI prototype.
The lower section of area B (in particular i5, i6
and i7) was not found to be intuitive by participants;
however, following the experimenter’s explanation
this kind of information was considered interesting by
the participants.
Participants always defined the secondary
functions i4, i5, i6, and i7 as icons, because
participants felt none of these functions looked like
buttons they could interact with.
Area C (s1): the meaning of this area was
partially understood by the majority of participants,
but some have difficulties because of the clutter in
this area, the details, colours and shapes. In particular:
• the coloured shapes were not evaluated as
represented in a realistic way;
• the shapes had different chromatic code, not
always discernible to participants. (e.g., the
difference between light grey and the other
colours);
• participants didn’t realize that each of the shapes
represented different road users (e.g., the
pedestrian represented by a square was less
noticeable);
• the radar modality visualisation was not very
familiar to users. Moreover, the radar grid is
perceived as cluttered by 40% of participants;
• the latency was considered slow (there was an
evident delay between the event on the road and
the obstacles visualized on the radar map), but
probably this was a video reproduction effect.
Area D: it was fairly well understood but still
found to be a slightly confusing, because of the
presence of multiple icons.
4.2 HMI Legibility/Readability
Area A legibility/readability was evaluated
negatively: there was too much written information,
the font was too small and the spacing between lines
of text was not sufficient.
Area B evaluation was neither negative nor
positive, as some details could be easily read but other
could not.
Best evaluations were given to areas C and D to
which participants gave a positive score.
4.3 HMI Usability Evaluation
In the usability evaluation, the HMI prototype
received the highest rating for the adjectives
“necessary” and “useful”. All the other evaluations
were around the neutral point and or on the negative
side of the scale.
Usability Assessment of a Smart Cognitive Assistant for Automated Driving
245

In fact, the HMI prototype was considered
necessary and useful in general, but participants’
comments explained that this HMI should contain
more information regarding automated driving,
especially feedback about the transition manual - to -
automated and automated - to - manual (handover and
takeover), currently shown besides the instrument
cluster.
Due to some aspects not completely understood
(especially in area B), the HMI was evaluated a little
enjoyable, but not so relaxing and friendly. Some
elements were distracting (so potentially having some
level of impact on safety, when displayed during
manual driving) or less useful (e.g., Area C was
cluttered).
Participants did not find using this HMI prototype
to be simple, because the information was not very
intuitive and the huge quantity of details.
In this study, all users’ evaluations, and associated
verbatim were very useful in redesign the HMI,
especially when the evaluations were negative. These
evaluations clearly indicated what had to be modified
in the next version of the prototype.
4.4 Preference
During this study, based on subjective measures, a
preference did not emerge for having or the HMI or
not, while driving in the automated mode.
Participants found the task of expressing a
preference, which includes hedonistic aspects, was
not easy when only experiencing this HMI by
watching a video and observing printed images.
Despite the complexity of the task, it is worth
noting that participants stated many times that the
tested HMI would be very useful to inform the users
in an AV, once issues they highlighted had been fixed.
4.5 How to Improve the HMI
Prototype
A set of recommendations for the redesign of the HMI
were identified and shared with SUaaVE colleagues
and, in particular, CATIE partners, for the next
version of the cognitive HMI prototype development.
Area A
To convey travel information, in particular during
automated driving sessions, it was suggested to:
• use a more graphical layout and less words;
• explore the possibility to add navigation maps
that are familiar to drivers;
• display emergency messages (e.g., congestion,
incident) if available.
Area B (i2, i3)
Suggested changes were:
• present the information of autonomy, in particular
the distance from destination and current speed in
the instrument cluster and not in the i2 and i3
sectors;
• present a visual dynamic graphic feedback of the
takeover request, instead of having a blue
feedback only besides the instrument cluster (Fig.
3);
• add an audible feedback to the visual graphic for
a takeover request, to enhance the driver situation
awareness, in order to avoid the negative
outcomes of a takeover request that is noticed
late, or missed altogether;
• add an emergency vehicle takeover request
message or messages related to issues with the
automated vehicle to indicate when rapid response
measures are needed, and explain the on-going
situation to the user. These emergency messages
could be displayed in redundant locations, such as
the instrument cluster as well.
Area B (i4, i5, i6, i7)
The following changes were recommended:
• display any icons or messages related to
automated vehicle issues (e.g., failure) on the
instrument cluster as well as in area i4 (technical
status of the AV), to follow familiar messaging
strategies;
• to enhance the intelligibility of the icons in i5 (AV
dynamic style), i6 (user monitoring status), and i7
(driver activity), users could be involved in the
icons definition (ISO 9186-1:2014; Campbell et
al., 2004);
• use 3D visualisation to differentiate the icons of
i4, i5, i6, i7 (if they will be virtual buttons), to
indicate to the user that they can be pushed to
select among different options.
Area C (s1):
Some changes to the graphical elements used on
the radar area were suggested:
• use more realistic shapes (e.g., 2D or 3D vehicle
shapes);
• do more to visually differentiate between the
shapes (e.g., square and circle) to make them to be
more salient, so the user can distinguish among
them and consequently among the different road
users (e.g., pedestrian, vehicle) surrounding the
ego-vehicle;
• expand the colour codes associated to the
graphical elements to enhance the users’ ability to
detect the difference between them;
SUaaVE 2021 - Special Session on Research Trends to Enhance the Acceptance of Automated Vehicles
246

• use a more realistic view of the simulated scenario
external to the vehicle. For example, instead of the
radar grid, consider to use a lanes representation,
which is more familiar to drivers’ mental model
and creates less visual cluttering;
• reduce the latency time in s1 sector of the HMI to
avoid the perception of a delay in the system’s
ability to detect obstacles;
• Avoid flickering in the graphical elements, which
can be annoying and distracting.
Area C (s4)
Evaluate moving the indication of position into
Area A, to be more consistent with the navigator
mental model users have
Area D
Regarding this area the following changes were
identified:
• do more to differentiate the signs of different
domains to minimize issues with signs
comprehension, for example road signs, weather
conditions, road types;
• associate relevant events occurring in the external
scenario with the displayed signs. For example,
when there is a crossroad in the external scenario,
display the crossroad sign on the SUaaVE HMI
prototype in the proper road sign dedicated sector.
5 GENERAL DISCUSSION
The SUaaVE first loop user test was fundamental to
understand if the methodology was adequate and
could provide sufficient feedback to redesign the
HMI for the second loop test.
The mixed (physical and virtual) apparatus used
to evaluate the usability of the HMI first version had
pros and cons.
In fact, it allowed participants to experience the
sensation of the automated driving of an AV and the
HMI, even if on a video basis. The displayed scenario
(e.g., urban, highway) and the relative use cases (e.g.,
crossroads, pedestrians, other vehicles manoeuvres,
traffic lights, roundabouts, road signs, vehicle
overtaking) were adequate for participants to project
themselves in the use of an automated vehicle, and to
collect very interesting data on the usability interface
issues.
On the other side though, it was not easy for
participants to fully experience the role of HMI in the
automated vehicle and express a preference without
interacting with a real HMI prototype.
In the second test loop, the HMI will be integrated
on the vehicle physical mock-up, positioning the
tablet (visualising the HMI) in the central upper part
of the dashboard, where a real central head-unit
typically is. This way participants will have the
opportunity to interact with the HMI.
Moreover, to enhance the fidelity of the
simulation, the second loop test will be performed
with the low level VHCD, and the participants will be
able to interact with the simulator, instead of
watching a video only and three 55” screens will be
used to create an immersive external environment.
This testing method (video based) remains
interesting at the beginning of the design process, as
in this instance for the SUaavE project and in such
situations where there is a need to conduct tests with
users remotely (e.g., working on international
projects, or realized by remote teams, or to test with
users who stay at home). In fact, although participants
were exposed to a video, from their subjective
comments, it was derived they felt immersed in this
low-fidelity virtual environment. They felt they were
able to appreciate the driving style of the reproduced
automated vehicle or to experience anxiety while
testing this AV and appreciate with the usage the
novelty of the automated driving.
The psychometric instruments and the Thinking
Aloud method were easily understood by participants
and did not cause any issues during testing or data
analysis. These instruments will be used again in the
next experiments.
The duration of the test was found to be long
enough to collect the data and not annoying
participants, so the next experiment will be designed
taking into account this duration as a reference.
6 CONCLUSIONS
Using a mixed-reality method, valuable insights on
participants’ evaluation of the usability of the first
cognitive SUaaVE HMI prototype were obtained.
The first loop test allowed highlighting pros and
cons of the HMI prototype.
Thanks to the identification of aspects considered
‘not intuitive’ or ‘less useful’, etc., recommendations
to enhance the usability of the HMI, were suggested.
The results will be useful to the redesign of the
SUaaVE HMI, as stated in the Human-Centered
Design process (ISO 9241-210:2010).
Moreover, the interesting lesson learned on the
methodological side on the video-based experiment
will be useful for possible next usability remote
evaluation needs it might occur in the future.
Usability Assessment of a Smart Cognitive Assistant for Automated Driving
247

ACKNOWLEDGEMENTS
The paper presents the first user testing loop of the
first version of the cognitive HMI prototype of the
project SUaaVE (SUpporting acceptance of
automated VEhicle), funded from the European
Union’s Horizon 2020 Research and Innovation
Programme under Grant Agreement No 814999.
We would like to thank the SUaaVE coordinator
Nicolas Palomares and all the partners for the positive
and interesting exchange during the project activities.
REFERENCES
Campbell, J. L., Richman, J. B., Carney, C., and Lee, J. D.
(2004). In-vehicle display icons and other information
elements. Volume 1: Guidelines (Report No. FHWA-
RD-03-065). McLean, VA: Federal Highway
Administration.
Capgemini Research Institute (2019, May 9). The
autonomous car. A consumer perspective.
Retrieved July 30, 2021, from https://www.capgemini.com/
news/the-autonomous-car-report/
Kyriakidis, M., de Winter, J. C. F., Stanton, N., Bellet, T.,
van Arem, B., Brookhuis, K., Martens, M. H. Bengler,
K., Andersson, J., Merat, N.; Reed, N., Flament, M.,
Hagenzieker, M. & Happee, R. (2019). A human factors
perspective on automated driving. Theoretical Issues in
Ergonomics Science, 20, 223-249.
International Organization for Standardization (2014).
Graphical symbols - Test methods - Part 1: Method for
testing comprehensibility. Genève: ISO (ISO 9186-
1:2014).
International Organization for Standardization (2010).
Ergonomics of human-system interaction Part 210:
Human-centered design for interactive systems.
Genève: ISO. (ISO 9241-210:2010).
Lewis, C. H. (1982). Using the "Thinking Aloud" Method.
In Cognitive Interface Design (Technical report). IBM.
RC-9265.
Rubin, J., & Chisnell, D. (2008). Handbook of usability
testing: How to plan, design, and conduct effective
tests. Indianapolis, IN: Wiley Pub.
Tétard, F., & Collan, M. (2009). Lazy User Theory: A
Dynamic Model to Understand User Selection of
Products and Services. 2009 42nd Hawaii International
Conference on System Sciences, 1-9.
Venkatesh, V., & Bala, H. (2008). Technology Acceptance
Model 3 and a Research Agenda on Interventions.
Decision Sciences, 39, 273–315.
Venkatesh, V., Thong, J. Y. L., & Xu, X. (2012). Consumer
acceptance and use of information technology:
Extending the unified theory of acceptance and use of
technology. MIS Quarterly, 36, 157-178.
SUaaVE 2021 - Special Session on Research Trends to Enhance the Acceptance of Automated Vehicles
248
