
Towards Services Profiling for Energy Management in
Service-oriented Architectures
Jorge Andrés Larracoechea
1a
, Philippe Roose
1b
, Sergio Ilarri
2c
, Yudith Cardinale
3d
,
Sébastien Laborie
1e
and Mauricio Jacobo González
1f
1
LIUPPA/E2S, Université de Pau et des Pays de l’Adour, Anglet, France
2
Instituto de Investigación en Ingeniería de Aragón /I3A, Universidad de Zaragoza, Zaragoza, Spain
3
Dpto. de Computación y T.I., Universidad Simón Bolívar, Caracas, Venezuela
silarri@unizar.es, ycardinale@usb.ve
Keywords: Energy Management, Service-oriented Architecture, Green Software, ICT, Mobile Computing.
Abstract: Even though hardware architects have managed to incrementally mitigate energy consumption in information
and communication technology devices, it will always be a requisite for software execution. This has
motivated researchers to develop a limited amount of methodologies that promote green software
development and its philosophy, with new assessment methods for calculating the energetic costs of software
development and software execution. In spite of this, they have been acknowledged and adopted with limited
success, as they try to address highly-volatile variables (like human behavior) and environments with specific
hardware/software platforms and language-centric solutions. This has created a conflict between theory and
practice where, otherwise, a generic and adaptive approach could manage the discord. In this paper, we present
a brief review of available selected research in relation to services’ requirements definition and profiling for
energy management, as well as the limitations and advantages of existing proposals in relation to green
software development. Furthermore, we present our progress towards a series of properties to define services’
requirements and their resource consumption behavior. Our final goal is to create a proper approach for energy
management from the analysis and design phases of the Software Development Life Cycle using Service-
Oriented Architectures as a platform for our work.
1 INTRODUCTION
Our current global economy, which usually
measures societies’ progress in economic growth,
has proved to be an unsustainable model (“Growth
without economic growth—European Environment
Agency”, 2021). Its reliance on natural resources
extraction and transformation to provide the goods
and services we consume has environmental
consequences we incrementally see signs of, usually
in the form of metrics. For instance, the “Earth
Overshoot Day” provides us with a specific
estimated day within a year when natural resources
a
https://orcid.org/0000-0002-2353-3112
b
https://orcid.org/0000-0002-2227-3283
c
https://orcid.org/0000-0002-7073-219X
d
https://orcid.org/0000-0002-5966-0113
e
https://orcid.org/0000-0002-9254-8027
f
https://orcid.org/0000-0002-4001-5026
capable of being regenerated by nature (relative to
that year) are consumed (“About Earth Overshoot
Day—#MoveTheDate of Earth Overshoot Day”,
2021). Despite the effort invested so far to reduce
our consumption, we usually reach this day earlier
in the year (“Past Earth Overshoot Days—
#MoveTheDate of Earth Overshoot Day”, 2021).
The common consensus is that the global reduction
of our overall consumption and general rhythm of
consumption of natural resources is the best strategy
against environmental strain. The reality of the ICT
(Information and Communication Technologies)
field is, however, contrary to this notion, as an
Larracoechea, J., Roose, P., Ilarri, S., Cardinale, Y., Laborie, S. and González, M.
Towards Services Profiling for Energy Management in Service-oriented Architectures.
DOI: 10.5220/0010718600003058
In Proceedings of the 17th International Conference on Web Information Systems and Technologies (WEBIST 2021), pages 209-216
ISBN: 978-989-758-536-4; ISSN: 2184-3252
Copyright
c
2021 by SCITEPRESS – Science and Technology Publications, Lda. All rights reserved
209

enormous amount of ICT devices dedicated to both
consumer and enterprise markets are being
manufactured and deployed into our global network.
For instance, the number of smartphones sold to end
users in 2020 alone amounted to 1.38 billion of units
(“Cell phone sales worldwide 2007-2020”, 2021).
Even though the energy consumption of ICT
hardware has been drastically mitigated before, such
as the reduction of electrical consumption per
gigabyte of mobile data transmitted from 12.34 kWh
in 2010 to an estimated magnitude < 0.1 kWh in
2020 in Finland alone (Pihkola, Hongisto, Apilo, &
Lasanen, 2018), software will always rule the energy
consumption of hardware. Nevertheless, software
can be designed with different architectures for
different platforms and there are not two
applications that consume exactly the same quantity
of energy, even on an equal hardware platform. Due
to this, ICT researchers are concerned with
controlling the behavior of software and how it is
conceived due to the high level of heterogeneity in
both hardware and software platforms, and an
increasing research interest on the problem of
energy consumption due to the current global
environmental crisis. Their response was
segmenting the topic into a branch of studies called
Green Software Development (GSD). Some of the
efforts in this field have produced energy-saving
software development methodologies and methods
that can be catalogued into three sub-categories
(Acar, 2017): green with software, green within
software, and green software. Green with software
sets the goal as the creation of software that provides
frugal solutions by accounting for the variables
surrounding the problem. Green within software
seeks to reduce the power consumption of software
using an efficient power model. Finally, Green
software development methodologies establish
guidelines for all the variables outside and within the
Software Development Life Cycle (SDLC) to reduce
its negative impacts on society, economy, and the
environment. In this paper, we focus on the design
of software applications with the philosophy of
reusable units of software that the software
architectural pattern of Service-Oriented
Architectures (SOA) provides as its core. We expect
to use the economies of scale produced by this
architecture to our advantage for building up energy
savings. This is so especially in the current mobile
paradigm that places computational resources
almost everywhere, at the cost of limited execution
time and reduced performance. The contribution of
this work, to summarize, is two-fold: (i) a brief
overview of recent and relevant studies related to
energy management and assessment for or in
software along the SDLC, as well as in relation to
SOA and (ii) a brief introduction to our on-going
work on a set of properties to define the resource
consumption behavior of services from the analysis
and design phases of the SDLC.
In Section 2, we present background concepts on
the Service-Oriented Architecture. In Section 3, we
explore related works available for software energy
assessment and energy management, as well as the
ones related to energy management in SOA. In
Section 4, we introduce our behavior-based
consumption profiles to conclude the article with a
summary of our findings as well as our future work
and associated challenges in Section 5.
2 SERVICE-ORIENTED
ARCHITECTURES
Software applications can be conceived with any
architectural pattern that suits its context. It is
normally defined during the design phase of the
SDLC and they, as defined by Pressman et al.
(Pressman & Maxim, 2014) “address an application-
specific problem within a specific context and under
a specific set of limitations.” For the purpose of our
work, the architecture we focus on and use as a
theoretical framework for our work is the SOA. It
consists of an application composed of smaller units
of software called services. Each service is
constituted by the code and data to perform a
specific business function, and their interfaces
provide a loose coupling among them (IBM Cloud
Education, 2019). This architecture provides
advantages such as the reuse of pre-existing
services, an easy discoverability process of pre-
available services ready to be consumed, and
abstraction from the physical implementation of a
service with pre-existing interfaces. We believe that
SOA is a good platform for our initial conceptual
work, as it allows us to narrow our perspective to
pieces of software that can be attributed descriptions
of what resources they consume and how/when they
consume them; their behavior-based consumption.
The inclusion of an identification and discovery
phase within SOA also leads us to think how
identifying the services according to their behavior-
based consumption during this phase can result in a
more energy-efficient selection and configuration;
this is out of the scope of this paper and will be the
subject of a future work.
WEBIST 2021 - 17th International Conference on Web Information Systems and Technologies
210

3 RELATED WORK
We selected some of the available existing research
works based on its relation to energy assessment and
resources management in software to evaluate their
pertinence to Green Software, and to understand
where most of the available methods are meant to be
used within the SDLC. Some of these methods and
approaches focus on trying to understand the impact
of system settings (Peltonen, Lagerspetz, Nurmi, &
Tarkoma, 2015), assessing or ranking the
consumption of apps (Behrouz, Sadeghi, Garcia,
Malek, & Ammann, 2015; Oliner, Iyer, Stoica,
Lagerspetz, & Tarkoma, 2013; Pathak, Hu, & Zhang,
2012), analyzing power consumption with testbeds
(Hindle et al., 2014), performing code analysis
(Aggarwal, Hindle, & Stroulia, 2015; Hao, Li,
Halfond, & Govindan, 2013; Manotas, Pollock, &
Clause, 2014; Pathak et al., 2012), and analyzing the
consumption of system calls in the evolution of
software (Aggarwal et al., 2015).
Figure 1: Distribution of the selected research along the
SDLC.
On the one hand we can conclude that, within the
works we selected, the research from the
development to the deployment/maintenance phases
of the SDLC has been mostly taken care of regarding
energy assessment and management, as seen in Fig.
1, but we observed a lack of research that provides
accessible guidelines or tools from the analysis phase,
noticed previously in the literature by Georgiou et al.
(Georgiou, Rizou, & Spinellis, 2019). On the other
hand, some approaches for the design phase exist, but
they require additional development (Bunse,
Gottschalk, Naumann, & Winter, 2013).
Furthermore, we encountered a pattern among the
works studied: the topics of green software and
energy savings are mentioned, but the approaches and
methods do not seem to be included within a complete
green software methodology that intends to be used
along the whole SDLC, and their objective is, mostly,
being green within software.
After drawing the conclusions above, we
researched available works that related SOA to green
software or energy management. Both of them are,
overall, not mentioned in the literature related to
SOA, as a previous literature review (Niknejad et al.,
2020) demonstrated. A notable exception is the work
published by Ibrahim Naseem (Ibrahim, 2015), that
tackles the problem of ranking energy-aware services.
This work, in contrast to others, introduces an
Energy-Aware Service Oriented Architecture
(EASOA) that provides formal definitions for
Energy-Aware Services (EAS) using a model-based
specific notation. An Energy-Aware Service Mapper
takes the requests and provides matches that meet the
requester’s requirements. He also introduces a
ranking algorithm that considers the amount of
energy consumed by a service in the ranking process.
Ibrahim Naseem provides definitions and a services
matching approach according to energy consumption
and requirements, which we find interesting.
However, the service definition process requires a
deep knowledge from the designer to understand how
to properly implement it, and the approach, as well as
the model, have not been validated yet.
We believe that a unified definition of energy
consumption that takes into account the demand of
resources and the interactions of a service,
considering a single profile, in addition to a modeling
approach accessible to all levels of expertise, is a step
forward towards the democratization of Green
Software methods and their philosophy. This is not a
small feat as it involves convoluted concepts that
need to be re-thought for each level of granularity,
and it requires tools and design processes tailored for
each level of expertise to be truly accessible to
anyone. Our main (long term) objective is to provide
a comprehensive approach for designing energy-
efficient services (or units of software), accessible at
any level of expertise and within the scope of a Green
Software methodology, covering the existing
scientific gap within the GSD domain and
incorporating other tools and techniques along the
SDLC that promote further development.
4 DEFINITION OF A
BEHAVIOR-BASED
CONSUMPTION PROFILE
As a first contribution towards our goal, we introduce
the initial version of our Behavior-Based
Consumption Profile (BBCP). A BBCP is a complete
outline of attributes that constitute a single descriptive
instance (profile) of a unit of software. It is meant to
describe what, how and when a service (or any unit of
Towards Services Profiling for Energy Management in Service-oriented Architectures
211

execution of software, in general) consumes its host’s
available computational resources, and interacts with
its environment in the host system. To summarize: it
is a profile of the resource consumption a unit of
software exhibits based on its behavior, whose energy
consumption can be assessed. This concept is highly
important for our work because, in our view and in
contrast to previous works, an approach accessible to
designers and software architects of any level of
expertise will positively affect the adoption of
energy-saving techniques, which in turn could
(eventually) drive the overall energy consumption of
systems down by building up energy savings using
economies of scale. In other words, we believe in
guiding designers and architects of any level of
expertise from the analysis and design phases of the
SDLC with suitable outlines to create profiles for
services. These profiles (after being assessed) will
identify services (or, in general, any unit of software)
according to their behavior-based consumption,
which will lead us to save energy by better tuning the
criteria for identification and selection of the most
appropriate services to consider when building whole
applications. Especially when integrating this
profiling technique within a full-stack green software
development methodology that can benefit from it
throughout the SDLC (Roose, Ilarri, Larracoechea,
Cardinale & Laborie, 2021).
This profile, as mentioned before, is constituted of
properties that represent the behavior of consumption.
The process we followed to define the properties that
constitute our initial version is: (1) we evaluated and
created a compilation of characteristics that describe
software, inspired by a specific selection of
publications by other authors, based on what we
though relevant to our topic (Alotaibi, Furnell, &
Clarke, 2015; Nickerson, Muntermann, Varshney, &
Isaac, 2009; Pandey, Litoriya, & Pandey, 2019); (2)
we used them to abstract an outline of properties we
deemed appropriate for testing, in addition to other
properties we defined by experience; (3) we then
chose a source for the most popular applications
available worldwide (Jones, 2020) in order to gather
a representative selection of software types and
popular software architectures; (4) we chose a
random sample from the selection in step 3; (5) after
selecting the sample, we studied in detail its
architecture and its business goals, and conceptually
decomposed it into smaller service-like units; (6) each
unit underwent a profiling process by attributing the
version of the properties available at the time to it; (7)
we analyzed the shortcomings of the properties used
as well as properties we missed, and improved them
to create a new version of our set of properties; (8) we
improved each version of our properties by iterating
over steps 4 to 7 with several samples of software.
Below, our current collection of properties is briefly
described and explained in relevance to energy
consumption. Currently, they are expressed mostly in
a qualitatively way as a first step towards a finer
granularity, where more detailed definitions of
quantitative models will be created in the future.
BBCP Properties:
1- Service data flow: this qualitative property refers
to the consistency of the data flow, where
consumption of data can be, or not, interrupted. It
helps us to identify when energy management
strategies can be applied.
Possible values:
Regular: data flow cannot have interruptions.
Irregular: data flow can be interrupted.
Example: A video game streaming service behaves
differently to a video streaming service. In a video
game streaming service, a regular data flow is
required because the perceived QoS (Quality of
Service) by the customer relies on constant frames
delivered to him/her, which are directly related to
his/her input. A video streaming service can apply
techniques, such as prefetching, to provide the
illusion of a constant stream, but in reality data can be
prefetched at different times, as there is no reaction
like the one present in video game streaming services.
2- Service data flow direction: complementary to
the service data flow property, this qualitative and
quantitative property defines whether data flow goes
one-way or two-ways. It describes a relationship of
energy consumption between or among services and
the transfer rate.
Possible values:
Unidirectional: data flow either from the service, or
to the service.
Bidirectional: data flow from and to the service.
Units of magnitude: MB/s
Example: Continuing the example of the previous
property, a video game streaming service has a
regular bidirectional data flow, while a video
streaming service has, mostly, an irregular
unidirectional data flow. The pivot point for the
decision in this example is the input of the user, which
is close to none in the latter in relation to the former,
as the latter acts solely as a provider.
3- Service data handling: this qualitative and
quantitative property establishes what is done to data
WEBIST 2021 - 17th International Conference on Web Information Systems and Technologies
212

after using them as well as determining the fate of the
results the service generates. It also aims at making
an assessment of storage consumption possible in the
future.
Possible values:
Keep source: the service stores the original data
provided to it after its use.
Keep result: the service stores the results obtained
after using the data. This should not be confused as a
greedy scenario where the result cannot be shared
with other services.
Destroy source: the service will not store the original
data provided to it after using it.
Destroy result: the service will not store the results it
generates after using the data.
Destroy both: the service will not store neither the
data nor the results.
Units of magnitude: MB.
Example: A service involved in IoT (Internet of
Things) sensor readings can keep the original data it
receives as a part of a historical data recollection.
However, as an example, certain services could
process the original data and, after pertinent
operations are executed, they could choose not to
store them.
4- Service task distribution: this qualitative
property defines if the computation that a service
performs has to be executed in a single entity or it can
be distributed among several others. It also helps us
to understand where energy is going to be consumed.
Possible values:
Centralized: the computation task has to be hosted in
only one entity.
Distributed: the computation task of a service can be
distributed among several entities.
Example: On the one hand, a cloud rendering service
for 3D scenes can distribute the rendering task among
entities available in the cluster. On the other hand, a
real-time strategy video game service needs to run
exclusively in the entity responsible for the
application, due to time constraints such as network
and hardware latency or hardware input/output
latency.
5- Service computation criticality: this qualitative
and quantitative property is meant to define if the
computational results are tied to a time constraint.
Knowing there is a time constraint, we can manage
the service to, as an example, be hosted by the most
energy-efficient, computationally-fastest and
possibly physically-closest host.
Possible values:
Low: no important time constraint is present.
Medium: a significant time constraint is present.
High: a critical time constraint is present.
Units of magnitude: one of the possible qualitative
values above, and a unit of time such as seconds.
Example: A reinforcement learning service could
have a high computation criticality in order to
maximize the expected return based on time-limited
tasks (Pardo, Tavakoli, Levdik, & Kormushev, 2018),
whereas a neural network performing supervised
learning could lack a critical time constraint.
6- Service computational complexity: this
qualitative and quantitative property establishes an
amount of computation required to accomplish the
goal of a service. It could aid in the estimation of the
energy cost the execution of a service implies.
Possible values:
Low: the service requires an insignificant amount of
CPU resources to perform its operations.
Medium: the service requires a relatively important
amount of CPU resources to perform its operations.
High: the service requires a significant amount of
CPU resources to perform its operations.
Units of magnitude: even though the qualitative
values above provide a rough conceptual estimate,
they should be considered as variables with defined
ranges in MHz and GHz in order to provide a logic
for significant assessment.
Example: On the one hand, a 3D rendering service
can be valued with a high complexity, as it usually
consumes a big portion of the CPU capabilities. For
instance, an image rendering engine called Keyshot
maintains a workload above 98% when using CPU +
GPU rendering (Jensen, 2020). On the other hand,
MP3 playback should be catalogued with a low
complexity, as it does not demand a lot of CPU cycles
relative to the previous example.
7- Service access frequency: this qualitative and
quantitative property is meant to define a degree of
predictability concerning how often the service could
be accessed/required. It could also provide a rough
Towards Services Profiling for Energy Management in Service-oriented Architectures
213

estimate of energy consumption within a defined
time.
Possible values:
Regular: there is a high predictability or specific
frequency within a period of time in which the service
is invoked/accessed/required.
Irregular: there is no predictable interval within which
the service could be invoked/accessed/required.
Units of magnitude:
Regular: a rate composed of accesses over a unit of
time i.e.: 20 accesses per second
Irregular: a probability value between 0 and 1
concerning a specific time interval. The probability
should be considered within a specific margin of an
elapsed unit of time.
Example: An IoT sensor assessment service could
have a regular access frequency of 30 accesses per
second. In contrast, an instant messaging service
could have an irregular access frequency of 0.5 every
5 minutes because it is determined by user behavior.
8- Service consumption rate: qualitative and
quantitative property that specifies a defined
consumption rate. It can also be understood as “ how
long”, whereas the access frequency is “how often”.
Possible values:
Definite: the consumption of a service has a well-
defined duration.
Indefinite: the consumption of a service has an
indefinite duration, as it might depend on external
factors.
Units of magnitude: any unit of time.
Example: A media streaming service can have a
defined consumption constrained to the amount of
time it takes to transfer the required media, which has
a defined size. In contrast, a gaming streaming service
has an indefinite consumption rate, as it depends on
the user behavior.
9- Service depth: this property defines an execution
level for the service within the system the application
executes in. It also allows us to know if energy
management strategies can be applied to the service
without detriment to the user.
Possible values:
Foreground: the service is directly perceived by the
user.
Background: the service is not directly perceived by
the user.
Example: A service responsible for displaying
metrics of a company's finances to the user belongs to
the foreground, while a service that determines the
location of the user and does not update or gather
important information for the GUI is considered a
background service.
10- Service dependence: this property establishes
whether the service is subject to any relationship with
others.
Possible values:
Dependent: the service depends on either another
service or other services.
Independent: the service does not depend on any
other service or services.
Dependee: either another service or other services
rely on this service being profiled.
Example: A weather prediction service can depend
(dependent) on a weather tracking service
(dependee). The case of a sensor reading service
dedicated to the collection of data could be an
example of a totally isolated service (independent).
Once we concluded the definition of the properties
used to comprise our initial version of the BBCP, we
decided to classify them among categories based on
consumption. The objective of this classification is an
easier understanding of what resources they relate to.
Furthermore, the classification allowed us to pinpoint
faster the properties meant to be used at a given stage
of profiling. As of now, we have created 3 categories
under the following logic:
• Data centric group: properties that describe
the relation between the service and the data
it consumes or generates.
• Computation centric group: properties
that describe how the service behaves in
relation to computational requirements,
needs, and goals.
• Conduct centric group: properties that
relate to the host entity and other services.
Even though we consider that these three criteria for
classification could enclose (as of now) our
properties, some classifications implied their
WEBIST 2021 - 17th International Conference on Web Information Systems and Technologies
214
placement into more than one category. The current
distribution corresponds to the one shown in Table 1.
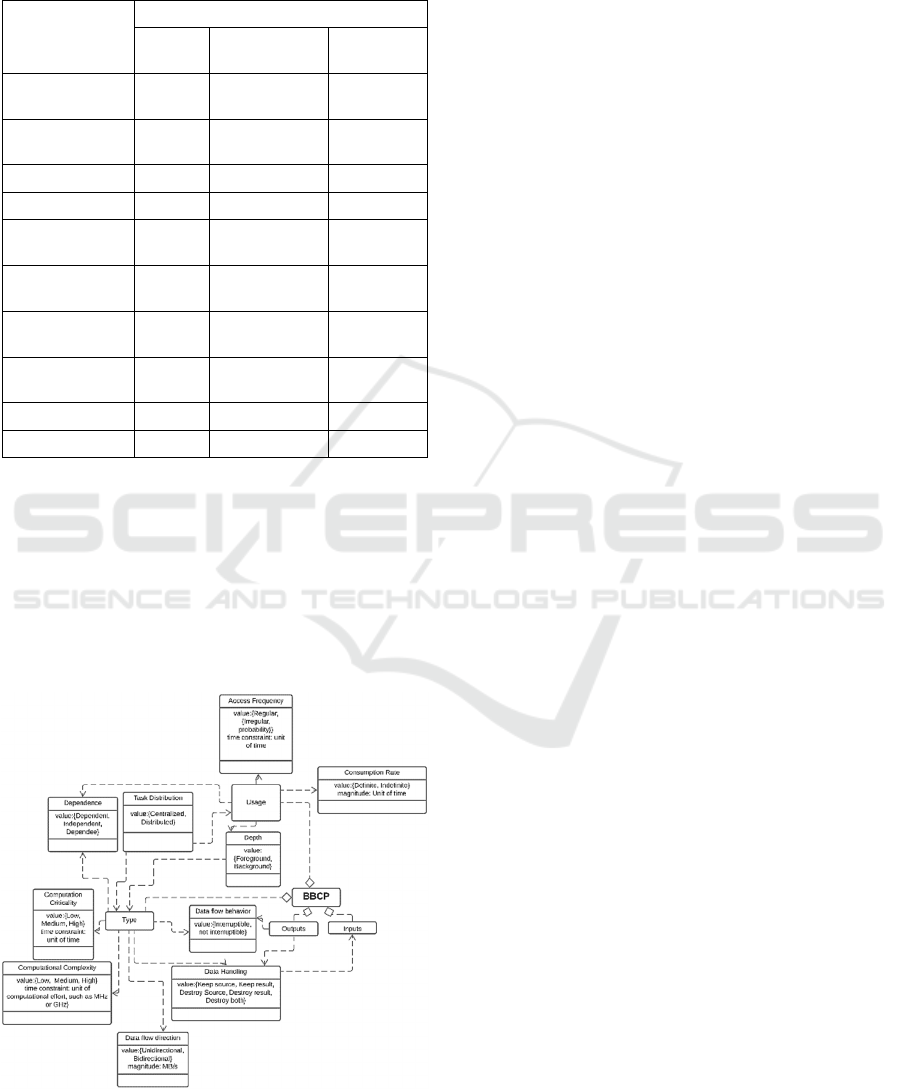
Table 1: Service’s Properties distributed among groups.
Properties
Categories
Data
centric
Computation
centric
Conduct
centric
Data flow
behavior
x
Data flow
direction
x
Data handling x x
Task distribution x x
Computational
criticality
x
Computation
complexity
x
Access
frequency
x
Consumption
rate
x x
Depth x
Dependence x
We expect the result of using this BBCP approach to
be more energy-aware services that comprises a more
energy-aware application when chosen smartly.
Before integrating a complete BBCP, we will deal
with a great effort towards ensuring a precise meta-
model with accurate definitions of levels of expertise
linked to the level of the requirements, beginning with
our current model based on properties explained
above, visible in Fig. 2.
Figure 2: Our on-going model for BBCP and the properties
described in this article.
5 CONCLUSIONS AND FUTURE
WORK
In this paper, we performed an overview on selected
existing literature and found in it a lack of research in
the field of green software, especially in energy
assessment and management from the analysis and
design phases of the SDLC and energy management
in SOA. We also presented our initial version of our
Behavior-Based Consumption Profile, which is an
outline of properties to create profiles that describe
the consumption behavior of a service. We believe
that after the BBCP undergoes a full validation
process and gains traction with the appropriate tools
to create and assess them, it will aid designers and
developers of any expertise to design more energy-
aware services from the analysis and design phases of
the SDLC and raise awareness concerning the
importance of energy efficiency and management.
Some of our future work includes:
• Validation and usability testing of a more
accurate version of the BBCP to confirm its
usefulness for accessible profiling and the
creation more energy-efficient services.
• Creation and validation of a BBCP dedicated
exclusively to data and its role within the scope
of energy consumption of services.
• Creation of a workflow in an IDE (Integrated
Development Environment) to aid in the creation
and deployment of BBCPs for assessment and
final evaluation.
• Provide energy management strategies for
services and data based on our findings.
There is still a long road ahead towards producing an
approach that manages to achieve the ambitious goal
of ease of use and efficacy, but we believe our future
work will contribute to the cause and goal of energy
savings for a better future.
ACKNOWLEDGEMENTS
This research has been supported by the project
PID2020-113037RB-I00 (AEI) and the Government
of Aragon (Group Reference T64_20R, COSMOS
research group).
REFERENCES
About Earth Overshoot Day—#MoveTheDate of Earth
Overshoot Day. (n.d.). Earth Overshoot Day. Retrieved
Towards Services Profiling for Energy Management in Service-oriented Architectures
215

July 26, 2021, from https://www.overshootday.org/
about-earth-overshoot-day/
Acar, H. (2017). Software development methodology in a
Green IT environment. Université de Lyon.
Aggarwal, K., Hindle, A., Stroulia, E. (2015).
GreenAdvisor: A tool for analyzing the impact of
software evolution on energy consumption. In: 2015
IEEE International Conference on Software
Maintenance and Evolution (ICSME). pp. 311–320.
Alotaibi, S.S., Furnell, S., Clarke, N. (2015). A Fine-
Grained Analysis of User Activity on Mobile
Applications: The Sensitivity Level Perception.
Behrouz, R.J., Sadeghi, A., Garcia, J., Malek, S., Ammann,
P. (2015). EcoDroid: An Approach for Energy-Based
Ranking of Android Apps. In: 2015 IEEE/ACM 4th
International Workshop on Green and Sustainable
Software. pp. 8–14.
Bunse, C., Gottschalk, M., Naumann, S., Winter, A. (2013).
2nd Workshop EASED@BUIS 2013 - Energy Aware
Software-Engineering and Development. Presented at
the Softwaretechnik-Trends, April 25.
Cell phone sales worldwide 2007-2020. (2021). Statista.
Retrieved March 15, 2021, from https://www.statista.
com/statistics/263437/global-smartphone-sales-to-end-
users-since-2007/
Georgiou, S., Rizou, S., Spinellis, D. (2019). Software
Development Lifecycle for Energy Efficiency:
Techniques and Tools. ACM Comput. Surv. 52 1–33
Hao, S., Li, D., Halfond, W.G.J., Govindan, R. (2013).
Estimating mobile application energy consumption
using program analysis. In: 2013 35th International
Conference on Software Engineering (ICSE). pp. 92–
101.
Hindle, A., Wilson, A., Rasmussen, K., Barlow, E.J.,
Campbell, H.V., Romansky, S. (2014). GreenMiner: a
hardware based mining software repositories software
energy consumption framework. In: MSR 2014.
IBM Cloud Education: soa. (2019). https://www.ibm.com/
cloud/learn/soa.
Ibrahim, N. (2015). Ranking Energy-Aware Services. In:
2015 IEEE International Conference on Smart
City/SocialCom/SustainCom (SmartCity). pp. 575–580.
Jones, K. (2020). Ranked: The World’s Most Downloaded
Apps, Visual Capitalist, https://www.visual
capitalist.com/ranked-most-downloaded-apps/.
Manotas, I., Pollock, L., Clause, J. (2014). SEEDS: a
software engineer’s energy-optimization decision
support framework. In: Proceedings of the 36th
International Conference on Software Engineering. pp.
503–514. Association for Computing Machinery, New
York, NY, USA.
Nickerson, R., Muntermann, J., Varshney, U., Isaac, H.
(2009). Taxonomy Development In Information
Systems: Developing A Taxonomy Of Mobile
Applications. HAL Work. Pap.
Niknejad, N., Ismail, W., Ghani, I., Nazari, B., Bahari, M.,
Hussin, A.R.B.C. (2020). Understanding Service-
Oriented Architecture (SOA): A systematic literature
review and directions for further investigation. Inf. Syst.
91 101491.
Oliner, A., Iyer, A., Stoica, I., Lagerspetz, E., Tarkoma, S.
(2013). Carat: collaborative energy diagnosis for
mobile devices.
Pandey, M., Litoriya, R., Pandey, P. (2019). Perception-
Based Classification of Mobile Apps: A Critical
Review. In: Luhach, A.K., Hawari, K.B.G., Mihai, I.C.,
Hsiung, P.-A., and Mishra, R.B. (eds.) Smart
Computational Strategies: Theoretical and Practical
Aspects. pp. 121–133. Springer, Singapore.
Pathak, A., Hu, Y.C., Zhang, M. (2012). Where is the
energy spent inside my app? fine grained energy
accounting on smartphones with Eprof. In: Proceedings
of the 7th ACM european conference on Computer
Systems. pp. 29–42. Association for Computing
Machinery, New York, NY, USA.
Peltonen, E., Lagerspetz, E., Nurmi, P., Tarkoma, S. (2015).
Energy modeling of system settings: A crowdsourced
approach. In: 2015 IEEE International Conference on
Pervasive Computing and Communications (PerCom).
pp. 37–45.
Pressman, R.S., Maxim, B. (2014). Software Engineering:
A Practitioner’s Approach., New York, NY.
Roose, P., Ilarri, S., Larracoechea, J. A., Cardinale Y., &
Laborie, S. (2021). Towards an Integrated Full-Stack
Green Software Development Methodology. In:
Information Systems Development: Crossing
Boundaries between Development and Operations
(DevOps) in Information Systems (ISD2021
Proceedings). Valencia, Spain: Universitat Politècnica
de València.
WEBIST 2021 - 17th International Conference on Web Information Systems and Technologies
216
