
Perception and Adoption of Customer Service Chatbots among
Millennials: An Empirical Validation in the Indian Context
Himanshu Joshi
a
International Management Institute, New Delhi, India
Keywords: Chatbots, UTAUT, Trust, Security, Adoption, Satisfaction, Millennials, India.
Abstract: The last decade is witness to several successful automation efforts like customers service chatbots. Besides
reducing costs for companies, chatbots saves time, effort, and enhances customer experience. Millennials
being aspirational, educated and technology savvy find chatbots suited to the way they seek information.
While there are several studies on technology adoption, work on chatbot adoption among millennials is scanty.
The purpose of this study is to examine the factors which influence user intention, adoption and satisfaction
related to chatbots. Hence, the objective is to develop a conceptual model through the extension of the Unified
Theory of Acceptance and Use of Technology (UTAUT) in the context of chatbot adoption. A mixed method
approach was employed characterized by qualitative data collection through five personal interviews followed
by a quantitative web-based survey. The data was collected from 60 users of chatbot applications. The
proposed model depicting 13 hypothesized relationships was estimated using the partial least squares-
structural equation modelling (PLS-SEM) approach. The results show that performance expectancy and social
influence significantly influence behavioural intention. Trust and facilitating conditions were found to impact
satisfaction significantly. With respect to adoption, facilitating conditions, satisfaction and behavioural
intention were found to have a positive but insignificant impact.
1 INTRODUCTION
The last decade is witness to the increasing popularity
of chatbots due to advancements in technology
innovations like artificial intelligence and natural
language processing. Gone are the days when
organizations used to route their consumer concerns
or complaints directly to their call centers executives.
Chatbots have emerged as an intermediary layer
between the user and the customer care executives
which filters and redirects the concerns depending on
its intelligence. A chatbot also known as
conversational agents is a software program that
simulates and mimics human conversations through a
website or an application and helps users in finding
relevant answers to their concerns. These programs
continuously learn, evolve, and adapt to user
requirements and offer high degree of personalized
experience which makes it appear as highly personal,
smart, useful, and responsive. As per BusinessInsider
(2019), the chatbot market size is projected to grow at
a
https://orcid.org/0000-0002-4774-7983
a CAGR of 29.7% from USD 2.6 billion in 2019 to
USD 9.4 billion by 2024.
Due to the advantages associated with chatbots, it
is emerging as a preferred medium in the customer
service domain. Factors like technology
advancements, demand for self-service and the
convenience of 24/7 assistance are fuelling the
growth of chatbots. According to the Chatbots
Magazine (2018) State of Chatbots Report 2018, the
most common frustrations reported by consumers
included hard to navigate websites (34%), inability to
get answers to simple questions (31%), and difficulty
in finding essential details about a business (28%).
Due to the inherent benefits, numerous customer
service chatbot applications have come up catering to
various industries like banking, insurance, food
delivery, online retail, hospitality, education,
healthcare, ticket bookings to name a few. However,
there are various factors which restrict the growth of
this market. These include lack of awareness about
chatbot applications, low technology skillset, access
Joshi, H.
Perception and Adoption of Customer Service Chatbots among Millennials: An Empirical Validation in the Indian Context.
DOI: 10.5220/0010718400003058
In Proceedings of the 17th International Conference on Web Information Systems and Technologies (WEBIST 2021), pages 197-208
ISBN: 978-989-758-536-4; ISSN: 2184-3252
Copyright
c
2021 by SCITEPRESS – Science and Technology Publications, Lda. All rights reserved
197

to affordable internet, fear about data privacy and
confidentiality etc. According to a US study by
EMarketer (2018), the challenges of using chatbot
included too many unhelpful responses, redirect to
self-serve FAQs, bad suggestions, pop-up chatbot
prompts, unnecessary pleasantries, too long to
respond and lack of personalization. As per Chatbots
Magazine (2019), according to Spiceworks,
respondents reported the following about chatbots:
chatbots often misunderstood the nuances of human
communication (59 percent), chatbots performed
commands inaccurately (30 percent), chatbots had
difficulties in understanding accents (20 percent).
According to Mantra Labs (2019), both businesses
and consumers in India consider telephone and email
as most preferred channels even though average time-
to-resolution through email was 2 hours and 17
minutes. The survey also found that majority (59
percent) of them prefer to talk to an actual person for
customer service needs.
The paper is structured as follows. In the next
section, a brief overview of relevant literature is
provided before detailing the conceptual model and
research hypotheses development, research
objectives and the methodology. Then, the analysis of
data and findings are presented. Conclusion
discussing the managerial and academic implications
are discussed next. The last section presents the
limitations and future research directions.
2 LITERATURE REVIEW
There are various theories and models which explain
the acceptance and adoption of new technologies.
2.1 TAM
The Technology Acceptance Model (TAM) is one of
the most discussed and cited models of technology
adoption which explains why users accept and use a
technology. The model has two key constructs -
perceived ease of use (PEOU) and perceived
usefulness (PU) which explains user attitude,
intention, and actual usage. PEOU is defined this as
"the degree to which a prospective user believes that
using a particular system would be free from effort"
while PU is defined as "the degree to which a
prospective user believes that using a particular
system would enhance his or her job performance"
(Davis et al., 1989). Prior research work (Autry et al.,
2010; Gangwar et al., 2014) have consistently shown
that PEOU and PU explain 40% of the variance in
individuals’ intention to use and subsequent adoption
of a technology. Despite its frequent use by
researchers, TAM is often criticized for diverting
researchers' attention away from other important
research issues and creating an illusion of progress in
knowledge accumulation (Benbasat and Barki, 2007).
2.2 UTAUT
The unified theory of acceptance and use of
technology (UTAUT) is another well cited model to
explain user intention and behaviour associated with
a technology adoption. Proposed by Venkatesh et al.
(2003) it comprises of four constructs: performance
expectancy (PE), effort expectancy (EE), social
influence (SI) and facilitating conditions (FC). EE of
the UTAUT model can be considered as PEOU of the
TAM model as both focus on the ease-of-use aspect.
Similarly, PE is similar PU as both focus on
improving business performance. The UTAUT model
is a result of the synthesis of eight different theories
of technology acceptance: innovation diffusion
theory (IDT), theory of reasoned action (TRA),
theory of planned behaviour (TPB), the social
cognitive theory (SCT), the motivational model
(MM), the model of perceived credibility (PC)
utilisation, technology acceptance models (TAM) and
a hybrid model combining constructs from TPB and
TAM (C-TPB-TAM). A meta-analysis of 74
empirical studies on UTAUT from 2003 to 2013
revealed how parsimonious, accurate, and robust
UTAUT is at predicting acceptance and use of
technology (Khechine and Lakhal, 2016) with
behavioural intention emerging as the most often
measured dependent variable operationalized as a
proxy for system use.
2.3 Cognitive Model of Satisfaction
Oliver (1980) proposed this model which expresses
consumer satisfaction as a function of expectation and
expectancy disconfirmation. In other words,
satisfaction can be viewed as the difference between
user expectations and perceived performance.
According to Liao et al. (2009) system characteristics
of an information system create outcome expectations
which results in positive or negative feelings and in
turn determines user acceptance. The pre- and post-
usage experience results in satisfaction or
dissatisfaction, which is believed to influence attitude
change and purchase intention.
The two primary constructs of TAM and UTAUT,
that is, PEOU/EE and PU/PE can be viewed as
characteristics associated with a chatbot platform
which determines the acceptance, adoption and
WEBIST 2021 - 17th International Conference on Web Information Systems and Technologies
198

subsequent satisfaction. In the present study, the
UTAUT model along with trust and security has been
used.
Table 1: Summary of Recent Studies on Application of
Chatbots.
Author/
Model
PEOU
/EE
PU/
PE
SI FC TR PR
Araujo and
Casais
(2020)/TAM
✓ ✓
Pillai and
Sivathanu
(2020)/TAM
✓ ✓
✓
Chatterjee
and
Bhattacharjee
(2020)/UTA
UT
✓ ✓
✓
✓
Kasilingam
(2020)/UTA
UT2
✓ ✓
✓ ✓
Gansser and
Reich
(2021)/UTA
UT2
✓ ✓ ✓
Notes: PEOU/EE: Perceived Ease of Use/Effort
Expectancy, PU/PE: Perceived Usefulness/Performance
Expectancy, SI: Social Influence, FC: Facilitating
Conditions, TR: Trust, PR: Perceived Risk
3 RESEARCH HYPOTHESES
AND CONCEPTUAL MODEL
To explain the intention and adoption of chatbots
among millennials in India, the UTAUT model is
used as the theoretical basis. The following sub-
sections discussed the development of the hypotheses
to explain user intention, adoption, and satisfaction
with chatbots.
3.1 Effort Expectancy (EE)
Effort Expectancy can be defined as “the degree of
ease associated with the use of the system”
(Venkatesh et al., 2003). Araujo and Casais (2020)
conducted a study involving Portuguese respondents
and used the TAM model to determine customer
acceptance of shopping-assistant chatbots. They
found that PEOU use significantly influences attitude
toward chatbots which further has a positive influence
on behavioural intention. The factor PEOU is
identical to effort expectancy which is defined as the
expected effort required in doing using a chatbot. As
per prior research, PEOU/EE has been reported to
play an important factor in influencing the
behavioural intention for chatbot adoption in
hospitality and tourism (Pillai and Sivathanu, 2020);
higher education (Chatterjee and Bhattacharjee,
2020); online shopping (Kasilingam, 2020). More
recent studies (Nguyen et al.., 2021; Seo and Lee,
2021) have used a similar construct - system quality,
which focuses on the reliability, ease of use, response
time, and availability of chatbot systems. Based on
the literature, the following hypothesis is proposed:
H1: Effort expectancy has a positive influence on the
behavioural intention to use chatbots
3.2 Performance Expectancy (PE)
Performance expectancy is defined as “the degree to
which the user expects that using the system will help
him or her to attain gains in job performance”
(Venkatesh et al., 2003). When users perceive chatbot
services to be helpful (seeking information, online
transactions, prompt responses, practical solutions) it
creates a perception of improved experience resulting
in continuance intention (Nguyen et al., 2021).
Gansser and Reich (2021) employed the constructs of
UTAUT2 model and conducted a study involving
three segments of German chatbot users (mobility,
household and health). They found that performance
expectancy played a significant role in explaining
behavioural intention and use behaviour towards
artificial intelligence products.
Further, if the users feel that the chatbot system is
too complex and requires extensive mental effort, the
effort in learning to use the system may outweigh the
relative benefits associated with it. In other words,
effort expectancy determines the extent to which the
chatbot system would enable the user to better
perform the job and enhance the performance. This
savings in terms of time and effort can be used by the
user for some other job-related activity and enhance
productivity. Davis (1989) provides the justification
and the linkage between PEOU and PU.
Based on the above justification, we propose the
following two hypotheses:
H2: Performance expectancy has a positive influence
on the behavioural intention to use chatbots
H5: Effort expectancy has a positive influence on the
Performance Expectancy to use chatbots
Perception and Adoption of Customer Service Chatbots among Millennials: An Empirical Validation in the Indian Context
199

3.3 Social Influence (SI)
Social Influence can be defined as “the degree to
which an individual perceives that important others
believe he or she should use the new system”
(Venkatesh et al., 2003). As per the theory of
reasoned action (TRA), the behavioural intention is
influenced by an individual positive or negative
feeling which are developed because of the influence
of other individuals known to the subject (Fishbein
and Ajzen, 1975). In technology adoption, this is
referred to as subjective norm which is the degree to
which a user believes that his/her peer group (friends,
superiors) influences the use and adoption behaviour
(Taylor and Todd, 1995). Subjective norms or social
influence can be viewed as informal agreed norms
between the user and social influencers where the
user is expected to comply with the same. It is
believed that stronger is the social influence from the
peer group, the stronger would be the behavioural
intention.
Therefore, this reasoning leads to hypothesize the
following:
H3: Social Influence has a positive influence on the
behavioural intention to use chatbots
3.4 Facilitating Conditions (SI)
Facilitating conditions can be defined as the degree to
which an individual believes that an organizational
and technical infrastructure exists to support use of
the system. It comprises of external factors in the
environment that make an act easy to accomplish
(Thompson et al., 1991) and that exerts an influence
over a person desire to perform a task (Teo et al.,
2007). According to Kasilingam (2020), consumers
are more likely to adopt smartphone chatbots if the
technical infrastructure for it already exists. In
information technology context, it consists of
organizational and technical infrastructure to support
use of the system (Agarwal et al., 2009). Prior
researchers (Lin, 2011; Shaw, 2014) have reported
that facilitating conditions like individual skillset,
availability of affordable internet, smartphones, legal
institutions etc. can influence the intentions of users
in adopting chatbots. According to Chatterjee and
Bhattacharjee (2020), the existence of good quality
technical infrastructure and availability of requisite
user training can facilitate the intention to adopt a new
technology. Based on these arguments we propose the
following hypotheses:
H4: Facilitating Conditions has a positive influence
on the behavioural intention to use chatbots
H6: Facilitating Conditions has a positive influence
on the chatbot adoption
H7: Facilitating Conditions has a positive influence
on the satisfaction with chatbots
3.5 Perceived Risk (PR)
Perceived risk (PR) is commonly thought of as an
uncertainty regarding possible negative consequences
of using a product or service. It can be defined as the
potential for loss in the pursuit of a desired outcome
of using an online service.
Chatbots being a relatively new technology and
users having limited exposure to it may often result
into it being perceived as risky. Since chatbots
simulate conversations with humans over the Internet,
it can be used by hackers to use social engineering
techniques to impersonate themselves and capture
confidential, private and sensitive data. In areas
where there is a need for limited interactivity in terms
of predefined well-structured queries and responses,
a chatbot creates good engagement. However, in
situation where the communication is unstructured,
complex and uncertain, discrepancies in responses
may create confusion in the minds of the user. Hence,
the degree of perceived risk towards chatbot can
influence the trust and the intention to adopt it. It is
logical to believe that a greater perceived risk would
negatively influence the trust and intention towards
chatbots. Thus, we propose that:
H8: Perceived risk has a negative influence on the
behavioural intention to use chatbots
H9: Perceived risk has a negative influence on the
trust associated with chatbots
3.6 Trust (TR)
Baier (1986) considers trust as "the belief that others
will, so far as they can, look after our interests, that
they will not take advantage or harm us”. Trust in
technology can be defined as “a belief that a specific
technology has the attributes necessary to perform as
expected in a given situation”. (McKnight et al.,
2011). It can also be defined as the degree to which
users are confident in the reliability and quality of the
chatbot systems (Caceres and Paparoidamis, 2007).
According to Komiak (2003), trust comprises of two
dimensions: cognitive and emotional. While
WEBIST 2021 - 17th International Conference on Web Information Systems and Technologies
200
cognitive trust expects that a chatbot service provider
will have the necessary competence, benevolence and
integrity while emotional trust is the feeling of
security and comfort with the service provider.
In this study, we have examined consumer
rationality for examining trust by including
statements which capture the competence,
benevolence, and integrity with chatbots. Eren (2020)
in a study involving bank chatbots users from Turkey
found perceived trust in chatbots to significantly
influence customer satisfaction. While trust in the
context of online customer centric services like online
banking, mobile banking, social media etc. has been
extensively researched, its inclusion in chatbot
adoption studies is scanty. The present study
combines trust and perceived risk with the UTAUT
model and hypothesizes it to be one of the key
antecedents of user satisfaction. Hence, the following
hypothesis is formulated with respect to trust and
satisfaction:
H10: Trust has a positive influence on the satisfaction
with chatbots
3.7 Satisfaction (ST)
According to Nguyen et al. (2021), if users’
expectations from chatbot services are fulfilled and
they feel satisfied after experiencing the same, those
experiences will not only shape their intention but
will push them to continue using chatbots in the
future. Eren (2020) found that if customer
expectations from chatbots are met, it results in a
positive and significant impact on customer
satisfaction. In another study involving using chatbot
services for luxury brand, it was found that perceived
communication accuracy, credibility and competence
positively influences satisfaction (Chung et al., 2020).
Based on the above discission, the following
hypotheses are proposed:
H11: Satisfaction has a positive influence on the
behavioural intention to use chatbots
H12: Satisfaction has a positive influence on the
chatbots adoption
3.8 Behavioural Intention (BI)
Behavioural intention (BI) is defined as "a person's
subjective probability that he will perform intention
some behaviour" (Fishbein and Azjen, 1975). If there
is a strong intention, then the likelihood of that
converting or resulting in an action or behaviour is
very high. In other words, the existence of BI is
critical in shaping a technology usage behaviour.
Prior studies have provided considerable evidence of
the significant effect of BI on actual usage or adoption
in technology acceptance studies (Venkatesh et al.,
2003; Tarhini et al., 2015)>
H13: Behavioural intention has a positive influence
on the chatbot adoption
3.9 Adoption (AD)
The actual system usage or the adoption is the final
stage where a user starts using a technology. It can
also be defined as a user’s initial acceptance of a
technology.
Based on the review of literature various
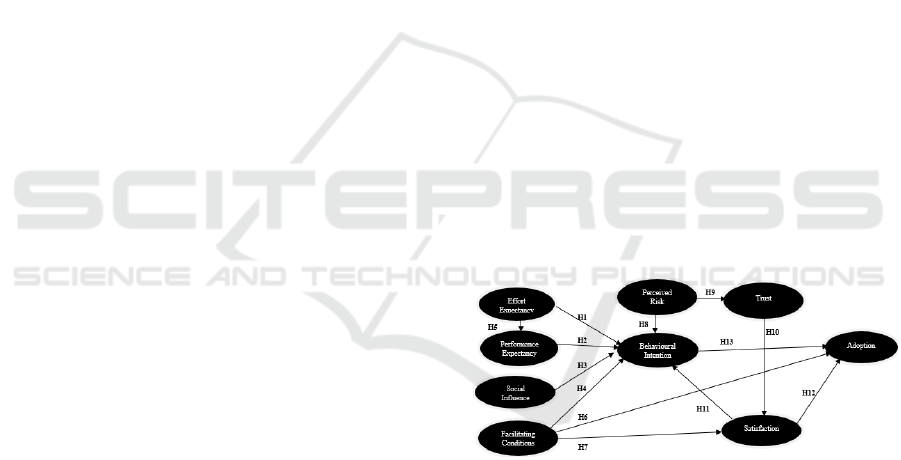
hypotheses were derived. Figure 1 shows the
proposed conceptual model and the related research
hypotheses. The model comprises of six factors of the
UTAUT model (performance expectancy, effort
expectancy, social influence, behavioural intention,
and adoption). An extension of the model has been
proposed by the inclusion of three additional factors
in the chatbot context (perceived risk, trust and
satisfaction). The conceptual model depicts the
relationships between various antecedents of
behavioural intention, adoption and satisfaction.
Insights from the five personal interviews also
strengthened our conceptual model development.
Figure 1: Conceptual Model and Hypotheses.
4 OBJECTIVES OF THE STUDY
The objectives of the study are: 1) To carry out a
systematic review of literature on chatbot adoption
and examine the underlying models 2) To identify the
most frequently discussed constructs by previous
studies and supplement the same with the findings of
the qualitative analysis 3) To propose a conceptual
model and validate the hypothesized relationships
using a quantitative survey carried out among a
sample of Indian chatbot users.
Perception and Adoption of Customer Service Chatbots among Millennials: An Empirical Validation in the Indian Context
201

5 METHODOLOGY
To fulfil the research objectives of the study, a three-
step process was employed. In the first step, an
exploratory study was carried out by reviewing the
existing literature on Chatbot adoption. An extensive
search was carried out in bibliographic databases
using relevant keywords like “chatbot adoption”,
“chatbot intention and satisfaction”, “factors
influencing chatbot adoption”, “antecedents to
chatbot adoption”, “Unified Theory of Acceptance
and Use of Technology”, “UTAUT” etc. The
obtained results were examined for their recency,
appropriateness, and popularity in terms of citations.
After obtaining the list of studies on chatbots, a cross-
table was prepared with authors arranged along the
rows and constructs along the columns. The
underlying model used in the studies was also
documented. Based on the mapping between the two
(see Table 1), the constructs were clustered to
determine the most frequently used constructs.
In the second step, five personal interviews were
conducted with chatbot users labelled as R1 to R5. A
screening question was used to gauge whether the
chatbots users were aware of the application. Six
questions were framed some of which were incorrect
and those respondents who correctly answered all the
questions were shortlisted for personal interview. An
interview template was prepared which included
open-ended questions related to frequently used
chatbot applications; reasons for using chatbots;
positives and negatives about chatbot applications;
factors which influence the chatbot adoption
behaviour; experience using chatbots; and
satisfaction. Each interview was recorded and
transcribed verbatim. Content analysis was
performed on the qualitative data and broad themes
along with statements justifying the same were
extracted. The content analysis resulted in the
generation of few statements which were added to the
established constructs as given in the review of
literature.
In the final step, the hypothesized relationships
were represented in the form of conceptual model and
a survey instrument was designed. The questionnaire
comprised of three sections. Section one comprised
of questions on frequency of chatbot usage and
frequently used chatbot applications. Section two
comprised of perception-based questions on factors
influencing behavioural intention, satisfaction and
adoption measured on a five-point Likert scale
ranging from strongly disagree (1) to strongly agree
(5). The last section captured the user demographic
details. Due to pandemic restrictions, only online
surveys were used for data collection. A convenience
sample along with purposive sample was considered
as most appropriate in the study. Convenience
sampling was deemed appropriate as the authors
personally knew the respondents. Purposive sampling
was utilised to select respondents who extensively
used the internet and chatbots. The idea behind using
these sampling techniques was to get a representative
sample. A total of 250 respondents were mailed the
online survey out of which 70 respondents filled the
survey. Ten responses were omitted as there were no
standard deviation found in their responses pertaining
to the Likert scale questions. 60 responses were
finally considered for subsequent data analysis
indicating a response rate of 24 percent. The
minimum sample size for a PLS model should be at
least ten times the largest number of inner model
paths which in our case is six. Thus, the study meets
the minimum sample requirement of 60 (Hair et al.,
2017).
The sample comprised of more males (35, 58.3%)
than females (25, 41.7%). The minimum and
maximum age of the respondents was 26 and 40
respectively with 31.5 as the median age.
The distribution of all statements in the instrument
was checked for normality distribution. The kurtosis
range was found to be -1.487 to 2.974 and skewness
range was found to be -1.288 and 0.498. Thus, for
majority of statements (35 out of 48) the skewness
and kurtosis values lie between −1 and +1 acceptable
interval. The results show that there was no major
deviation from normal distribution (Hair et al., 2017).
To examine and validate the efficacy of the
conceptual model in explaining user intention, the
current study used the Partial Least Squares Structural
Equation Modelling (PLS-SEM) technique. This
technique employs a two-stage process starting with
the assessment of the measurement model (reliability
and validity) and the estimation of the structural
model (testing the hypothesized relationships).
6 ANALYSIS AND FINDINGS
Smart-PLS 3.0 was used to estimate the measurement
and the structural model.
6.1 Estimation of the Measurement
Model
The measurement model was assessed using
discriminant validity and convergent validity. The
internal consistency was examined using Cronbach
Alpha. As evident from Table 2, the Cronbach’s alpha
WEBIST 2021 - 17th International Conference on Web Information Systems and Technologies
202
value for all constructs was found to exceed 0.70,
which indicate that the measurement is reliable (Lin
and Huang, 2008). Convergent validity refers to how
closely the statements of a multi-item construct are
related to each other. In other words it is the extent to
which a measure relates to other measures of the same
phenomenon (Hair et al., 2017). For convergent
validity, the values of composite reliability (CR)
should be at least 0.7 and the average variance
extracted (AVE) must be greater than the threshold
value of 0.5. As evident from Table 2, the composite
reliability for all constructs was found to be greater
than 0.7 and the AVE was greater than 0.50 thereby
fulfilling the conditions of convergent validity.
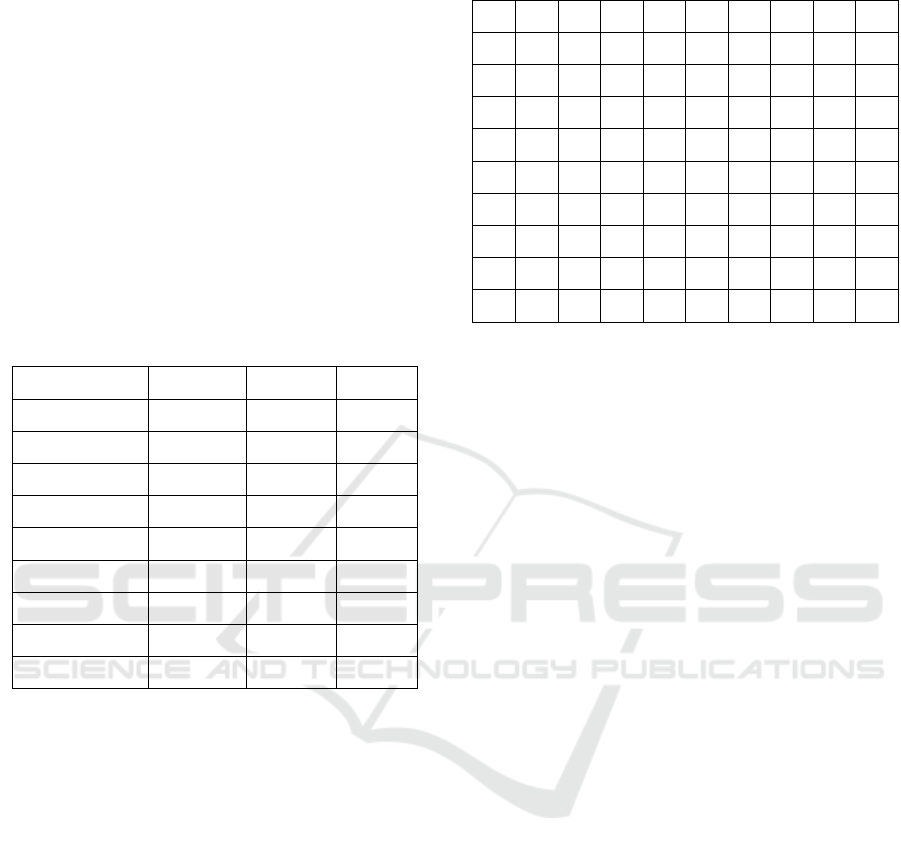
Table 2: Cronbach’s Alpha (CA), Composite Reliability
(CR) and Average Variance Extracted (AVE).
Constructs
CA CR AVE
EE 0.718 0.843 0.649
PE 0.868 0.904 0.655
SI 0.875 0.914 0.726
FC 0.731 0.831 0.552
PR 0.920 0.936 0.675
TR 0.887 0.915 0.644
BI 0.855 0.892 0.580
ST 0.913 0.928 0.591
AD 0.668 0.798 0.500
Discriminant validity of the constructs was assessed
using three methods a) cross-loadings b) Fornell and
Larcker criterion, and c) Heterotrait-Monotrait Ratios
(HTMT). For the first method, the indicator loading
on its own construct should be higher than the loading
on any other construct (Chin, 1998). This condition
was found to be satisfied. The discriminant validity is
satisfied if the square root of the AVE for each
construct is higher than the correlation coefficient
with other constructs (Fornell and Larcker, 1981). In
our case, all the diagonal elements which are the
square root of the AVE are more than the inter-item
correlations reported below the diagonal for the
corresponding constructs (refer Table 3). Further, it is
seen that the HTMT value is below 0.9 (range 0.156
and 0.895) between any two reflective constructs.
Since all the three conditions are satisfied,
discriminating validity is established.
Since the conditions for both convergent and
discriminant validity were met, the measurement
model was considered satisfactory.
Table 3: Discriminant Validity.
AD BI EE FC PE PR ST SI TR
AD .71
BI .57 .76
EE .64 .61 .81
FC .53 .58 .59 .74
PE .62 .75 .76 .54 .81
PR .08 .27 .29 .29 .19 .82
ST .55 .68 .60 .58 .70 .22 .77
SI .59 .67 .68 .52 .71 .13 .69 .85
TR .31 .53 .44 .51 .53 .45 .64 .50 .80
AD: Adoption; BI: Behavioural Intention; EE: Effort
Expectancy; PE: Performance Expectancy; SI: Social
Influence: FC: Facilitating Conditions; PR: Perceived
Risk; TR: Trust: ST: Satisfaction. Diagonal values are
squared roots of AVE; off-diagonal values are the estimates
of the inter-correlation between the latent constructs
6.2 Assessment of the Structural Model
To examine the problem of multi-collinearity of the
inner model, the VIF (Variance Inflation Factor) was
computed for the five endogenous constructs. It was
found that VIF varied from 1.15 to 3.25, 1.68 to 2.08
and 1.35, 1 and 1 for intention, adoption, satisfaction,
performance expectancy and trust respectively. These
values are below the threshold value 3.33
(Diamantopoulos and Siguaw, 2006). Therefore, no
evidence of multicollinearity was found in the present
research.
Since the respondents were asked to answer
questions pertaining to both independent and
dependent variables, common method bias could be a
concern. To check for the presence of common
Method Bias, Harman’s single factor test was
conducted which involves examining the unrotated
factor solution to determine if a single factor accounts
for more than 50 percent of the variance (Podsakoff
et al. 2003). The results indicate that eleven different
factors accounted for 78.59 percent of the variance.
The single largest factor accounted for 35.65 percent,
which is below the threshold, common method bias
doesn’t seem to a problem.
The structural model was estimated by applying
bootstrapping technique, which is a resampling
technique that draws many subsamples, say 5000
from the original data (Vinzi et al., 2010). The
standardized path coefficients (refer Table 4) indicate
the estimates and significance of the hypothesized
relationships between the constructs. Hypothesis H1
Perception and Adoption of Customer Service Chatbots among Millennials: An Empirical Validation in the Indian Context
203
which examines the influence of EE on BI was found
be insignificant with an opposite sign (β = - 0.109, p
=0.427). One of the plausible reasons could be that
the respondents have not explored the full capabilities
of chatbots or have not been able to interpret the
question correctly. Hypothesis H2 relating to
performance expectancy to intention was found to
have a strongest and significant relationship with
respect to intention (β= 0.479, p=0.000). As expected
and consistent with prior research on chatbots (Eren,
2020; Chatterjee and Bhattacharjee, 2020;
Kasilingam, 2020; Melián-González et al, 2021;
Gansser and Reich, 2021), the results show that
performance expectancy is the main predictor of
intention.
Hypotheses H3 (β= 0.195, p=0.068) and H4 (β=
0.163, p=0.195). pertaining to social influence and
facilitating conditions, respectively, with intention
were found to be in the hypothesized direction.
However, only social influence was found to have a
significant influence at 10 percent level of
significance. Hypothesis H5 (β= 0.764, p=0.000),
which examines the influence of effort expectancy on
performance expectancy was found to be strongest
and significant in the entire conceptual model. Thus,
greater is the degree of ease associated with a chatbot
system, greater are the perceived improvements in
personal and professional activities. Hypothesis H6
(β= 0.245, p=0.167), H12 (β= 0.213, p=0.213). and
H13 (β= 0.278, p=0.114) depicting the influence of
facilitating conditions, satisfaction and intention on
adoption were found to be positive but insignificant
indicating that the existence of facilitating conditions,
satisfaction with chatbots and intention influence
adoption although not significantly.
Hypotheses H7 (β= 0.348, p=0.001) and H10 (β=
0.458, p=0.000). which examine the influence of
facilitating condition and trust on satisfaction found
that both the constructs were significant in explaining
satisfaction with chatbots. With respect to hypotheses
H8 (β= -0.107, p=0.219) and H11 (β= 0.160,
p=0.333) which looks at the relationship between
perceived risk and satisfaction on intention it is
evident that higher is the risk, lower is the intention,
and higher the satisfaction higher is the intention.
While both hypotheses are in the right direction, the
influence on intention is insignificant. Further, H9
(β= -0.450, p=0.000) explaining the influence of
perceived risk on trust is found to be significant. In
other words, higher the risk lower would be the trust
with chatbots.
The SmartPLS tool computes the coefficient of
determination (R square) which represents a measure
of predictive power that explains the degree to which
the antecedents explain the variance in an endogenous
construct in the model. In our model, there are five
endogenous constructs namely behavioural intention,
adoption, satisfaction, performance expectancy and
trust. The R square values of these endogenous
constructs are 0.658, 0.403, 0.494, 0.583 and 0.203 in
that order. The proposed model can explain 65.8
percent of the variation in behavioural intention, 40.3
percent in adoption, 49.4 percent in satisfaction, 58.3
percent in performance expectancy and 20.3 percent
in trust.
The cross-validated predictive relevance of
structural model was estimated by calculating Stone
Geisser Q
2
value with an omission distance of 7
(Geisser, 1974; Stone, 1974). Higher is the value of
Q
2
, higher is the predictive accuracy of the model. In
our case, the values of Q
2
are found to be 0.370, 0.343,
0.271, 0.162 and 0.125 respectively for the
endogenous constructs: performance expectancy,
intention, satisfaction, adoption, and trust. Since all
Q
2
values are greater than zero for the endogenous
constructs, it indicates that the values are well
reconstructed, and the model has predictive
relevance.
Lastly, the effect size f² was computed for each
endogenous construct. The f² values of 0.02, 0.15, and
0.35 present small, medium, and large effects (Cohen,
1988). For the endogenous construct intention, PE
had a medium effect size, FC, SI, ST and PR had a
small effect size whereas EE has an insignificant
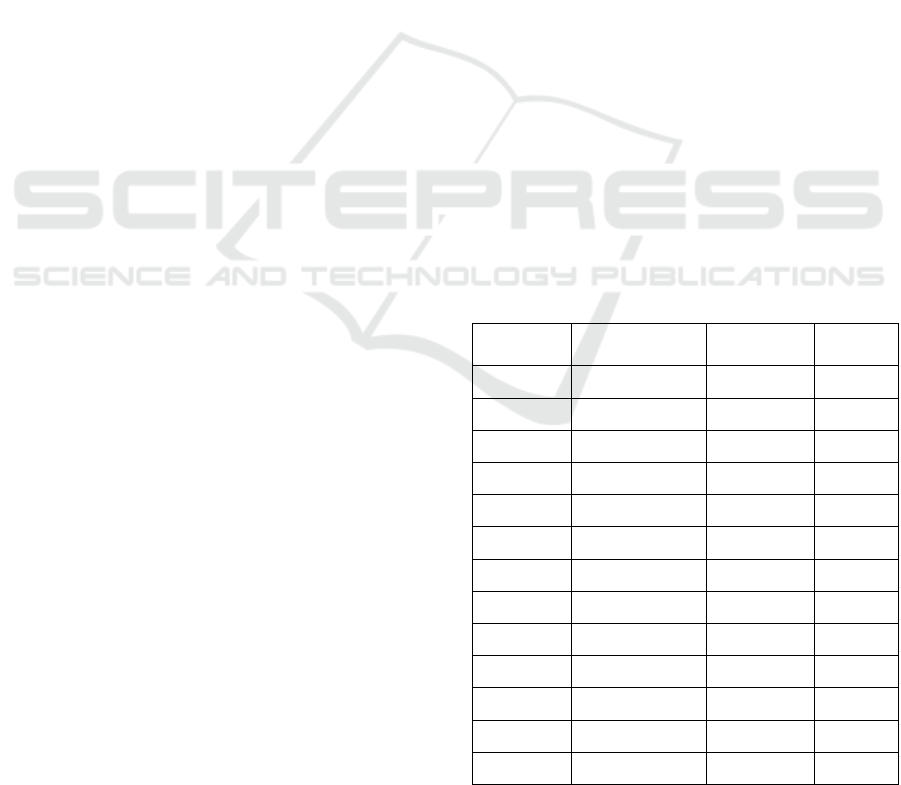
Table 4: Structural Model Estimates.
Hypothesis Relationship
Path
Coefficient
p- value
H1 EE -> BI (+) -0.109 0.427
H2 PE -> BI (+) 0.479 0.000*
H3 SI -> BI (+) 0.195 0.068**
H4 FC -> BI (+) 0.163 0.194
H5 EE -> PE (+) 0.764 0.000*
H6 FC -> AD (+) 0.245 0.167
H7 FC -> ST (+) 0.348 0.001*
H8 PR -> BI (-) -0.107 0.219
H9 PR -> TR (-) -0.450 0.000*
H10 TR -> ST (+) 0.458 0.000*
H11 ST -> BI (+) 0.160 0.333
H12 ST -> AD (+) 0.213 0.213
H13 BI -> AD (+) 0.278 0.114
* indicates significance at 1 percent ** indicates
significance at 10 percent
WEBIST 2021 - 17th International Conference on Web Information Systems and Technologies
204

effect size since the f² value was below 0.02.
Regarding the endogenous construct, adoption, the
exogenous constructs FC, ST and BI had a small
effect size as the f² values were 0.06, 0.037 and 0.062
respectively. For the endogenous construct,
satisfaction, FC and TR were reported to have a
medium effect size as the values obtained were 0.177
and 0.307. With respect to trust, PR had a medium
effect size of 0.254. Lastly, with respect to
performance expectancy, EE had a large effect size as
the f² value was found to be 1.4 which is greater than
0.35.
7 CONCLUSIONS AND
IMPLICATIONS
The results of the structural model indicate that of 17
the proposed 13 hypotheses, six were supported.
Further, out of the remaining seven, six were not
supported though they had the desired hypothesized
direction. In case of H2 (relationship between effort
expectancy and intention), a contrary insignificant
relationship was found.
Performance expectancy seems to be the most
important factor explaining behavioural intention.
Thus, unless a user perceives that using a chatbot will
result in superior performance and enhanced
efficiency and productivity, their intention to use it
would be limited. Use of chatbots is in terms of
queries, doubts, searches and finding relevant results.
Organizations providing chatbot services should keep
in mind that users expect instant responses and short
answers which are simple to comprehend and can
guide users to follow-up questions. These chatbots
should be able to train and re-train themselves to
evolve into intelligent conversational agents. Another
important aspect is the timing of escalating a problem
which cannot be resolved by a chatbot. Unnecessary
inundating the user with back and forth questions can
be irritating. Technology experts can build in these
expectations to enhance user ability to derive better
performance.
Although performance expectancy emerged as an
important determinant, social influence was also
perceived by users as significantly influencing
chatbot intention. Depending on the context, whether
the user is using it in personal capacity or in an
organizational context, the social influence would
vary. In personal communications or transactions
involving chatbots, the influencers could be the
friends and family. In an organization, the
management or the peer community could influence
technology adoption. Since are sample comprise of
millennials, companies offering chatbots services can
target this group through social media and mobile
advertisement to create awareness about chatbot
capabilities.
Facilitating conditions and trust emerged as key
determinants which influence user satisfaction.
Chatbot providers should create chatbot services
which can run on any basic smartphone with decent
internet connectivity. Further, the availability of the
chatbot to communicate and engage in local language
is important. Since a chatbot simulates a human
conversation through artificial intelligence, the user
expectation is that their queries would result in
relevant suggestions which would help in developing
trust with the platform. Chatbot providers must
ensure that service and information quality is good as
poor initial experiences can create doubts resulting in
loss of trust. Professional interactions, quality of
request and advice, ensuring privacy etc. can help in
building trust. Managerial implications for chatbot
providers can be drawn from the findings related to
perceived risk and trust associated with chatbots. To
ensure that user expectation of safe and secure
transaction besides privacy and confidentiality of data
is in place, awareness sessions to educate users about
what user data is collected, how its stored and
analysed must be conducted. Rewards in the forms of
coupons and cashbacks could be a way to introduce
and encourage users to validate the security of the
platform. The managerial implication of this research
is that chatbot providers must pay attention to
perceived usefulness, perceived risk, trust, social
influence and facilitating conditions so as to increase
the satisfaction, intention and adoption of chatbots.
Besides managerial applications, the research
presents an extension of the UTUAT model. The
explanatory power for the model to explain intention
is good.
8 LIMITATIONS AND FUTURE
RESEARCH DIRECTIONS
Like all studies, this study also has few limitations,
which provide directions for future research. First and
foremost, is the small sample size. While the study
meets the minimum sample size criteria, considering
the size and importance of the millennial population,
future study can be carried out with a larger sample
size. A comparison between the perceptions of the
millennial user with Gen Z could add to the existing
body of knowledge on chatbots.
Perception and Adoption of Customer Service Chatbots among Millennials: An Empirical Validation in the Indian Context
205

Secondly, the study was restricted to four
constructs adopted from UTAUT model. Since
UTAUT 2 model has additional constructs like
hedonic motivation, habit, price value etc. future
examinations with these additional constructs could
help in improving our understanding of intention and
usage of chatbots.
Thirdly, we have considered chatbot application
as a broad category. It would be worth exploring how
the hypothesized relationships in the structural model
besides the predictive power compare with respect to
different chatbot applications (for e.g. Online
Shopping, banking, healthcare, tourism to name a
few).
Lastly, we have collected demographic details
like gender, age, income, education etc. Prior
researchers have examined the moderating effect of
these demographic variables. Future studies may be
carried out in this direction.
REFERENCES
Agarwal, R., Rastogi, S., & Mehrotra, A. (2009).
Customers’ perspectives regarding e-banking in an
emerging economy. Journal of Retailing and Consumer
Services. 16(5), 340-351.
Araújo, T., & Casais, B. (2020). Customer Acceptance of
Shopping-Assistant Chatbots. In: Rocha Á., Reis J.,
Peter M., Bogdanović Z. (eds) Marketing and Smart
Technologies. Smart Innovation, Systems and
Technologies, vol 167. Springer, Singapore.
https://doi.org/10.1007/978-981-15-1564-4_26
Autry, C.W., Grawe, S.J., Daugherty, P.J., & Richey, R.G.
(2010). The effects of technological turbulence and
breadth on supply chain technology acceptance and
adoption. Journal of Operations Management, 28(6),
522-536.
Bargas-Avila, J.A., Lötscher, J., Orsini, S., & Opwis, K.
(2009). Intranet satisfaction questionnaire:
development and validation of a questionnaire to
measure user satisfaction with the intranet. Computers
in Human Behaviour, 25 (6), 1241–1250.
Benbasat, I., & Barki, H. (2007). Quo vadis TAM?. Journal
of the Association for Information Systems, 8(4), 211-
218. DOI: 10.17705/1jais.00126
BusinessInsider (2019), Global Chatbot Market
Anticipated to Reach $9.4 Billion by 2024 - Robust
Opportunities to Arise in Retail & eCommerce,
available at
https://markets.businessinsider.com/news/stocks/globa
l-chatbot-market-anticipated-to-reach-9-4-billion-by-
2024-robust-opportunities-to-arise-in-retail-
ecommerce-1028759508 (accessed July 10, 2021).
Caceres, R. C., & Paparoidamis, N.G. (2007). Service
quality, relationship satisfaction, trust, commitment and
business‐to‐business loyalty. European Journal of
Marketing, 41(7/8), 836-867. https://doi.org/10.1108/
03090560710752429
Chatbots Magazine (2018), Chatbot Report 2018: Global
Trends and Analysis, available at https://chatbots
magazine.com/chatbot-report-2018-global-trends-and-
analysis-4d8bbe4d924b (accessed July 11, 2021).
Chatbots Magazine (2019), Chatbot Report 2019: Global
Trends and Analysis, available at https://chatbotsmaga
zine.com/chatbot-report-2019-global-trends-and-
analysis-a487afec05b (accessed July 11, 2021).
Chatterjee, S., & Bhattacharjee, K.K. (2020). Adoption of
artificial intelligence in higher education: a quantitative
analysis using structural equation modelling. Education
and Information Technologies, 25, 3443–3463.
https://doi.org/10.1007/s10639-020-10159-7
Chin, W. W. (1998). The partial least squares approach to
structural equation modeling. Lawrence Erlbaum
Associates, Mahwah, New Jersey
Chung, M., Ko, E., Joung, H., & Kim, S. J. (2020). Chatbot
e-service and customer satisfaction regarding luxury
brands. Journal of Business Research, 117, 587-595.
Cohen J. (1988). Statistical Power Analysis for the
Behavioral Sciences. Mahwah, NJ: Lawrence Erlbaum
Davis, F. D. (1989). Perceived usefulness, perceived ease
of use, and user acceptance of information technology.
MIS Quarterly, 13(3), 319–340
Diamantopoulos, A., & Siguaw, J.A. (2006). Formative
versus reflective indicators in organizational measure
development: a comparison and empirical illustration,
British Journal of Management, 17(4), 263-282.
EMarketer (2018), Customer Service Seekers Prefer
Bypassing Humans, available at https://www.
emarketer.com/content/customer-service-seekers-
prefer-bypassing-humans (accessed July 1, 2021).
Eren, B.A. (2021). Determinants of customer satisfaction in
chatbot use: evidence from a banking application in
Turkey. International Journal of Bank Marketing,
39(2), 294-311. https://doi.org/10.1108/IJBM-02-
2020-0056
Fishbein, M., & Ajzen, I. (1975). Belief, Attitude, Intention,
and Behavior: An Introduction to Theory and Research.
Reading, MA: Addison-Wesley.
Fornell, C., & Larker, D. F. (1981). Evaluating Structural
Equation Models with Unobservable Variables and
Measurement Error. Journal of Marketing Research,
18(1), 39-50
Gangwar, H., Date, H., & Raoot, A.D. (2014). Review on
IT adoption: insights from recent technologies. Journal
of Enterprise Information Management, 27(4), 488-
502.
Gansser, O. A., & Reich, C. S. (2021). A new acceptance
model for artificial intelligence with extensions to
UTAUT2: An empirical study in three segments of
application. Technology in Society, 65, 101535
Gefen, D., Karahanna, E.,& Straub, D. W. (2003). Trust and
TAM in Online Shopping: An Integrated Model. MIS
Quarterly, 27 (1), 51-90.
Geisser, S. (1974). A predictive approach to the random
effect model. Biometrika, 61(1), 101–107.
WEBIST 2021 - 17th International Conference on Web Information Systems and Technologies
206

Hair, J. F., Hult, G. T. M., Ringle, C. M., and Sarstedt, M.
(2017). A Primer on Partial Least Squares Structural
Equation Modeling (PLS-SEM). 2 nd Ed., Thousand
Oakes, CA: Sage.
Kasilingam, D. L. (2020). Understanding the attitude and
intention to use smartphone chatbots for shopping.
Technology in Society, 62, https://doi.org/10.1016/
j.techsoc.2020.101280.
Khechine, H., Lakhal, S., & Ndjambou, P. (2016). A meta-
analysis of the UTAUT model: Eleven years later.
Canadian Journal of Administrative Sciences / Revue
Canadienne Des Sciences de l’Administration, 33(2),
138–152. doi:10.1002/cjas.1381
Komiak, X.S. (2003). The Impact of Internalization and
Familiarity on Trust and Adoption of Recommendation
Agents, Dissertation, MIS division, the University of
British Columbia, Vancouver available at
https://open.library.ubc.ca/cIRcle/collections/ubcthese
s/831/items/1.0091325
Liao, C., Palvia, P., & Chen, J.-L. (2009). Information
technology adoption behavior life cycle: Toward a
Technology Continuance Theory (TCT). International
Journal of Information Management, 29(4), 309-320.
Lin, H-F. (2011). An empirical investigation of mobile
banking adoption: The effect of innovation attributes
and knowledge-based trust. International Journal of
Information Management, 31(3), 252–260.
Lin, T.-C., & Huang, C.-C. (2008). Understanding
knowledge management system usage antecedents: an
integration of social cognitive theory and task
technology fit. Information & Management, 45(6), 410-
417
Mantra Labs (2019), How chatbots are changing the digital
Indian, available at https://www.mantralabsglobal.
com/blog/how-chatbots-are-changing-the-digital-
indian/ (accessed July 5, 2021)
Melián-González, S., Gutiérrez-Taño, D. & Bulchand-
Gidumal, J. (2021). Predicting the intentions to use
chatbots for travel and tourism. Current Issues in
Tourism, 24(2), 192-210, DOI:
10.1080/13683500.2019.1706457.
(PDF) Predicting the intentions to use chatbots for
travel and tourism. Available from:
https://www.researchgate.net/publication/338126211_
Predicting_the_intentions_to_use_chatbots_for_travel
_and_tourism [accessed Sep 09 2021].
Mcknight, D. H., Carter, M., Thatcher, J. B., & Clay, P. F.
(2011). Trust in a specific technology. ACM
Transactions on Management Information Systems,
2(2), 1–25. doi:10.1145/1985347.1985353
Nguyen, D.M., Chiu, Y.-T.H., & Le, H.D. (2021).
Determinants of Continuance Intention towards Banks’
Chatbot Services in Vietnam: A Necessity for
Sustainable Development. Sustainability, 13, 7625.
https://doi.org/10.3390/su13147625
Oliver, R. L. (1980). A cognitive model for the antecedents
and consequences of satisfaction. Journal of Marketing
Research, 17 (4), pp. 460-469
Pillai, R., & Sivathanu, B. (2020). Adoption of AI-based
chatbots for hospitality and tourism. International
Journal of Contemporary Hospitality Management,
32(10), 3199-3226. https://doi.org/10.1108/IJCHM-04-
2020-0259
Podsakoff, P. M., MacKenzie, S. B., Lee, J. Y., &
Podsakoff, N. P. (2003). Common method biases in
behavioral research: a critical review of the literature
and recommended remedies. Journal of Applied
Psychology, 88(5), 879-903.
Seo, K.-H., & Lee, J.-H. (2021). The Emergence of Service
Robots at Restaurants: Integrating Trust, Perceived
Risk, and Satisfaction. Sustainability, 13, 4431.
Shaw, N. (2014). The mediating influence of trust in the
adoption of mobile wallet. Journal of Retailing and
Consumer Services, 21(4), 449-459
Stone, M. (1974). Cross-validatory choice and assessment
of statistical predictions. Journal of the Royal
Statistical Society, 36(2), 111-147.
Tarhini, A., El-Masri, M., Ali, M., & Serrano, A. (2016).
Extending the UTAUT model to understand the
customers’ acceptance and use of internet banking in
Lebanon: A structural equation modeling approach.
Information Technology & People, 29(4), 830-849.
Taylor, S., & Todd, P. (1995). Decomposition and
crossover effects in the Theory of Planned Behavior: A
study of consumer adoption intentions. International
Journal of Research in Marketing, 12 (2) 137–155.
Teo, T., Lee, C. B., & Chai, C.S. (2007). Understanding
pre-service teachers' computer attitudes: applying and
extending the technology acceptance model. Journal of
Computer Assisted Learning, 24(2), 128-143
Thompson, R., Higgins, C., & Howell, J. (1991). Personal
Computing: Toward a Conceptual Model of Utilization.
MIS Quarterly, 15(1), 125-143.
Venkatesh, V., Morris, M. G., Davis, G. B., & Davis, F. D.
(2003). User Acceptance of Information Technology:
Toward a Unified View. MIS Quarterly, 27(3), 425-
478.
Venkatesh, V., Thong, J.Y., & Xu, X. (2012). Consumer
acceptance and use of information technology:
extending the unified theory of acceptance and use of
technology. MIS Quarterly, 36 (1), pp. 157-178
Vinzi, V. E., Chin, W.W., Henseler, J., Wang, H. (2010),
Handbook of Partial Least Squares: Concepts, Methods
and Applications, Springer Handbooks of
Computational Statistics.
APPENDIX
Appendix – 1 Please indicate your agreement or
disagreement on the following statements
Performance Expectancy (PE)
(Source: Venkatesh et al., 2012)
Chatbots:
• help me accomplish things more quickly
• are useful in my daily life (N)
• enable me to complete the task efficiently
Perception and Adoption of Customer Service Chatbots among Millennials: An Empirical Validation in the Indian Context
207

• enhances my task effectiveness
• give relevant suggestions (N)
Effort Expectancy (EE)
(Source: Gefen et al., 2003; Venkatesh et al, 2012)
Chatbots:
• interaction is clear and understandable.
• are flexible to interact with
• are anticipative and intuitive in nature (N)
Social Influence (SI)
(Source: Venkatesh et al, 2012)
• Peers who influence my behaviour think that
I should use chatbots
• Peers important to me think that I should use
chatbots
• Organization peers promotes and supports
the use of chatbots
• Peers whose opinion I value prefer that I use
chatbots
Facilitating Conditions (FC)
(Source: Venkatesh et al, 2012)
• I have the resources needed to use chatbots
• I have the knowledge needed to use chatbots
• Chatbots are compatible with other
technologies I use
• I know whom to seek help when I face
difficulties in using chatbots
Perceived Risk (PR)
Chatbots:
• makes me vulnerable to potential fraud (N)
• makes me feel unsafe (N)
• appear to be suspicious (N)
• can misuse your personal information (N)
• are risky (N)
• puts my privacy at risk (N)
• exposes me to an overall risk (N)
Trust (TR)
(Source: Gefen et al., 2003)
• I don’t think chatbots are harmful
• Chatbots are trustworthy
• I do not doubt the honesty of chatbots
• I feel there are adequate legal provisions for
problems with chatbots
• Chatbots do not involve any user monitoring
• Overall, I trust chatbot transactions
Behavioural Intention (BI)
(Source: Venkatesh et al., 2012)
In the next one year
• I intend to use chatbots
• I predict to use chatbots
• I plan to continue using chatbots
• I will use chatbots in my daily life (N)
• I will prefer chatbots over human interaction
(N)
Adoption (AD)
I use chatbots to:
• generate product purchase suggestions (N)
• order product online (N)
• make online reservations (N)
• to get the latest news updates (N)
Satisfaction (ST)
Bargas-Avila et al. (2009)
Suggestions made by chatbots are:
• complete
• easy to understand
• personalized (N)
• relevant
• secure (N)
• reliable (N)
• flexible
• integrated (N)
• accessible
Notes: N means new statements
WEBIST 2021 - 17th International Conference on Web Information Systems and Technologies
208
