
Process Mining Analytics for Industry 4.0 with Graph Signal Processing
Georgios Drakopoulos
1 a
, Eleanna Kafeza
2 b
, Phivos Mylonas
1 c
and Spyros Sioutas
3
1
Department of Informatics, Ionian University, Greece
2
College of Technology and Innovation, Zayed University, U.A.E.
3
Computer Engineering and Informatics Department, University of Patras, Greece
Keywords:
Process Mining, Industry 4.0, Graph Signal Processing, Graph Mining, Multilayer Graphs, PM4Py, Neo4j.
Abstract:
Process mining is the art and science of (semi)automatically generating business processes from a large num-
ber of logs coming from potentially heterogeneous systems. With the recent advent of Industry 4.0 analog
enterprise environments such as floor shops and long supply chains are bound to full digitization. In this
context interest in process mining has been invigorated. Multilayer graphs constitute a broad class of combi-
natorial objects for representing, among others, business processes in a natural and intuitive way. Specifically
the concepts of state and transition, central to the majority of existing approaches, are inherent in these graphs
and coupled with both semantics and graph signal processing. In this work a model for representing business
processes with multilayer graphs along with related analytics based on information theory are proposed. As a
proof of concept, the latter have been applied to large synthetic datasets of increasing complexity and with real
world properties, as determined by the recent process mining scientific literature, with encouraging results.
1 INTRODUCTION
Recently the theory and practice of manufacturing un-
derwent a series of radical evolutionary transforma-
tions after a long period covering Antiquity and the
Middle Ages where humans, whether slaves or highly
paid technicians and professionals, animals, and sim-
ple machines such as Heron’s steam engine or Aeolip-
ile were the primary means of production. The roots
of each major milestone can be respectively traced in
the following historical periods:
• The Victorian era
1
in the wake of a major scien-
tific wave saw the massive transition to hydraulic
power for a broad spectrum of applictions. The
uncontested colophon of that era was the develop-
ment of steam engine.
• Between the French-Prussian war of 1871 up to
the start of First World War in 1914 heavy em-
phasis was placed on developing extensive net-
works, whether physical, such as railroads and
a
https://orcid.org/0000-0002-0975-1877
b
https://orcid.org/0000-0001-9565-2375
c
https://orcid.org/0000-0002-6916-3129
1
The technology of that era and the promises it brought
about human life led to the steampunk subculture and liter-
ary genre.
post offices, or telecommunication ones, like the
telegraph and local telephone systems. These net-
works prompted the construction of massive as-
sembly lines and supply chains.
• Finally, after the end of the Second World War in
1945 and until the beginning of the 21st century
focus shifted on digitization and miniaturization,
eventually giving rise to microelectronics and dig-
ital computers. The main paradigm shift here was
the reinforcement not only of the human body but
of the brain as well.
Currently Industry 4.0, originally a set of speci-
fications compiled in 2011 by the Bundesregierung,
namely the federal German government, aims to
transform manufacturing landscape by introducing
the use of sensors, artificial intelligence (AI), and In-
ternet of Things (IoT) technology in order to increase
productivity, cybersecurity, and personnel safety. In
this way diverse operational objectives from various
scopes can be achieved even under quite adverse cir-
cumstances. At the same time human-to-machine and
machine-to-machine will become seamless and more
efficient through wearable electronics for humans and
reconfigurable sensor arrays for machines.
In this digital enterprise setting the role of process
mining is becoming increasingly more important as
large event logs are created by a multitude of commer-
Drakopoulos, G., Kafeza, E., Mylonas, P. and Sioutas, S.
Process Mining Analytics for Industry 4.0 with Graph Signal Processing.
DOI: 10.5220/0010718300003058
In Proceedings of the 17th International Conference on Web Information Systems and Technologies (WEBIST 2021), pages 553-560
ISBN: 978-989-758-536-4; ISSN: 2184-3252
Copyright
c
2021 by SCITEPRESS – Science and Technology Publications, Lda. All rights reserved
553

cial business applications and big process graphs are
generated for various production purposes. Given that
data volume and its high generation rate, errors are
almost bound to happen. They are frequently mani-
fested in the absence or addition of spurious vertices
or edges at the process graphs. However, a more in-
sidious result is the changes to process graph seman-
tics as errors are more subtle and can be thus propa-
gated undetected in the process graph.
The primary research objective of this conference
paper is the development of edge, path, and trian-
gle similarity metrics for evaluating the difference be-
tween any template process graph and a correspond-
ing variant one. Said difference is evaluated with a
metric enriched with semantics represented as edge
labels which is derived from information theory. This
work differentiates from previous approaches in two
ways, namely the use of multilayer graphs in order to
represent long Industry 4.0 processes and the use of
the emerging field of graph signal processing (GSP).
The remaning of this work is structured as follows.
In Section 2 the recent scientific literature pertaining
to process mining and multilayher graphs is briefly re-
viewed. Section 3 contains the formal definition of as
well as some intuituion about mulilayer graphs. The
proposed methodology is described in detail in sec-
tion 4. The results of applying it to synthetic pro-
cess benchmark graphs of increasing complexity are
given in section 5. Section 6 recapitulates the main
results and outlines future research directions. Tech-
nical acronyms are defined the first time they are en-
countered in the text. In definitions parameters are
given after formal arguments following a semicolon.
Finally, table 1 summarizes the notation of this work.
Table 1: Notation of this conference paper.
Symbol Meaning First
4
= Equality by definition Eq.(1)
{
s
1
,...,s
n
}
Set with s
1
,. ..,s
n
Eq.(2)
(t
1
,. ..,t
n
) Tuple with t
1
,. ..,t
n
Eq.(1)
|
S
|
Set or tuple cardinality Eq.(3)
logit(p) Logit function Eq.(5)
[e
1
,. ..,e
p
] Path of edges e
1
,. ..,e
p
Eq.(12)
H (·) Harmonic mean Eq.(5)
2 PREVIOUS WORK
Industry 4.0 is a major milestone in the history of in-
dustrial organization and production (da Rosa Righi
et al., 2020). It aims to the full digitization of in-
dustrial production through a wide array of sensors
installed in machinery and in wearable electronics
for human operators as well as through delegation
of minor, mundane, or dangerous tasks to computer-
operated equipment (Bigliardi et al., 2020). Various
sensor architectures based on the Industry 4.0 require-
ments have been proposed and compared in (Bajic
et al., 2020). Operational criteria and considerations
for the industrial equipment are examined in (Culot
et al., 2020). The connections between Industry 4.0
and circular economy are explored in (Rajput and
Singh, 2019). The principal question of sustainabil-
ity is put in (Bai et al., 2020). An extensive review of
the relevant bibliography about Industry 4.0 is given
in (Souza et al., 2020).
Process mining relies heavily on the parsing of
automatically generated process logs in order to dis-
cover patterns, latent dependencies, and persistent
anomalies (Mitsyuk et al., 2017; Reinkemeyer, 2020).
The IEEE extensive event stream (XES) or IEEE stan-
dard 1849-2016 is a standard log file format designed
for the explicit purpose of process mining proposed
in (Acampora et al., 2017). Automated log mining is
explained in (Egger et al., 2020). PM4py is a Python
package for process mining complete with methods
for pattern discovery and miners such as A and A
+
(Berti et al., 2019). Dealing with malformed or oth-
erwise imperfect process logs is examined in (Suri-
adi et al., 2017). Context-aware process mining with
the introduction of advanced graph mining is the topic
of (Becker and Intoyoad, 2017). The role of process
mining to auditing information systems is described
in (Zerbino et al., 2018). Finally, among the various
surveys covering the topic are (Lopes and Ferreira,
2019) and (Verenich et al., 2019).
Multilayer or multiplex graphs allow parallel
edges between the same pairs of vertices (Caimo and
Gollini, 2020; Halnaut et al., 2020). As with ordi-
nary graphs massive graph mining for this class can
take place with the help of graph analytics (Zhou
and Cheung, 2019) including attribute engineering
(Drakopoulos and Mylonas, 2020). Also multilayer
graphs have been proposed as a scalable IoT model
(Xie et al., 2020). Functional and structural aspects of
brain circuits are combined to form multilayer graphs
in (Mandke et al., 2018). Visualization techniques
for multilayer graphs are explored in (McGee et al.,
2019). Semi-supervised learning methods for this
class of graphs are proposed in (Mercado et al., 2019).
Multilayer graphs have been used for image segmen-
tation (Wang et al., 2016), spectral graph clustering
(Chen and Hero, 2017), fast graph transform mining
(Drakopoulos et al., 2021). A versatile, presistent,
and space efficient data structure for process storage
is proposed in (Kontopoulos and Drakopoulos, 2014).
WEBIST 2021 - 17th International Conference on Web Information Systems and Technologies
554

3 MULTILAYER GRAPHS
Informally speaking, the class of multilayer graphs
represents graphs with multiple edge labels. The
name comes from the fact when considering only a
single given label, then an ordinary graph termed a
layer results. Thus, a multilayer graph can be decom-
posed to various layers. The total activity in such a
graph comes from the following interacting factors:
• Activity in each separate layer. This happens at
the vertices and edges of the specific layer.
• Activity across layers. Typically this takes place
at the vertices belonging to at least two layers.
The above imply that any extension of Metcalfe’s
law (Metcalfe, 2013) to multilayer graphs should take
into account both these factors if the true graph value
is to be determined. Possibly this entails a compos-
ite power law which will be a function of the overall
average degree or the average degree of each layer.
Formally, the combinatorial structure of a multi-
layer graph is given by definition 1.
Definition 1 (Mutilayer graph). A multilayer graph is
the ordered quadruple of equation (1).
G
4
= (V,E,L, h) (1)
In equation (1) the tuple elements are the following:
• The vertex set V contains the vertices of the graph.
In this context vertices represent special states,
namely the beginning or the end of a process or
important intermediate steps.
• The edge set E ⊆ V ×V × L contains the labeled
edges of the graph. They indicate dependencies
or the various connections between either process
states or entire processes.
4 PROPOSED METHODOLOGY
4.1 General Notes
In this section the proposed methodology based on
the class of multilayer graphs will be described. First
the way edge similarity is computed will be presented
followed by applications to paths and triangles, two of
the most common structural pattterns encountered in
process mining graphs. Then the edge signal to noise
ratio, a concept borrowed and adapted from the field
of information theory, will be also presented.
At this point it is important to highlight that the
theory developed here is based on the following un-
derlying fundamental assumption.
Assumption 1 (Alignment assumption). The tem-
plate and the variant process graphs are aligned.
This is not a trivial observation as alignment is
a major research topic in graph mining, ontology
discovery, and in related fields (Dasiopoulou et al.,
2008). The approaches range from combinatorial to
linear algebraic and signal processing ones.
Moreover, emphasis should be placed that the
comparison metrics described in this section were
explicitly designed for evaluating distances between
the original process graph and the variant graph, ex-
plained respectively in definitions 2 and 3.
Definition 2 (Process graph). The process graph is
the template describing in detail the desired process
mining assumptions, approach, and operational char-
acteristics of an organization.
Definition 3 (Variant graph). The variant
graph is the process mining graph constructed
(semi)automatically from parsing process logs,
equipment sensors, personnel reports, and any other
technical means deployed in the field.
Since the original process graph and any variant
one deriving from it are aligned, each edge e in the
latter has a unique counterpart e
0
in the former. Hence
it makes perfect sense to refer in the text to the coun-
terpart of e without any further clarification.
4.2 Edge SNR
Since multilayer graphs allow multiple edges between
the same pair of vertices, for comparison purposes as
well as for notation simplification a group of labeled
edges can be replaced with a single edge with a set,
the edge set, containing the labels of the respective in-
dividual edges. In figure 1 is shown how various par-
allel labeled edges can be substituted with an equiva-
lent label set. This step is crucial for developing the
analytics presented in later sections.
Therefore, in a process graph for a given vertex
pair a group of connecting edges e
1
,. ..,e
n
with cor-
responding labels l
1
,. ..,l
n
L is replaced by a single
edge e with the edge set of equation (2):
L
4
=
{
l
1
,. ..,l
n
}
(2)
The basic building block for assessing the simi-
larity between process patterns is edge similarity. In
order to evaluate the similarity between two edges,
one from the process graph and one from the template
graph, it suffices to compare the respective label sets.
To this end the asymmetric Tversky index will be em-
ployed. The latter evaluates the divergence between
two sets T and V where the former is considered to
be a template and the latter a variance thereof. Thus
Process Mining Analytics for Industry 4.0 with Graph Signal Processing
555

Figure 1: Construction of the edge label set. Source: Authors.
these two sets are by construction not interchange-
able. This fundamental property is reflected in the
index mathematical definition (Tversky, 1977):
τ(T,V ; α
0
,β
0
)
4
=
|
T ∩V
|
|
T ∪V
|
+ α
0
|
T \V
|
+ β
0
|
V \ T
|
(3)
In equation (3) the parameters α
0
and β
0
denote
respectively the weights for the number of elements
present in T but absent in V and vice versa. Although
their only real constraint is that they are non-negative,
frequently their sum is normalized to one such that
α
0
and β
0
become relative weights. This is further
illustratred by typically selecting their values such
that their ratio takes a predetermined and application-
dependent value γ
0
as shown in equation (4):
α
0
β
0
= γ
0
(4)
These changes to process graphs labels can be
thought of as noise similar to that present in digi-
tal electronics-based wired (DEBW) telecommunica-
tions systems. Although based on this observation
certain concepts such the signal-to-noise ratio (SNR)
can be defined, the label noise is fundamenally differ-
ent because of the following reasons:
• In contrast to DEBW systems where the primary
source of noise is continuous due to the nature,
the complexity, and the cumulative effect of elec-
tronic components, any changes to edge labels un-
der the proposed model are discrete.
• In DEBW systems the noise is arithmetic in nature
and leads to probabilistic errors, where in process
graphs the label noise under consideration is cat-
egorical and results in semantic errors. Still the
latter can be probabilistically represented.
• In DEBW systems noise comes from the elec-
tronics components located in the transmitter and
the receiver or from the propagation medium,
whereas changes to labels stem primarily from de-
sign or communication errors.
Given the above it is clear that the additive white
Gaussian noise (AWGN) model is not appropriate in
this context and by extension neither is the Gaussian
distribution a proper model for the label noise.
SNR is a fundamental concept in information the-
ory which serves in the development for metrics of
signal distorion over telecommunication channels.
Definition 4 (Edge SNR). For a single edge of the
variant process graph the SNR is defined as the loga-
rithm of the ratio of to as shown in equation (5). The
edge SNR is always relative to an aligned reference
template graph and e
0
is the corresponding edge to e.
s(e; e
0
)
4
= ln
τ(L, L
0
)
1 − τ(L,L
0
)
= logit (τ(L, L
0
)) (5)
The intuition behind equation (5) is that s(e) is
the order of magnitude of the similarity between the
process edge and its template divided by their respec-
tive distance. Both the similarity and the distance are
quantified with the Tversky index, which leads to the
special form of the SNR. By construction said index
lies between zero and one, which also gives rise to the
question whether this imposes lower and upper limits
to SNR, both desirable in many engineering settings.
The SNR of definition 4 is an odd function around
the axis x
0
= 1/2, namely the middle point of the
range of the Tversky index, as shown in equation (6):
logit(1 − τ) = ln
1 − τ
1 − (1 − τ)
= −logit (τ)
logit
1
2
= ln
1
2
1 −
1
2
= ln1 = 0 (6)
Among the significant properties of the logit(·)
function, which can serve as building blocks for so-
phisticated SNR metrics, are the following:
• In general linear regression is the canonical link
function of the Bernoulli distribution, meaning
that it allows linear regression when the output is
a binary or Bernoulli random variable.
• It is the inverse of the standard logistic function
ϕ(·) shown in equation (7). Therefore, logit (·)
maps logistically distributed input to the real axis.
ϕ(x; λ
0
)
4
=
1
1 + exp(−λ
0
x)
(7)
• It roughly approximates the information content
of the ratio of two random samples, one from a
logistic distribution and one from its reflection.
• Moreover, the logit(·) can be approximated by a
rescaled probit (·) function. This can be useful
when the Tversky index in definition 4 is close to
its domain limits to ensure numerical stability.
WEBIST 2021 - 17th International Conference on Web Information Systems and Technologies
556

In equation (5) the selection of the logarithm base
does not have any effect on the outcome besides
rescaling it, which is tantamount to selecting the units
in which the SNR is expressed as shown in equation
(8). The natural logarithm in definition 4 has been
selected because of its algorithmic properties.
log
a
b =
log
c
a
log
c
b
, a,b, c 6= 0 (8)
The numerical behavior of s with respect to
τ(L, L
0
) in equation (5) is degrading as label noise
vanishes or as it creates excessive divergence from the
template edge as shown in equation (9):
∂s
∂τ
=
1
τ(1 − τ)
=
1
τ
+
1
1 − τ
(9)
From equation (9) it can be seen that the first
derivative of the edge SNR can be interpreted as the
sum of two equivalent hyperbolic modes which are
also reflections of each other. Moreover, the form of
(9) is a direct consquence of the fact that probit (·)
is the inverse of the standard logistic function ϕ(x) as
mentioned earlier. Recall that ϕ (x) is the non-singular
solution of the non-linear differential equation of (10),
connecting ϕ(x) with Verhulst population models:
ϕ
(1)
(x) = ϕ(x) (1 − ϕ(x)) (10)
The second derivative of the edge SNR can be
computed from equation (9) yielding equation (11):
∂
2
s
∂τ
2
=
2τ − 1
τ
2
(1 − τ)
2
=
1
(1 − τ)
2
−
1
τ
2
(11)
Equation (11) is essentially an inverse cubic func-
tion with each of the two poles of (9) having a mul-
tiplicity of two. Moreover, it changes sign when τ
is around the single zero 1/2. When 1 − τ is treated
as a pseudoindepedent variable, then the second edge
SNR derivative becomes a hyperbola in the axes of τ
(secondary) and its reflection 1 − τ (primary).
In figure 2 the edge SNR of equation (5) and its
first derivative of equation (9) are shown. The latter
has been rescaled and translated so that both are zero
when the Tversky index equals 1/2
4.3 Path SNR
Given that most non-trivial industrial processes take
more than a singe step to complete, it makes perfect
sense to extend the SNR of definition (5) to more than
one edges. In this subsection the case of linear di-
rected paths, meaning they contain neither crossings
nor cycles, of arbitrary length is examined. Initially,
let p be a directed path in a process graph consisting
of n labeled edges as shown in equation (12):
p
4
= [e
1
,. ..,e
n
] (12)
0 0.2 0.4 0.6 0.8 1
-4
-2
0
2
4
6
Tversky index
SNR s and s’
SNR s and s’ vs Tversky index
s
s’/4-1
Figure 2: Label SNR vs Tversky index. Source: Authors.
The formal description of the SNR for an entire
path in the above sense is given in definition 5.
Definition 5 (Path SNR). The SNR of a linear di-
rected path of a variant process graph relative to an
aligned template graph is the harmonic mean of the
individual SNRs of the edges constituting that path.
s(p)
4
=
n
∑
n
k=1
1
s(e
k
)
4
= H (s (e
1
),...,s(e
n
)) (13)
The harmonic mean of equation (13) has been se-
lected because of its many appealing algorithmic and
numerical properties. Specifically:
• It is robust to any zero or near zero, namely close
to machine precision, values of s (e
k
). In the lim-
iting case, it handles edges with no similarity with
their corresponding ones in the template graph.
• It is symmetric with respect of the individual edge
SNRs. Moreover, the order in which the denomi-
nator terms has no effect. Therefore, similar paths
are expected to have similar SNRs.
• Since the order of the denominator summands is
irrelevant, numerical phenomena like catastrophic
cancellation can be avoided by employing stable
numerical algorithms such as Priest summation.
• The harmonic mean is relatively insensitive to any
outliers and therefore it is considered to yield a
more representative value out of a given set of
numbers while respecting certain distributions.
The vector of independent variables s contains the
SNR of each individual edge of the path p under con-
sideration. The differentiation of s(p) in equation
(15) and (16) will be with respect to this vector.
s
4
=
s(e
1
) .. . s(e
n
)
T
(14)
Process Mining Analytics for Industry 4.0 with Graph Signal Processing
557

The Jacobian vector h of (13) consists of the vec-
tor of the partial first derivatives as shown in (15). Its
interpretation is that it represents the local gradient.
h
4
= ∇
s
s(p)
=
∂s(p)
∂s(e
1
)
∂s(p)
∂s(e
2
)
.. .
∂s(p)
∂s(e
n
)
T
=
n
∑
n
k=1
1
s(e
k
)
2
1
s(e
1
)
2
.
.
.
1
s(e
n
)
2
(15)
The symmetry of the path SNR is reflected in the
Jacobian vector which is isotropic. Therefore the gra-
dient is independent of the way the path SNR is ap-
proached but instead depends on the distance from the
point the gradient refers to. The Hessian matrix H of
(13) can be computed from (15) giving (16). The Hes-
sian represents the local curvature of s (p).
H
4
= ∇
s
∇
T
s
s(p)
=
∂
2
s(p)
∂s(e
1
)
2
.. .
∂
2
s(p)
∂s(e
1
)∂s (e
n
)
∂
2
s(p)
∂s(e
2
)∂s (e
1
)
.. .
∂
2
s(p)
∂s(e
2
)∂s (s
n
)
.
.
.
.
.
.
.
.
.
∂
2
s(p)
∂s(e
n
)∂s (e
1
)
.. .
∂
2
s(p)
∂s(e
n
)
2
(16)
The Hessian elements are computed as follows:
H[i, j] =
4n
s(e
i
)
5
1 −
s(e
i
)
2
2
∑
n
k=1
1
s(e
k
)
∑
n
k=1
1
s(e
k
)
3
,i = j
4n
s(e
i
)
2
s(e
j
)
3
1
∑
n
k=1
1
s(e
k
)
3
,i 6= j
(17)
From the form of the Hessian matrix the following
observations can be made:
• The path length n plays a role in local curvature.
Thus long paths tend to have more curvature.
• Each edge contributes not only to local but also to
global patterns.
4.4 Triangle SNR
Triangles are the simplest yet most fundamental com-
munity blocks in graphs as well as the first closed
graph structural pattern. By extending the path SNR
metric to any given triangle T yields equation (18):
s(T )
4
= H (s (e
1
), s(e
2
), s(e
3
)) (18)
A major property of graph triangles, especially in
the broad class of power law or scale free graphs,
is that despite their small size they constitute im-
portant structural components. Triangles contribute
to the global graph modularity and compactness be-
cause they are locally interwoven. This provides mul-
tiple alternative short paths between a number of ver-
tices which are frequently resilient to the deletion of
a small number of local and non-bridge edges.
5 RESULTS
In this section the similarity metrics presented earlier
are put to test. Synthetic datasets based on the follow-
ing real world Industry 4.0 requirements were con-
structed. Specifically, the benchmarks will be graph
datasets generated to have many of the process graph
properties reported in the recent process mining scien-
tific literature in works such as (Verenich et al., 2019)
and (Acampora et al., 2017). These include:
• The total number of vertices and edges as well as
the number of labels of the template graph.
• The average graph diameter as well as the effec-
tive 70%, 80%, and 90% graph diameters.
• The expected number of triangles, which is a ma-
jor indicator of graph structural coherence.
• The expected path length and the associated vari-
ance, which reveals local and global information.
Table 2 contains the synopses of template graphs
used in this work. Each is a Kronecker graph com-
ing from a generator graph of lower size. In order to
create the variant graphs labels where either added or
removed at random from edges of the template graph.
Label addition and removal was done with the Pois-
son distribution of equation (19) with µ
0
equal to the
mean number of labels in each graph.
p
k
4
=
µ
k
0
k!
e
−µ
0
(19)
For each template graph ten thousand instances
were created. The average values and the respec-
tive variances for each metric were recorded. Cod-
ing was done in Python 3.8 with the numpy and the
scipy packages for analysis. Graphs were created and
handled with the NetworkX package.
WEBIST 2021 - 17th International Conference on Web Information Systems and Technologies
558
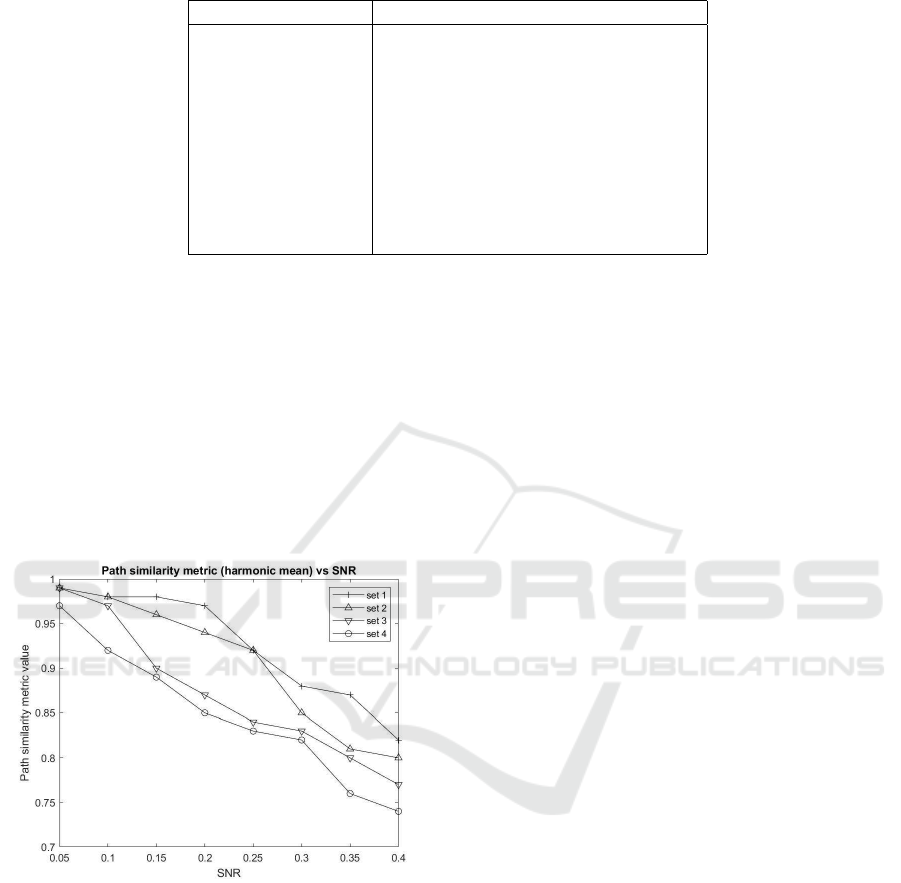
Table 2: Dataset properties.
Property Set 1 Set 2 Set 3 Set 4
Generator vertices 5 5 7 7
Generator edges 7 8 13 17
Template vertices 3125 15625 16807 16807
Template edges 16807 262144 371293 1419857
Label set size 16 32 48 64
Labels per edge 6.53 11.67 28.44 32.33
Diameter 11 13 15 16
80% effective 7 9 11 12
90% effective 8 11 13 15
Number of triangles 625 33125 67617 212881
From the dataset synopses presented in table 2 it
follows that they have an increasing level of complex-
ity, implying that more complex datasets pose a big-
ger challenge for analytics designers.
In figure 3 the average edge SNR as a function
of the normalized path legth. Specifically, the path
length is expressed as a fraction of the respective
graph diameter. It can be seen that edge SNR is a
decreasing function of both the overall process graph
complexity as well as of the path length. This can be
explained as path similarity degrades as more steps as
added to an industrial process.
Figure 3: SNR vs path length. Source: Authors.
6 CONCLUSIONS
This conference paper focuses on a process mining
model for Industry 4.0 based on the class of multi-
layer graphs as well as on associated analytics. This
class of graphs extends the ordinary ones by adding
edge labels, essentially semantics based on the under-
lying process logs. This is appealing since edges can
have properties depending on their role in the over-
all process and, moreover, edges denoting tasks ex-
ecuted in parallel along the same check points can
be combined to a single one with a label set. As
high degree task parallelism, typically due to multiple
sensor readings, is a very common characteristic of
an Industry 4.0 setting, edges with label sets of even
a moderate size arise frequently. In turn, these sets
can be the building blocks for a number of analytics
for the distance between the process graph, namely
the actual graph as mined from the various system
and process logs, and the template graph, namely the
blueprint process graph as derived by system design-
ers. Analytics based on this distance metric include
path and vertex similarity metrics as well as a mod-
ified clustering coefficient. Experiments conducted
with synthetic datasets indicate that these analytics
can discover errors in multilayer graphs while at the
same time being algorithmically robust and numeri-
cally stable, given the large number of floating points
operations required to derive the final result.
ACKNOWLEDGEMENTS
This conference paper was supported by the Research
Incentive Fund (RIF) Grant R18087 provided by Za-
yed University, UAE.
REFERENCES
Acampora, G., Vitiello, A., Di Stefano, B., van der Aalst,
W., G
¨
unther, C., and Verbeek, E. (2017). IEEE 1849:
The XES standard. IEEE Computational Intelligence
Magazine, 12(2):4–8.
Bai, C., Dallasega, P., Orzes, G., and Sarkis, J. (2020). In-
dustry 4.0 technologies assessment: A sustainability
perspective. International Journal of Production Eco-
nomics, 229.
Bajic, B., Rikalovic, A., Suzic, N., and Piuri, V. (2020).
Industry 4.0 implementation challenges and opportu-
nities: A managerial perspective. IEEE Systems Jour-
nal.
Process Mining Analytics for Industry 4.0 with Graph Signal Processing
559

Becker, T. and Intoyoad, W. (2017). Context aware process
mining in logistics. Procedia Cirp, 63:557–562.
Berti, A., van Zelst, S. J., and van der Aalst, W. M. (2019).
PM4Py Web Services: Easy development, integration
and deployment of process mining features in any ap-
plication stack. In BPM (PhD/Demos), pages 174–
178.
Bigliardi, B., Bottani, E., and Casella, G. (2020). Enabling
technologies, application areas and impact of Industry
4.0: A bibliographic analysis. Procedia Manufactur-
ing, 42:322–326.
Caimo, A. and Gollini, I. (2020). A multilayer exponen-
tial random graph modelling approach for weighted
networks. Computational Statistics & Data Analysis,
142.
Chen, P.-Y. and Hero, A. O. (2017). Multilayer spectral
graph clustering via convex layer aggregation: The-
ory and algorithms. IEEE Transactions on Signal and
Information Processing over Networks, 3(3):553–567.
Culot, G., Nassimbeni, G., Orzes, G., and Sartor, M. (2020).
Behind the definition of Industry 4.0: Analysis and
open questions. International Journal of Production
Economics, 226.
da Rosa Righi, R., Alberti, A. M., and Singh, M. (2020).
Blockchain Technology for Industry 4.0. Springer.
Dasiopoulou, S., Saathoff, C., Mylonas, P., Avrithis, Y.,
Kompatsiaris, Y., Staab, S., and Strinztis, M. G.
(2008). Introducing context and reasoning in visual
content analysis: An ontology-based framework. In
Semantic Multimedia and Ontologies, pages 99–122.
Springer.
Drakopoulos, G., Kafeza, E., Mylonas, P., and Iliadis, L.
(2021). Transform-based graph topology similarity
metrics. NCAA, 1(1).
Drakopoulos, G. and Mylonas, P. (2020). Evaluating graph
resilience with tensor stack networks: A keras imple-
mentation. NCAA, 32(9):4161–4176.
Egger, A., ter Hofstede, A. H., Kratsch, W., Leemans, S. J.,
R
¨
oglinger, M., and Wynn, M. T. (2020). Bot log min-
ing: Using logs from robotic process automation for
process mining. In International Conference on Con-
ceptual Modeling, pages 51–61. Springer.
Halnaut, A., Giot, R., Bourqui, R., and Auber, D. (2020).
Deep dive into deep neural networks with flows. In
VISIGRAPP, volume 3, pages 231–239.
Kontopoulos, S. and Drakopoulos, G. (2014). A space effi-
cient scheme for graph representation. In ICTAI, pages
299–303. IEEE.
Lopes, I. F. and Ferreira, D. R. (2019). A survey of pro-
cess mining competitions: The BPI challenges 2011–
2018. In International Conference on Business Pro-
cess Management, pages 263–274. Springer.
Mandke, K., Meier, J., Brookes, M. J., O’Dea, R. D.,
Van Mieghem, P., Stam, C. J., Hillebrand, A., and
Tewarie, P. (2018). Comparing multilayer brain net-
works between groups: Introducing graph metrics and
recommendations. NeuroImage, 166:371–384.
McGee, F., Ghoniem, M., Melanc¸on, G., Otjacques, B., and
Pinaud, B. (2019). The state of the art in multilayer
network visualization. In Computer Graphics Forum,
pages 125–149. Wiley Online Library.
Mercado, P., Tudisco, F., and Hein, M. (2019). General-
ized matrix means for semi-supervised learning with
multilayer graphs. arXiv preprint arXiv:1910.13951.
Metcalfe, B. (2013). Metcalfe’s law after 40 years of Ether-
net. Computer, 46(12):26–31.
Mitsyuk, A. A., Shugurov, I. S., Kalenkova, A. A., and
van der Aalst, W. M. (2017). Generating event logs
for high-level process models. Simulation Modelling
Practice and Theory, 74:1–16.
Rajput, S. and Singh, S. P. (2019). Connecting circular
economy and Industry 4.0. International Journal of
Information Management, 49:98–113.
Reinkemeyer, L. (2020). Process Mining in Action: Princi-
ples, Use Cases and Outlook. Springer Nature.
Souza, M. L. H., da Costa, C. A., de Oliveira Ramos, G.,
and da Rosa Righi, R. (2020). A survey on decision-
making based on system reliability in the context
of Industry 4.0. Journal of Manufacturing Systems,
56:133–156.
Suriadi, S., Andrews, R., ter Hofstede, A. H., and Wynn,
M. T. (2017). Event log imperfection patterns for pro-
cess mining: Towards a systematic approach to clean-
ing event logs. Information Systems, 64:132–150.
Tversky, A. (1977). Features of similarity. Psychological
Review, 84(4):327.
Verenich, I., Dumas, M., Rosa, M. L., Maggi, F. M., and
Teinemaa, I. (2019). Survey and cross-benchmark
comparison of remaining time prediction methods in
business process monitoring. ACM TIST, 10(4):1–34.
Wang, T., Ji, Z., Sun, Q., Chen, Q., and Jing, X.-Y. (2016).
Interactive multilabel image segmentation via robust
multilayer graph constraints. IEEE Transactions on
Multimedia, 18(12):2358–2371.
Xie, C., Yu, B., Zeng, Z., Yang, Y., and Liu, Q. (2020).
Multilayer Internet-of-Things middleware based on
knowledge graph. IEEE Internet of Things Journal,
8(4):2635–2648.
Zerbino, P., Aloini, D., Dulmin, R., and Mininno, V. (2018).
Process-mining-enabled audit of information systems:
Methodology and an application. Expert Systems with
Applications, 110:80–92.
Zhou, Y. and Cheung, Y.-m. (2019). Bayesian low-tubal-
rank robust tensor factorization with multi-rank deter-
mination. IEEE TPAMI.
WEBIST 2021 - 17th International Conference on Web Information Systems and Technologies
560
